Overview of C360/R360 Sections and Widgets
Gainsight NXT
This article explains the CSMs about the C360 Sections and the Summary widgets available in the C360/R360 page.
Overview
The Customer 360 (C360) is a central hub of your customer’s business information in Gainsight. It synthesizes business data from various sources and provides you with a holistic view of your customers. This minimizes the preparation time for your customer meetings. To access the Customer 360 view, click the customer name hyperlink from anywhere within Gainsight, ex: Global search box, Call to Action (CTA), etc.
The 360 view is available for both Company as well as Relationships (if your org has configured Relationships in Gainsight). You can view the business information related to a Relationship from the specific Relationship 360 (R360) page. For more information on the Relationships in Gainsight, refer to the Relationships Overview article.
You can find the following information from C360 view:
- From the Summary section, you can quickly know your customer’s health score (From Scorecards section), ARR, NPS®/Survey Responses, Open CTAs, product usage data, etc.
- Relationships, Persons, and Sponsors associated with this customer.
- Access Timeline from the 360; for more information on Timeline, refer to the Timeline Overview article.
- Reports linked from Report Builder using Reports (Ex: Reports created on CTAs like “Show me open CTAs for this customer”)
- Success Plans associated with this customer.
- Person section displaying people hierarchy and Influencer relation type.
CSMs can perform the following actions from the C360 page:
- Configure Relationships
- Log Activities from Timeline
- Add Persons and Sponsors
- Create CTAs and Success Plans
- Customize the 360 sections to fit your organization needs
Options in the C360/R360 Page
The following are the options you can perform in the C360/R360:
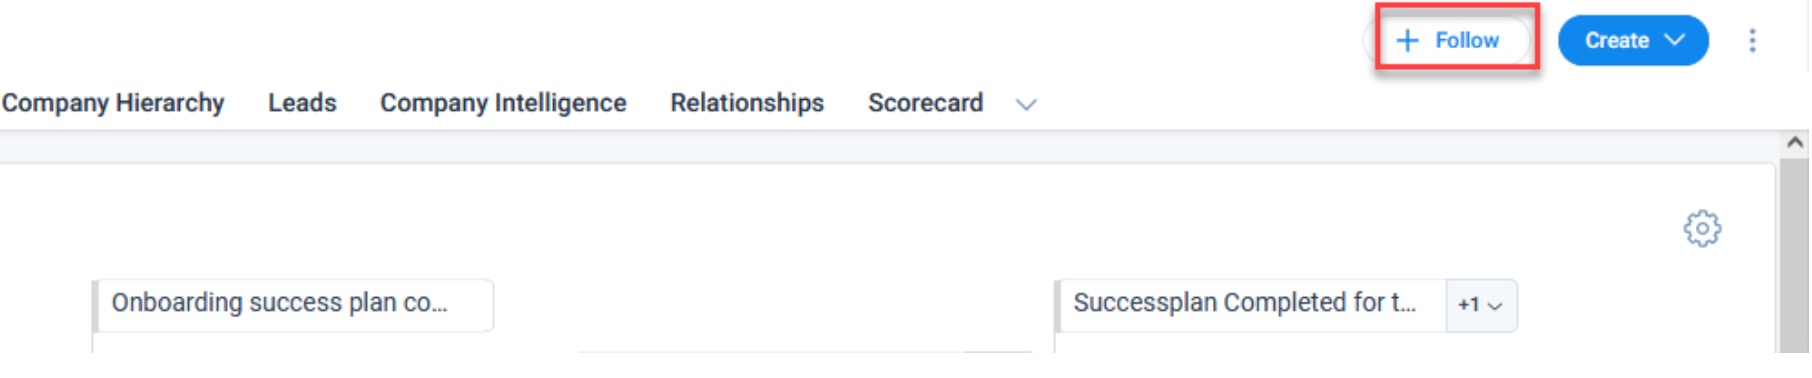
- Follow: You can follow the company to receive notifications about all the updates of the company or Relationship.
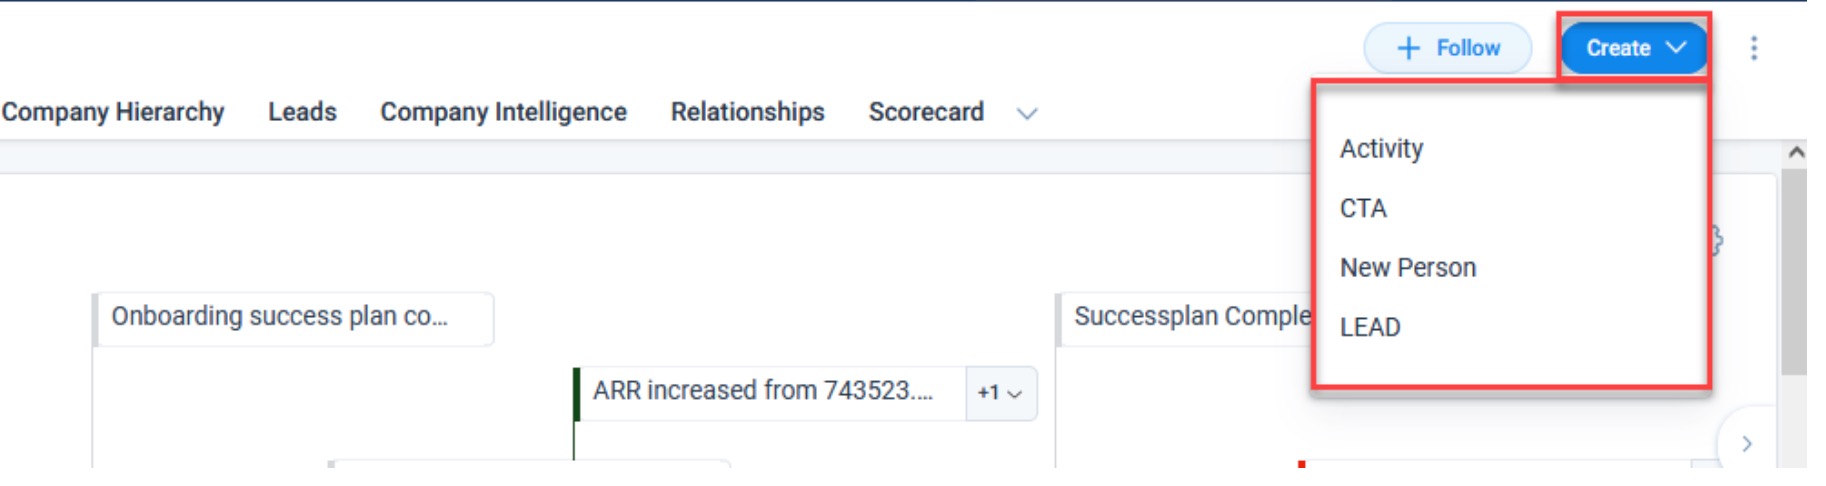
- Quick Actions: You can create a CTA, Activity, Lead, and Person using the Create button located at the top right corner of the C360. In the R360, you can create Activity and Person.
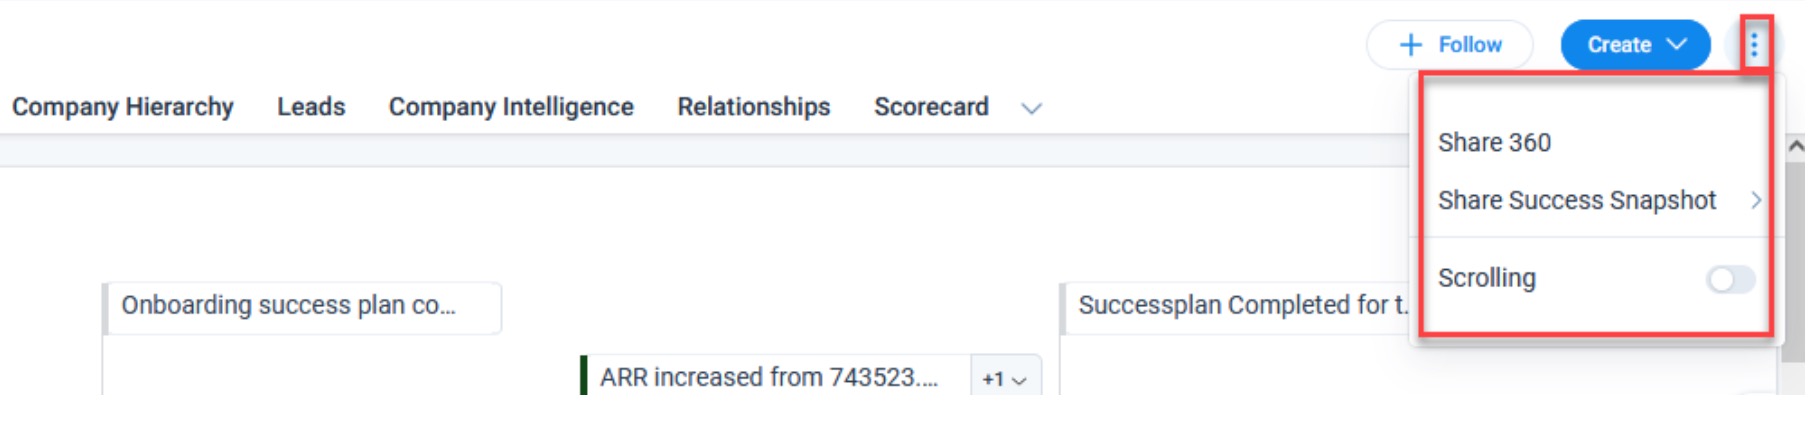
- Share 360: You can share a C360 page using the configured layout, through email as a link, with optional security settings. (This is not applicable to R360)
- Share Success Snapshots: Once Admins setup a Success Snapshots template from Administration > Success Snapshots, users can export a presentation file for any customer from the C360/R360 page.
- Scrolling: Switch ON the toggle button to scroll through the sections in the C360/R360 detail view. Switch OFF the toggle button to disable the scrolling.
- Personalize Sections: You can customize the sections and their order in the C360/R360.
To personalize C360/R360 section:
- Navigate to the C360 page of a company.
- Click the Sections dropdown and then click Personalize Sections.
- In the Unpinned section, click the pin icon of the sections.
- In the Pinned section, drag and drop to reorder the sections.
- Click Save.
C360/R360 Sections and Widgets
The following sections are the sections and widgets available in the C360/R360:
Note: The following section and widget are only available in C360:
- Section: Company Hierarchy, Company Intelligence, Forecast, Leads, and Relationship.
- Widget: Renewal date, Company Intelligence, and Leads.
Attributes
The Attributes section allows you to see data in a record from the Company object. You can see fields from the Company object that have been added by the admin in the Attributes section configuration. You can also perform inline edits to the attributes in this section by clicking the edit icon next to a field. You cannot make inline edits to the non-editable fields as configured by the admin.
In the Summary section, the following widget is available:
- Attribute widget: You can add Attribute widget in the Summary section to see data in a record from the Company object.
Limitation: Gainsight does not support pasting text from text editors such as the Notepad and Notepad++ into the Attributes section. Text that is added this way is saved, but the formatting is removed.
Cockpit
In the Cockpit section, you can see all your Calls to Actions (CTAs) for a company which could be a combination of Events, Opportunities and/or Risks. You can view open and closed CTAs in this page. These CTAs can be added manually or can be triggered as configured in the business rules to warn of issues or flag opportunities.
In the Summary section, the following widget is available from the Cockpit:
- Open CTAs: This widget displays a bar graph of all the Open CTAs of the customer across all owners. Each bar represents a CTA type.
For more information on how to manage Cockpit, refer to the Use Cockpit to Manage Daily Routine article.
Create CTA Using the Global Create Button
The global Create button appears on the top of all the tabs in C360. Users can click Create and select CTA to create CTA from here. For more information on creating CTAs, refer to the Create Manual Call to Action (CTAs) and Tasks (Horizon Experience) article.
Company Hierarchy
In the Company Hierarchy section, CSMs view the parent and child companies of the current company as well sibling relationships between child companies that have the same parent. Apart from parent and child details, CSMs can also view various important metrics of child and parent companies (if configured by admin). For example, if a company is a parent company for three children companies, CSMs can view the ARR of the parent company, ARR of the three child companies, and also the combined ARR of all four companies. For more information on Company Hierarchy, refer to the View Company Hierarchy article.
Company Intelligence
Company Intelligence helps users to stay informed about their customers and competitors. It provides updates to the users through the Slack, Email, and Company Intelligence section in C360. Users can view publicly available information on the companies and signals that the admin has configured. Contact your Gainsight Admin to get Company Intelligence feature enabled in your Tenant. For more information on Company Intelligence, refer to the Company Intelligence articles.
In the Summary section, the following widget is available from the Company Intelligence:
- Company Intelligence Widget: Users can add the Company Intelligence widget in the Summary section of C360. The widget displays the latest information of the Companies they follow based on the signals configured by the Gainsight Admin.
Embed Page
With the Embed Page section, you can configure a section of the C360 to access a web page via a URL. You can use path parameters and query parameters to define variables for the embedded URL.
Forecast Section
The Forecast section in C360 helps CSMs to view and analyze the opportunity data directly in C360 without navigating to the Renewal Center.
The Forecast section in C360 provides CSMs with the following capabilities:
- View and edit the opportunities directly in C360.
- Edit the opportunities inline.
- Create, edit, or share the required Views.
- View a list of standard and shared Views,
- Export the list of Opportunities from C360
Renewal Center Widget
This widget displays the renewal due date that enables CSMs to understand renewals in the context of health and forecast category, especially where there is misalignment.
Leads Section
Customer Success teams identify and share leads with Sales. CSMs can use this feature to identify a lead, share it with sales via CRM, and report on the revenue impact.This feature provides a standard method to track the leads, analyze leads data, and generate lead reports.
Admins need to add the Lead section into the C360 layout for your company and configure the Leads feature from the Administration section.
Create and Manage Leads
You can create and manage the lead details from the Lead section of C360 layout. For more information on the admin configurations, refer to the Configure Leads article. For more information on how to create and manage leads, refer to the CSQL in C360 article.
In the Summary section, the following widget is available from the Leads:
- Leads Widget: The total count of the leads for the company is displayed in the Leads widget in CSM Summary.
Relationship Section
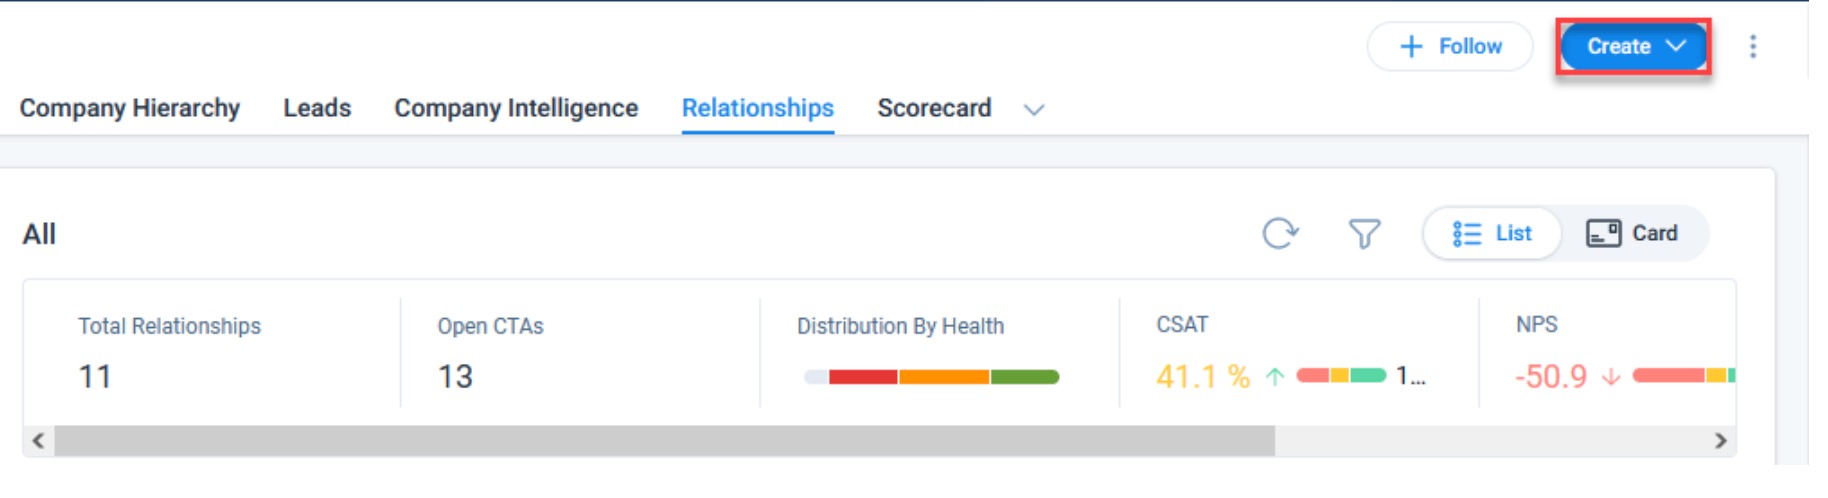
Relationship is a Gainsight object that can be used to model multiple perspectives by creating relationship types and relationships, which helps your Customer Success team manage the success of each relationship. Relationships take Customer Success beyond managing Companies. It helps the Customer Success team manage each connection point (Relationship) with your customer. You can perform the following actions from the Relationships view:
- Click the Relationship dropdown list to select the Custom Reports added by your admin, and also you can filter relationships based on the Relationship Types.
- You can switch between the Card View and List View. Card View displays the Relationship Types and List View displays the Reports. For the custom reports shown in the list view, you can use the reporting options such as: Selecting a Visualization type, applying Ranking, modifying Filters and Export options.
Note: You can filter each view to display All Relationship Types, but this filter is disabled for the List View if there are more than ten Relationship Types to display. This limitation is to prevent display issues within the view. - Filter based on status such as Active or Inactive to see the relationships relevant to you.
- In the Summary Ribbon, you can view upto 6 important data as configured by the Admin.
For more information on relationships, refer to the Relationships Overview article.
Report Section
The Reports section in C360 displays reports created in Report Builder. The reports to be displayed are selected by admins while configuring this section. Reports created on the same object can be displayed in groups if admins have grouped them while adding the reports to the C360 layout.
You can also refresh the report, change the visualization type and maximize the report by clicking the corresponding icons at the top of the report.
Users can click the vertical three dots for any report to perform the following functions:
![]()
-
Add Filters
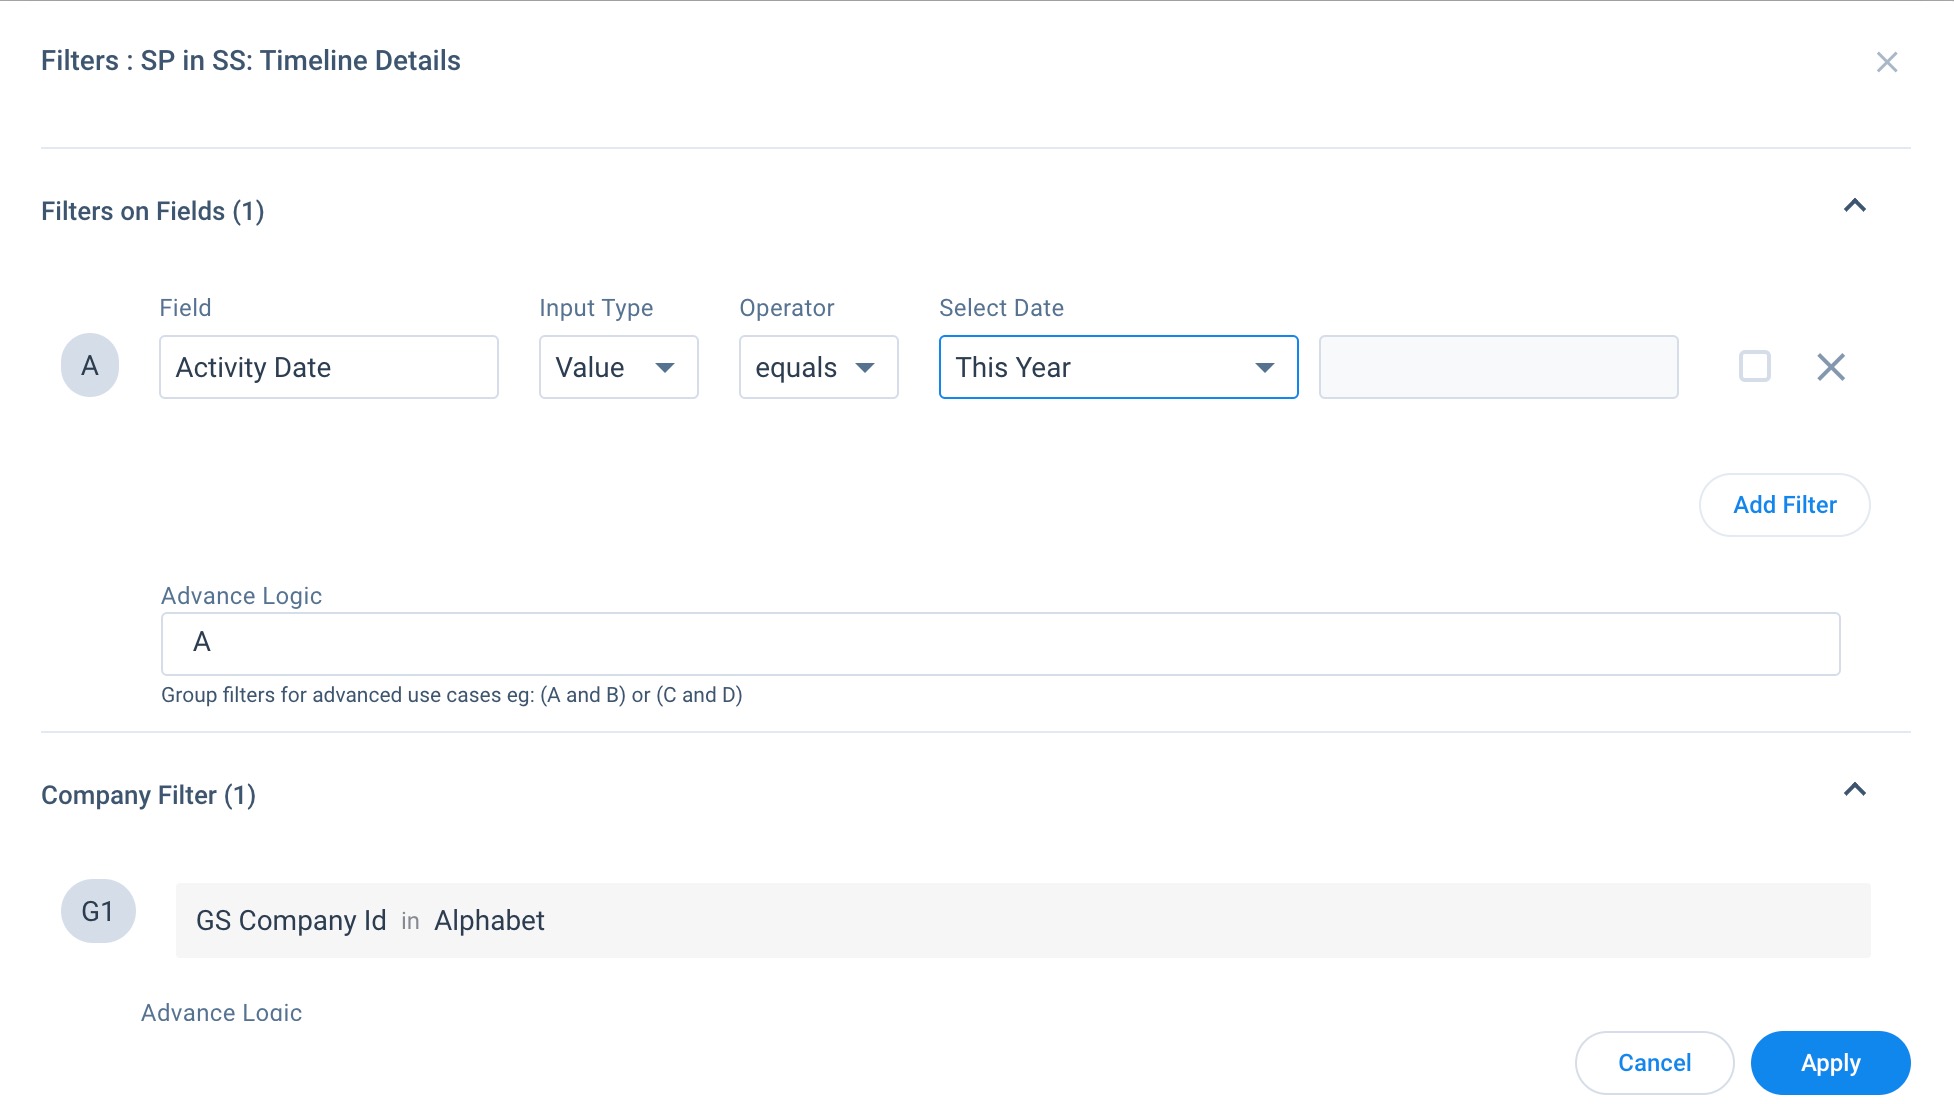
-
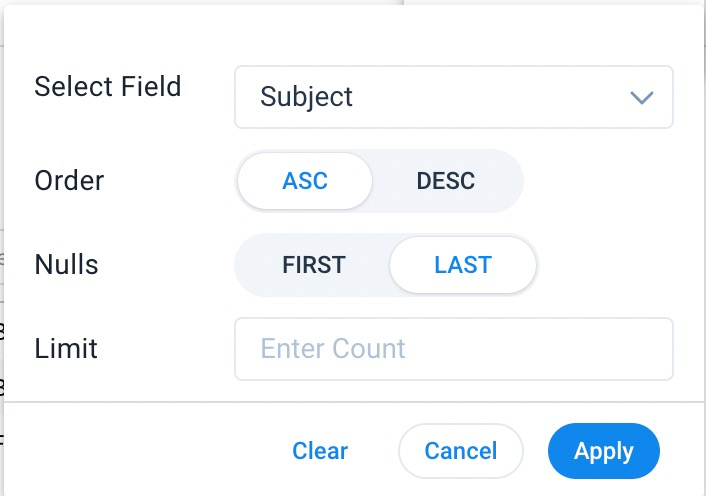
Change the order of Ranking for report fields by selecting them from the dropdown menu as follows:
- Reset the report to its original state
- Download the report in “.xls” format
- Download an image of the report
Reports Created on Low Volume Objects
Reports that are created on low-volume custom objects can be edited in the C360 Reports tab. You can add records to such reports, edit existing records and preview the record data as follows.
To add a new record:
- Click the Add Records button at the top of the report.
- In the slide-out Add Record panel, enter the details required to create the record.
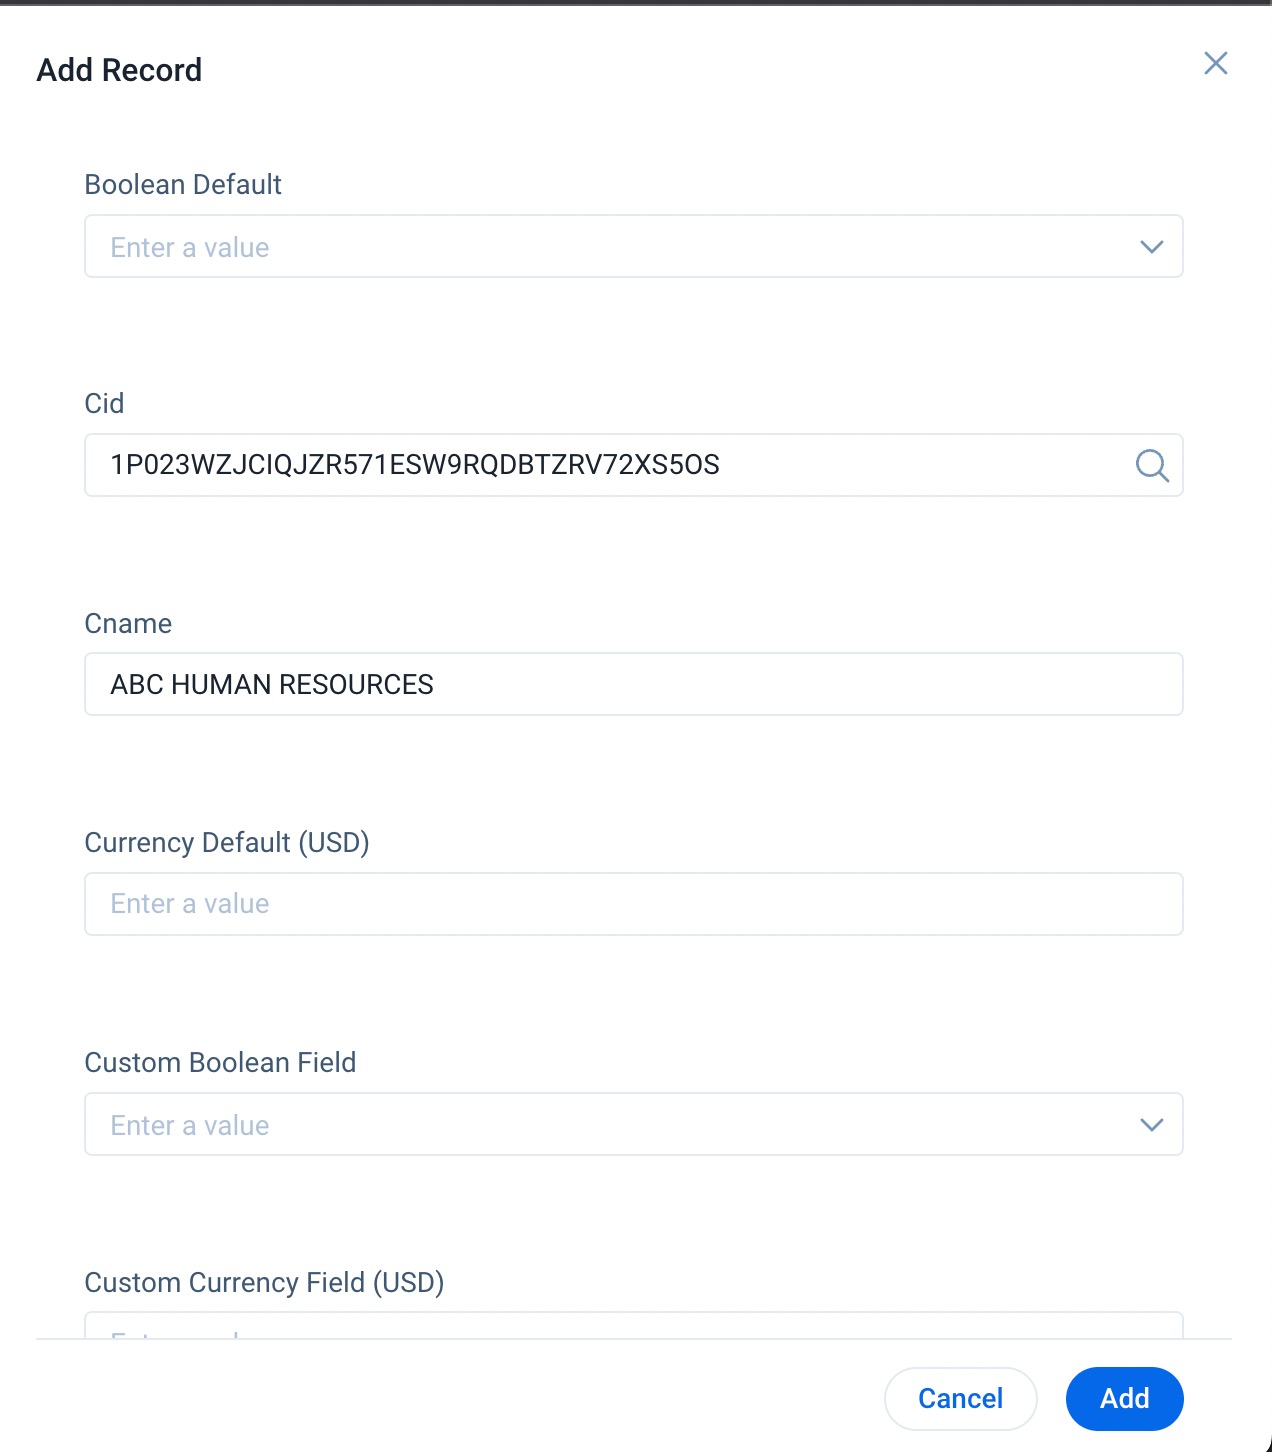
-
Click Add to add the new record.
To edit an existing record:
- Navigate to the record you wish to edit and click the three dots. Select Edit.
- In the slide-out panel, enter the new details.
- Click Save.
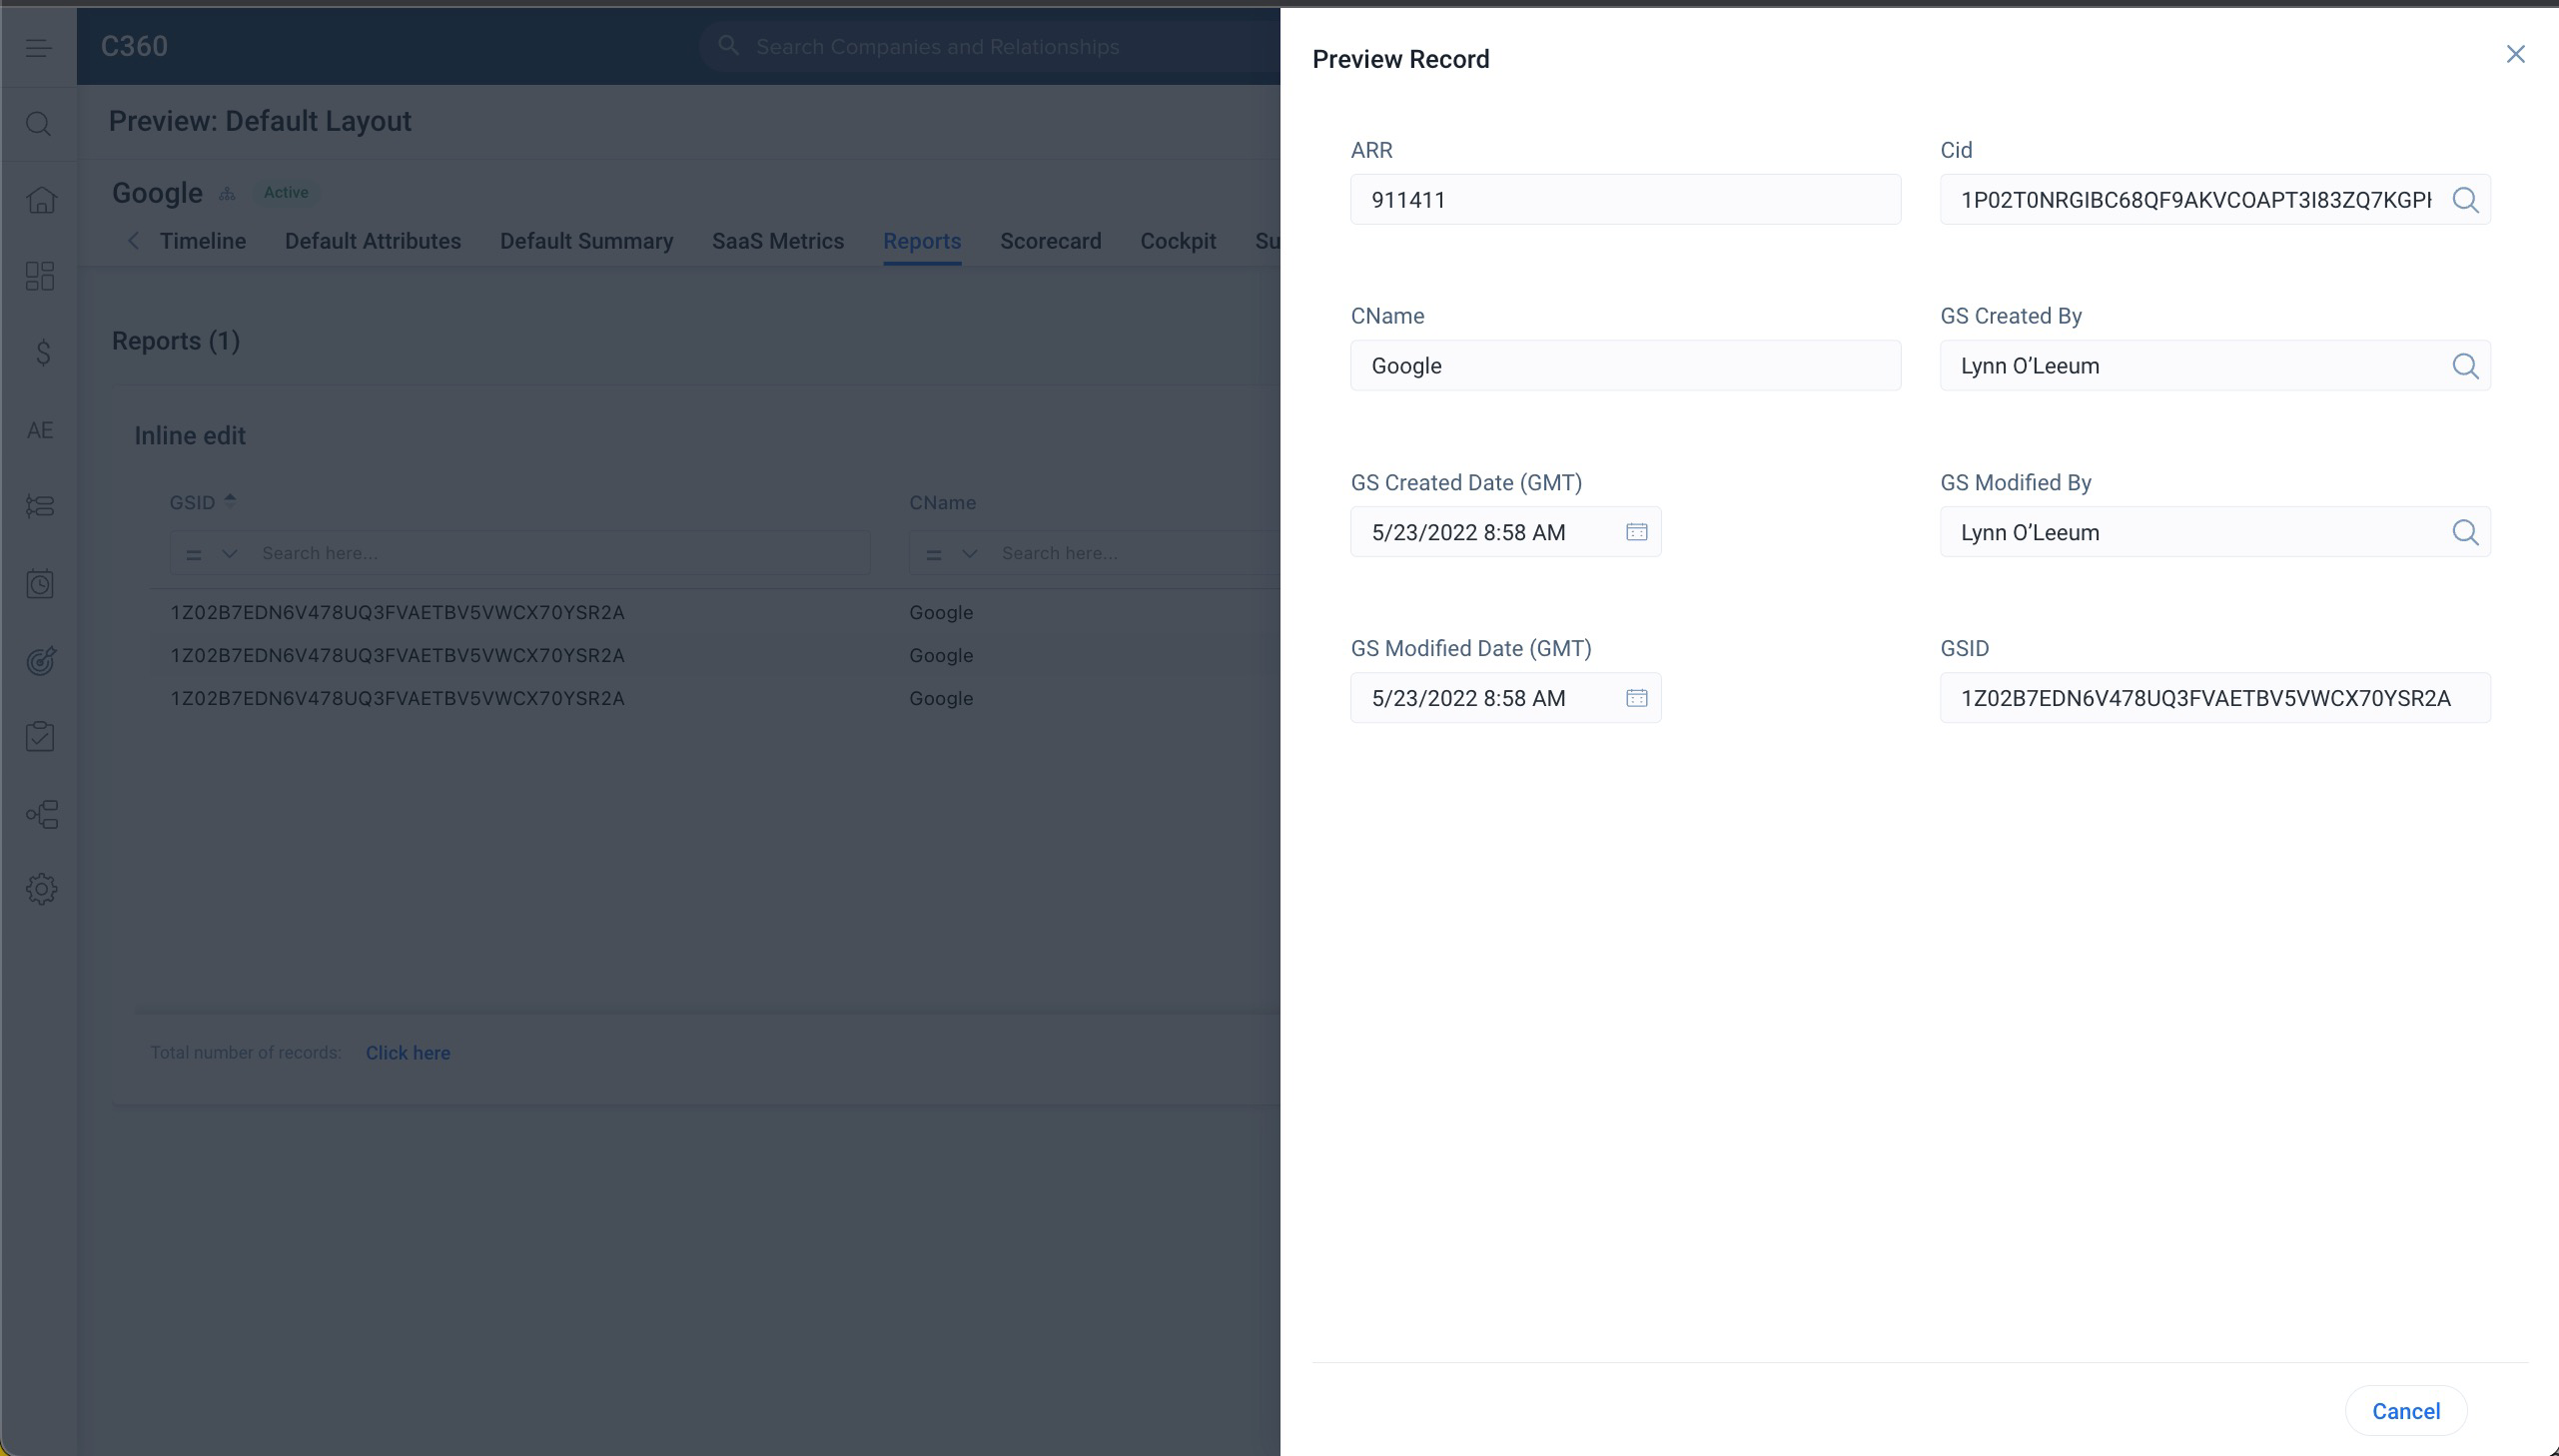
To preview an existing record:
- Navigate to the record you wish to edit and click the three dots. Select Preview.
- A preview of the record is displayed.
In R360, admins can associate any object with the Relationship object to use its data to create Reports. For more information on how to associate objects, refer to Configure Associated Objects to Relationship article.
Note:
State Preservation - R360 supports state preservation. It ensures that changes made to visualizations, filters, resizing, and rearranging in column reports are synchronized between the Main R360 and 360 in Sidebar. Changes in one are reflected in the other, maintaining all user-applied settings and customizations across sessions and sections.
Scorecard Section
The Scorecard Section in Revamp C/R360 is similar to the current C/R360. Users can configure various components of the Scorecard Section. For more information on the components, refer to the View and Update Scorecards in 360 article.
Scorecard Widgets
Two Scorecard Widgets are available to the users in the Summary Section:
- Health Score with History: This widget shows the overall health score of the customer along with the overall scorecard history of the last 18 weeks. The overall scorecard history is available from new and older scorecards.
- Health Score: This widget shows only the overall health score of the customer.
Notes:- Clicking on a Scorecard Widget will direct users to the Scorecard Section.
- Reload icon is available on the top right corner of the widget to refresh the overall score.
- Gainsight Admins must configure the widgets to make them available in the Summary Section.
Sponsor Tracking
Sponsor Tracking works on the principle that prevention is better than cure, and thus provides timely notifications to CSMs, every time there is a change in the status of the contact being tracked. Sponsor tracking monitors popular Social media sites including Linkedin, Facebook and Google+ and then notifies the CSM about the changes in the contact's profile, the changes include Sponsor’s role /title/designation, location, sponsor’s company, etc.
For more information about Sponsor Tracking, refer to the Sponsor Tracking Overview article.
Success Plan Section
Success Plans help CSMs capture, track activity, and share progress of your customers’ key goals using Objective CTAs and their associated tasks. CSMs can view the detailed Success Plan view without leaving the C360 or global Success Plan page. The detailed view displaying plan info, objectives, Gantt chart etc. will open inline, ensuring easy access to other sections on the page . Users can maximize the View Details in fullscreen mode or minimize the view to navigate to other sections on the current page.
With Success Plans, your team can:
- Capture your customer’s strategic goals and easily share progress updates with them.
- Automatically trigger Success Plans at important milestones in a lifecycle to ensure proper hand-off from one stage to another.
- Create individualized Success Plans to track progress of granular customer relationships for various products, departments, or locations.
- Monitor goal attainment and visualize your project progress with intuitive Gantt Charts.
For more information on creating a Success Plan from C360 page, refer to the Create Success Plan article.
Active Success Plans widget
This widget displays the total number of Success Plans. Each Plan Type and the number of Open Objective for the Plan Type are represented by a bar. This widget is added automatically to the C360 Summary section when the Success Plan section is added to the C360 Summary section layout.
Summary Section
Gainsight offers 18 Standard Widgets, 69 Field Widgets, and 18 Report Widgets out of which 10-12 can be added in the Summary section. For more information on the widgets, refer to the Widgets Types in Summary Section in the Configure Summary Section article.
Survey Section
The survey section includes three tabs that display the collected survey data.
- NPS® RESPONSES tab displays aggregated customer ratings using the NPS® methodology.
Note: Depending on the configuration of this section within the C360 layout, this score is displayed as an average of all responses to the survey, or the 'actual' score that has not been calculated as an average. - CSAT RESPONSES tab displays the number of responses received for the CSAT question along with the CSAT scores and the percentage of positive responses.
Note: If the CSAT questions contain a Matrix question, users can select the required subquestion to view the specific responses and percentage of positive responses. - SURVEY RESPONSES tab displays User-specific links to the actual survey responses. Click the View icon to see the survey response of a participant in a new tab.
For more information about Surveys, refer to the NPS® Analytics article.
Timeline Section
The Timeline tab in C360 functions as a one-stop source for key customer activities such as Updates, Calls, Meetings, Emails, Milestones, and note-taking during or after a customer interaction. Timeline preserves a chronological history of your most significant interactions, helps teammates and management get up to speed quickly on the customer’s history, enables smooth management transitions, and reduces the need for leadership to ask for one-off updates from account managers and CSMs.
The Timeline tab in C360 is similar to the global Timeline page. It lets you create, edit and view Timeline Activities. Users can click the filter icon to add filters to streamline the Activities displayed on the screen or filter out the Activities by selecting the preferred Activity Type and the Activity Date. They can also view the Activities that are still in the draft state by navigating to Drafts. For more information on creating Activities from the C360 Timeline tab, refer to the Log Activities to Timeline - Gainsight Inc. article.
Customer Journey Widget
The Customer Journey Widget resides in the Summary section of the C360/R360 page. This widget captures important events in the company’s journey through Key Dates and Milestones. Key Dates are displayed as triangular flags whereas Milestones are displayed as rectangular flags on the widget. You can click the expand icon on the Milestones flag (rectangular) to view a list of all milestone events that occurred in that particular month.
Note:
- The Customer Journey needs to be configured by the admin for it to be visible on the Summary page.
- The milestones created on Relationship are displayed in the Customer Journey widget on the R360 page only unless the rollup settings are enabled by the admin.
- If a milestone and a key date occur within the same month, milestone is plotted first and then the key date flag.
- The Customer Journey widget supports up to 30 key dates, configurable by the admin.
You can also select which milestones and key dates to display on the Customer Journey widget as follows:
- Click the settings icon on the widget.
- From the Automatic Milestones section:
- Navigate to the Company tab to select automatic milestones created on the Company context.
- Navigate to the Relationship tab to select automatic milestones created on the relationship context.
- From the Manual Milestones section:
- Navigate to the Company tab to select manual milestones created on the Company context.
- Navigate to the Relationship tab to select manual milestones created on the relationship context.
- In the Key Dates section, you can view the Key Dates that are displayed on the widget. You can remove Key Dates from the widget by clearing the respective Key Dates checkbox.
Note:
- The Customer Journey widget captures Key Dates for the current month and the preceding two years. For instance, if today is October 6, 2023, Key Dates are displayed from October 6, 2021 to October 6, 2023. Key Dates prior to two years are not displayed.
- The Customer Journey widget logs Milestones for events within the current month, three months following the current month and the preceding two years. For instance, if today is October 6, 2023, the widget captures events from October 6, 2021 to January 6, 2024. Click the left navigation pane to view previously logged events
The bottom bar of the Customer journey widget reflects changes in the stages of the company, as recorded in the Company field in the Data Management page. The color of the stage on the bottom bar corresponds to the color of the Company field as selected on the Data Management page.
Note: No color is displayed in the bottom bar if no stage change has occurred yet.
Last 5 Timeline Activities widget in C360 Summary
This widget displays a list of the latest five Timeline Activities in order of their creation date. Users can create on the Activity to view details of the selected Activity. They can also click the comment icon of the corresponding Activity to add or view comments.
Note: This widget will only be visible on the C360 Summary page if admins have added this widget to the C360 Summary layout.
Usage Section
The Usage section in C360 lets you view Dashboards built in Adoption Explorer.
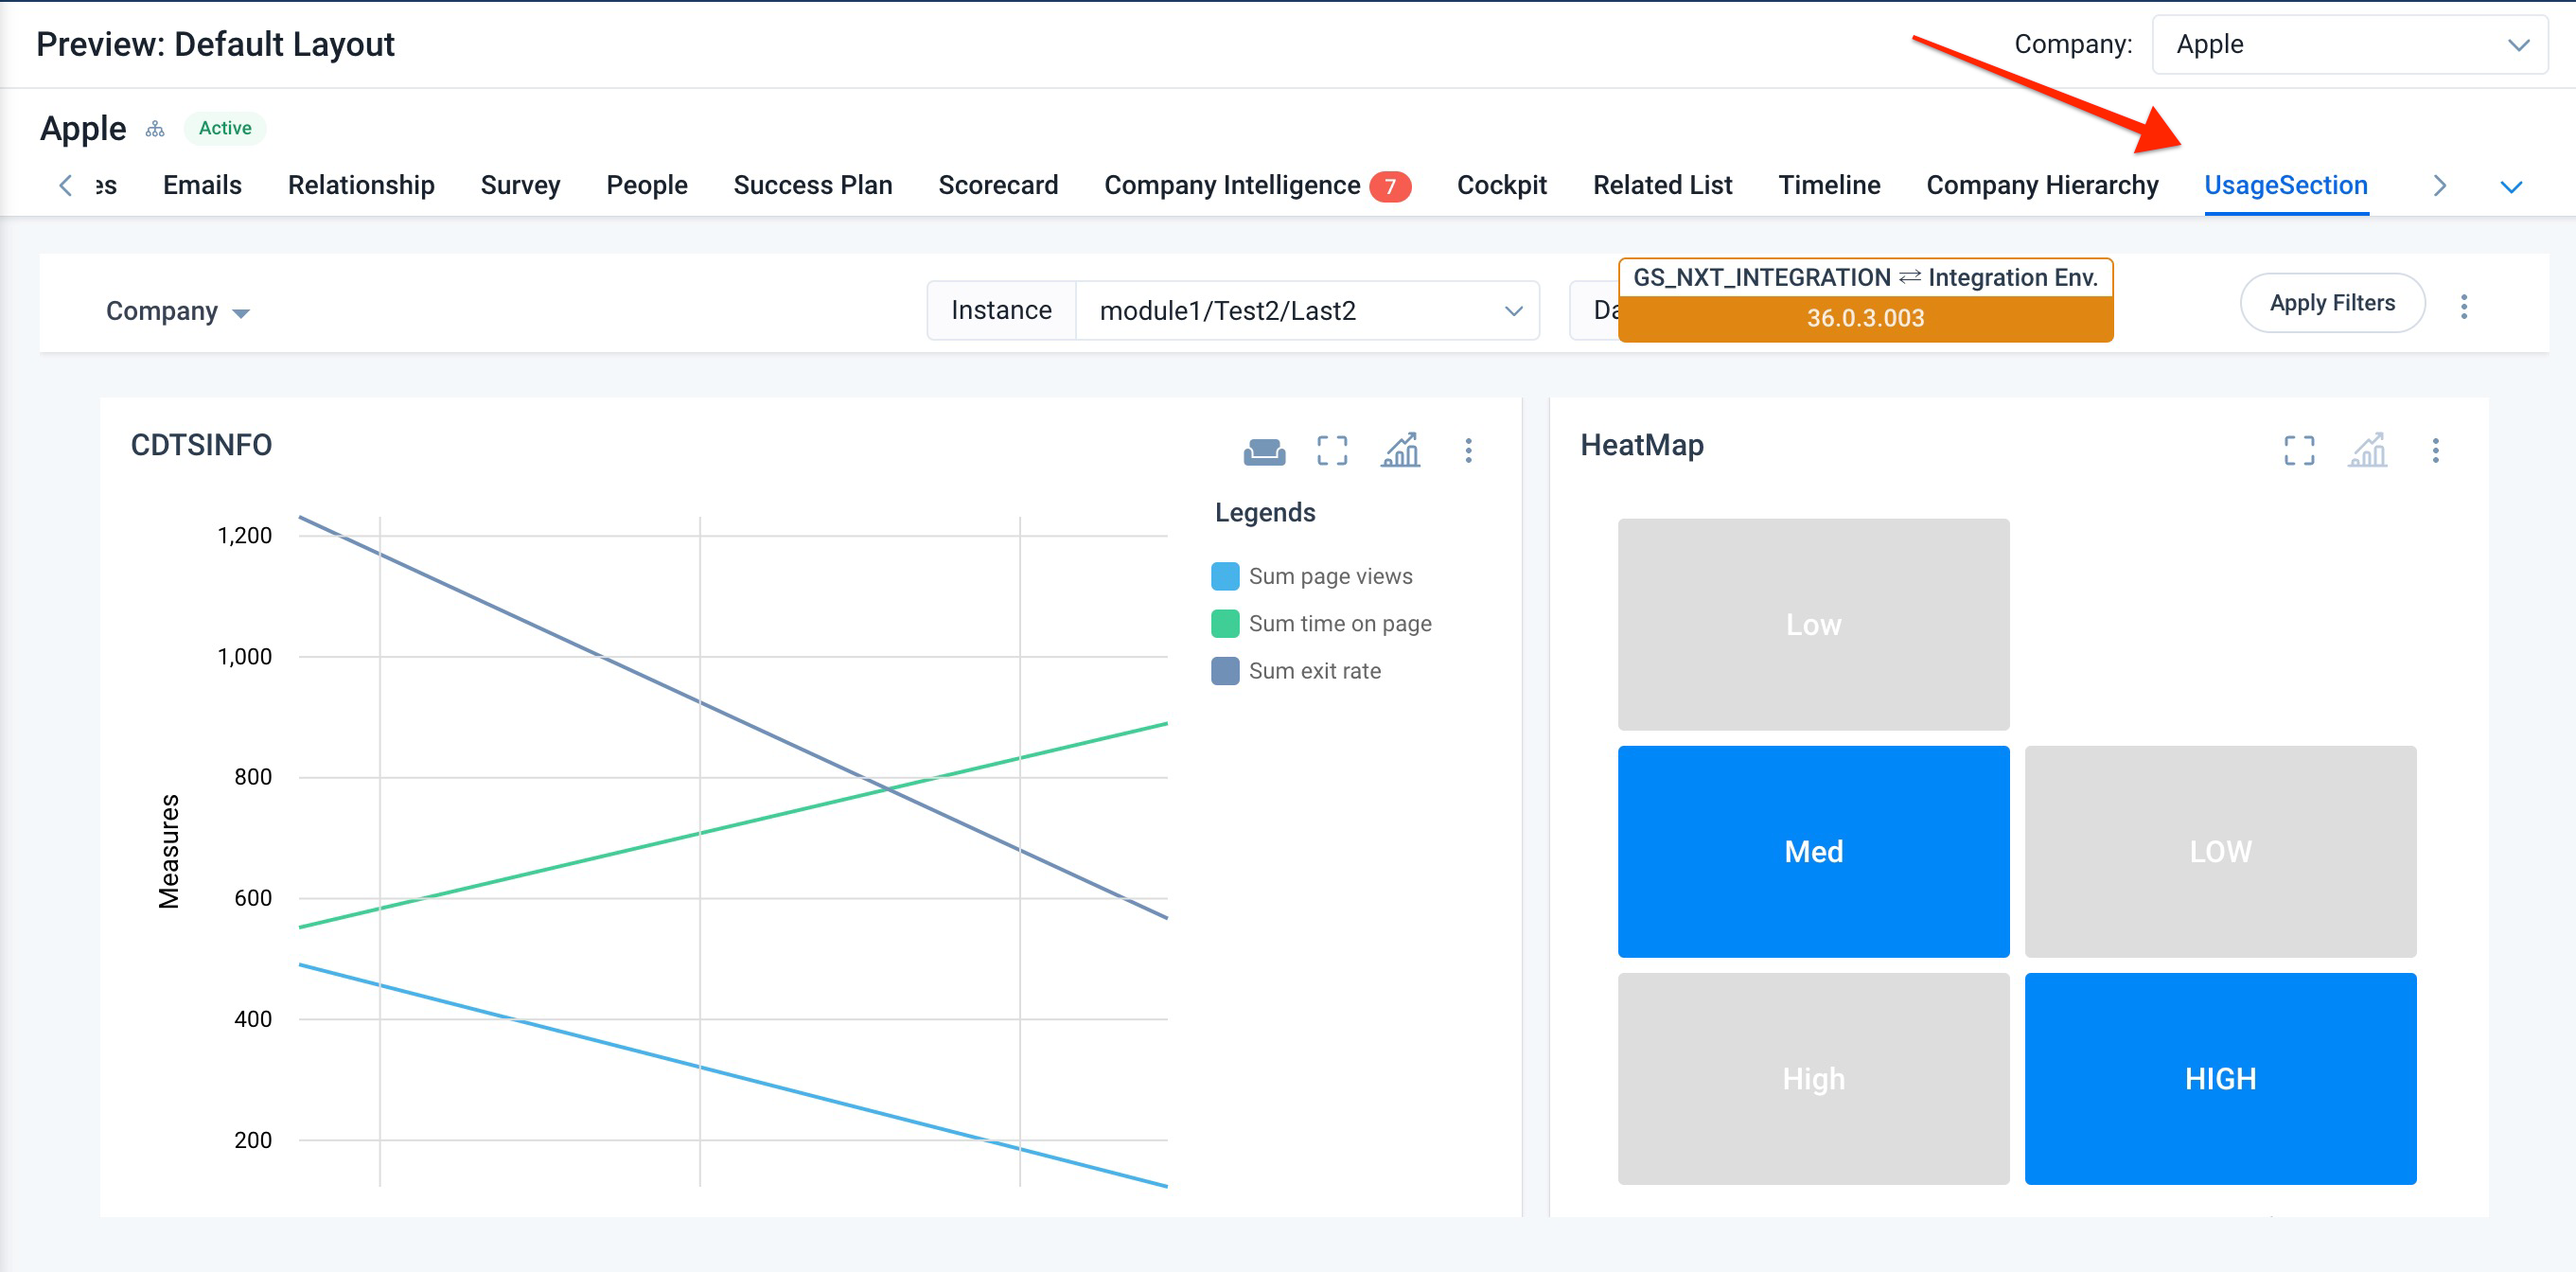
You can customize the reports and view your preferred company and company instance as follows:
- You can select the company for which you want to view the report by selecting it in the Company dropdown.
- You can select the Instance for the selected company for which you want to view data.
- Click the Apply Filters button to load the reports as per your Company and Instance preferences.
- (Optional) You can click the three dots to perform the following operations:
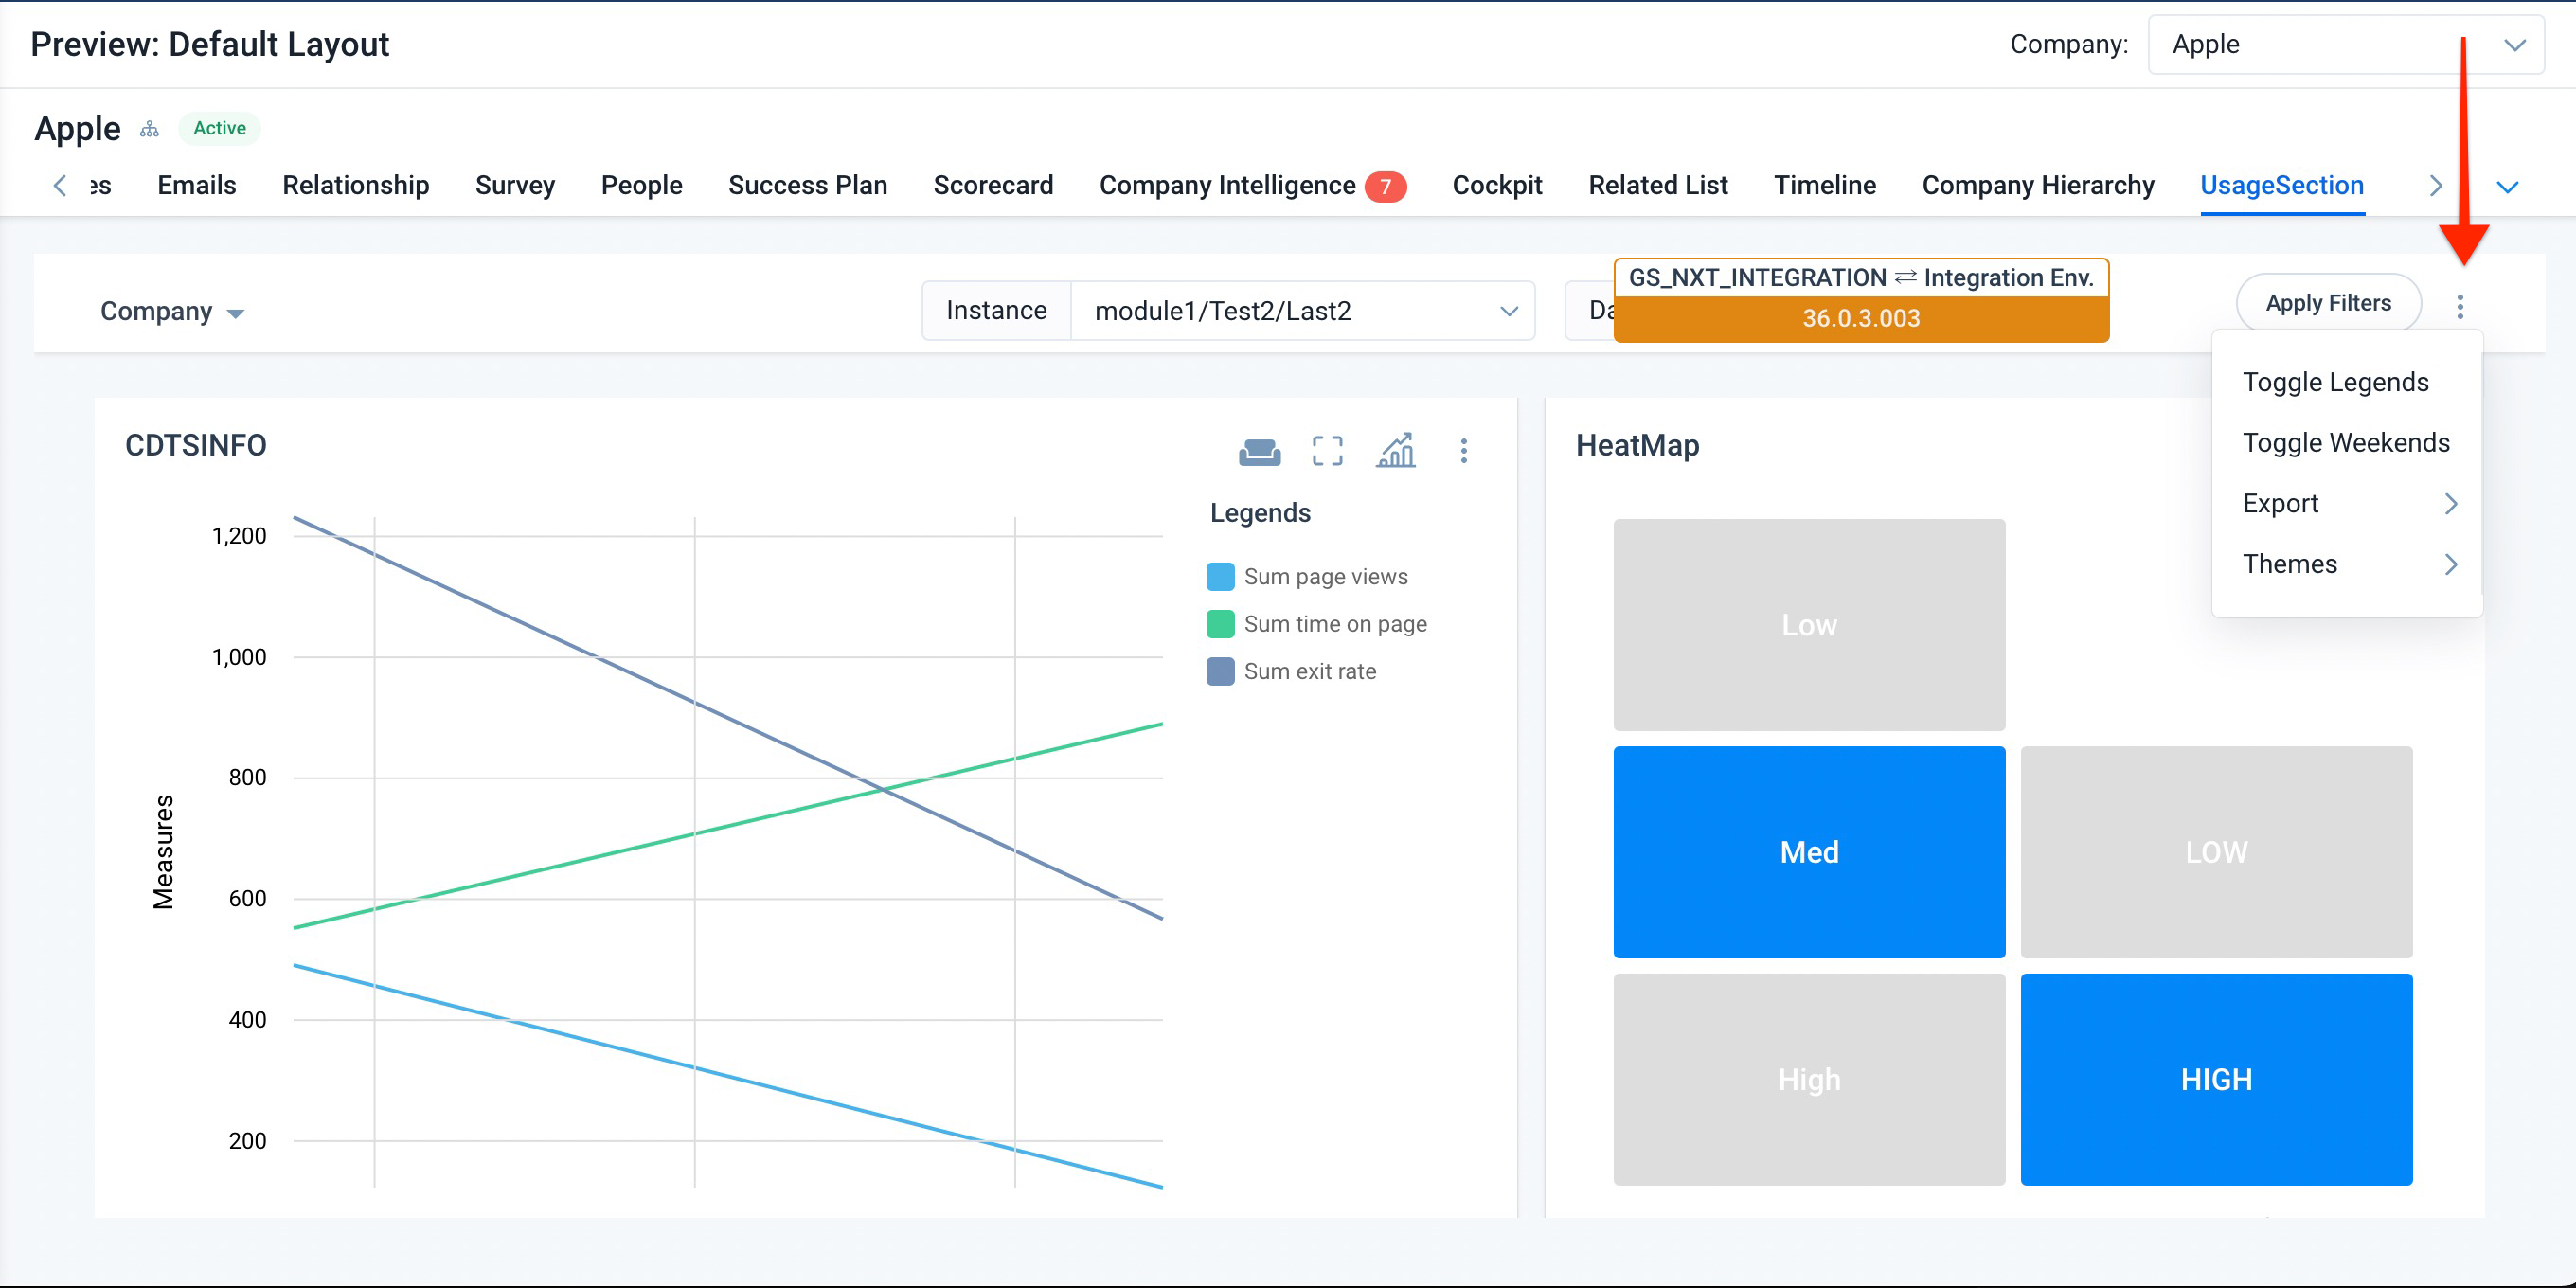
- Toggle Legends: This option lets you view map key legends (chart axis details).
- Toggle Weekends: You can select this option to show weekend data in the reports.
- Export: You can use this option to export the dashboard in a “pfd” or “csv” format. You can also download it as an image.
- Themes: It lets you select a theme for the dashboard.
- (Optional) You can also maximize the reports on the dashboards, change their visualization type, export them individually, drill down and perform other functions as follows:
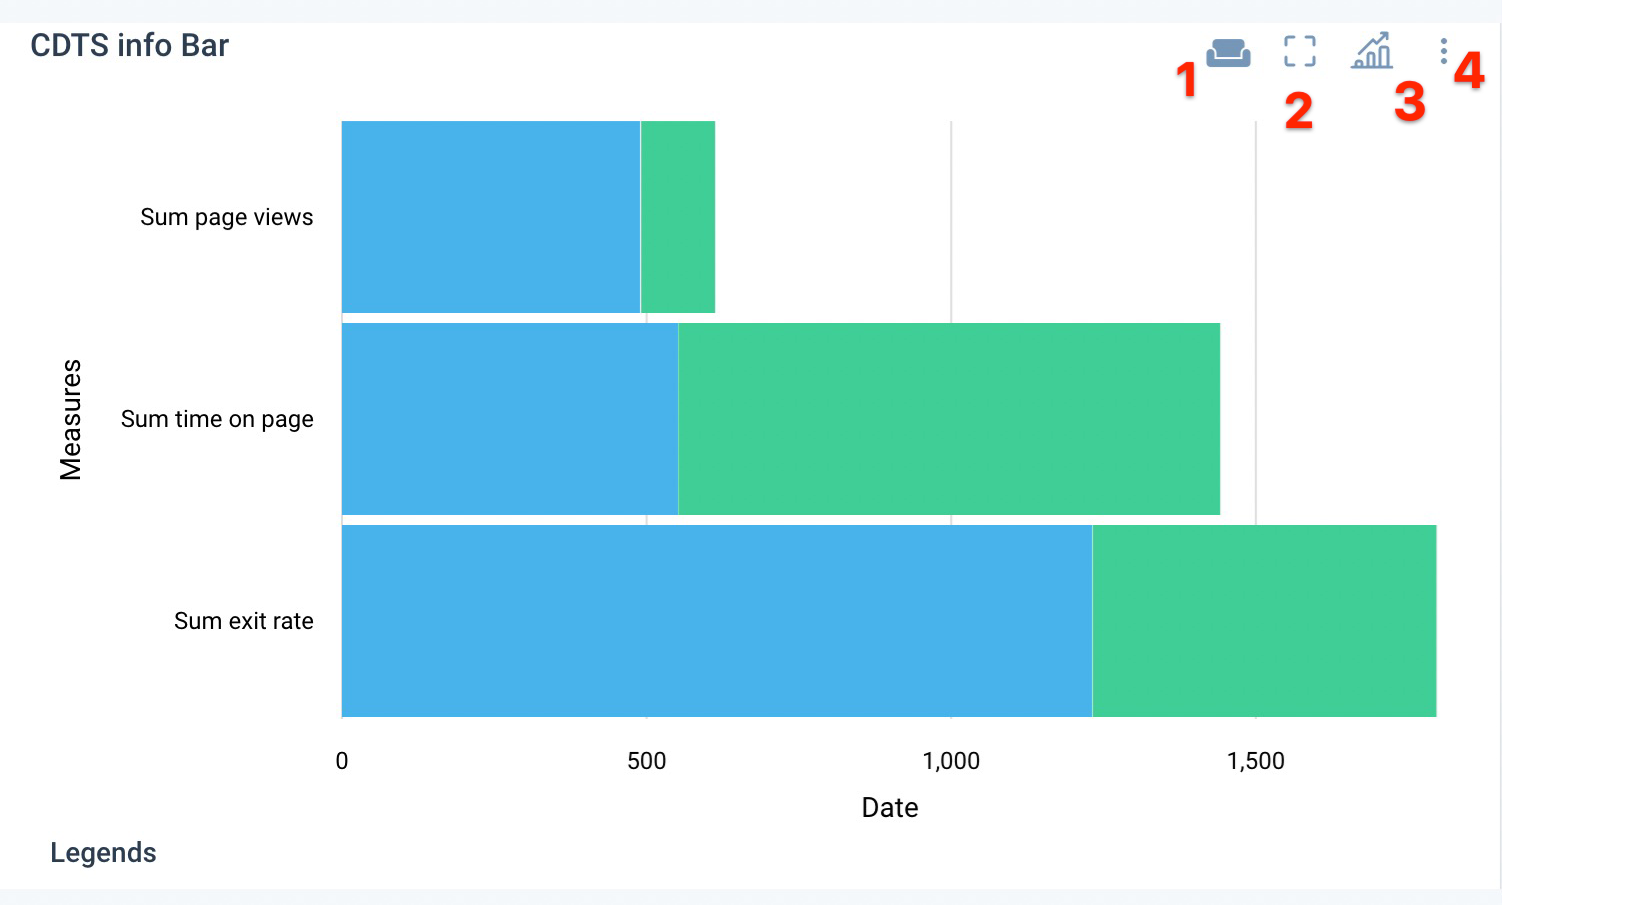
- The couch icon denotes that this report contains weekend data.
- This option can be used to maximize the report and view it in full-screen mode.
- You can use this option to change the visualization type of the report. You can click the icon and then select your preferred visualization-type.
- The more options button lets you perform the following actions:
- Toggle Legends: This option lets you view map key legends (chart axis details).
- Toggle Weekends: You can select this option to show weekend data in the reports.
- Export: You can use this option to export the dashboard in a “pdf” or “csv” format. You can also download it as an image .
- Custom Drill down: This option is used to configure a custom drill down to show custom fields/columns when the user clicks on a data point in the chart. If no fields/columns are configured in custom drill down, the user will see the default drill down information on clicking on a data point in the chart.
- Selective Measures: This option allows you to display only your selected measures/keys from the list of existing measures.
For more information on usage reports, refer to the Create Usage Report in a Dashboard - Gainsight Inc .
Additional Resources
For more information on C360/R360, refer to the following articles:
C360 articles:
- 360 Overview
- Configure 360 Layouts
- Configure Associated Objects to Relationship
- Configure Attribute Section in 360
- Configure Embed Section in 360
- Configure Reports Section
- Configure Usage Section in C360/R360
- Configure Company Hierarchy Section in 360
- Configure People Section in C/R360
- Configure Relationship Section and Views in 360
- Configure Summary Section in C360/R360
- View Company Hierarchy
- Export Success Snapshot Presentations
- Sponsor Tracking Overview
- 360 FAQs
R360 articles: