Analytics Reports Overview
This article provides insights into the New and Beta reports, helping admins track learner activity, monitor course performance, and analyze engagement trends.
Overview
CE offers a comprehensive set of analytics dashboards in New, Beta, and Legacy versions. These reports are grouped into the following categories:
- Academy Overview: Summarizes academy-wide activity to measure engagement and program success.
- Learner Activity: Tracks learner engagement, course progress, and training participation.
- Content Performance: Evaluates training content effectiveness based on engagement and completion trends.
- Assessment: Measure learner retention and comprehension through quizzes, assignments, and certifications.
Analytics Refresh Schedule
- AWS and Azure analytics refresh daily at 02:00, 08:00, 14:00, and 20:00 UTC. The process takes approximately two hours, after which updated reports become available.
- The report date reflects the rebuild date, not the data sync date. For example, if the last refresh timestamp is 09:45 UTC, the data was processed in the 08:00 UTC cycle.
Access Analytics Reports
Access Analytics Reports to track learner activity, monitor course performance, and evaluate training effectiveness through categorized insights. To access analytics report:
- In Gainsight CE, navigate to Analytics. Select the relevant report based on the insights you need.
- Click the View Report button to open a specific report.

Academy Overview
Reports provide high-level insights into academy-wide activity and learner engagement.
| Report Name | Description | Documentation Link |
|---|---|---|
| School Activity | Shows how many learners are active over time. | School Activity Analytics |
| People Leaderboard | Shows learner progress across multiple courses. | People Leaderboard |
| Course Progress Stats | Shows learner enrollment and progress in courses. | Course Progress Stats |
| Learning Path Progress Stats | Shows learner progress in assigned learning paths. | Learning Path Progress Stats |
| Search Query Analysis | Analyzes popular queries, no-result searches, and clicked results to improve content discoverability. | Search Query Analysis Report |

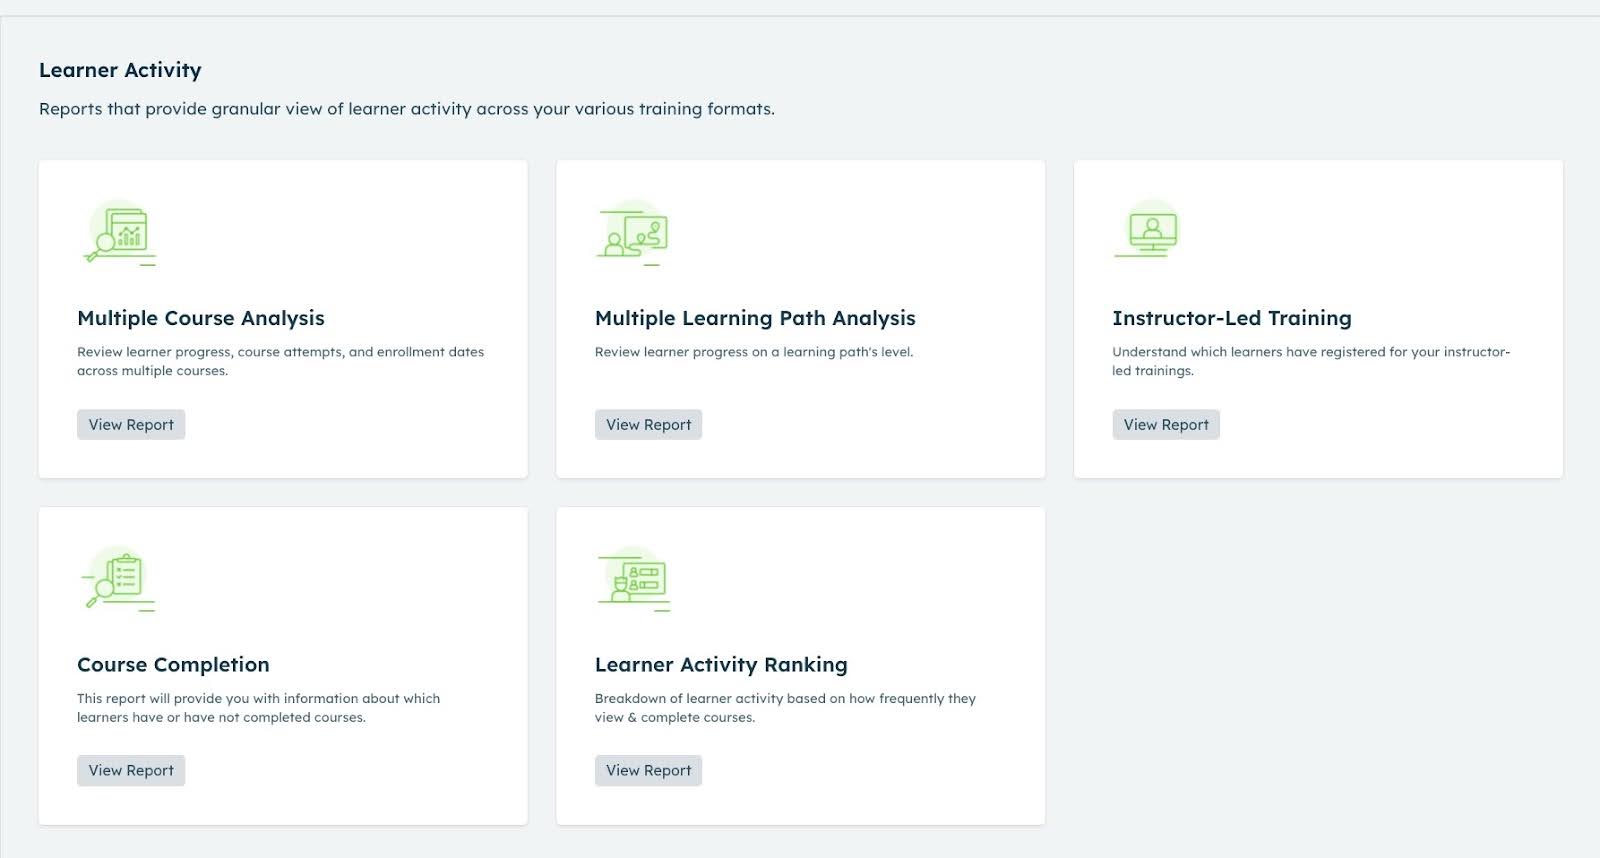
Learner Activity
Reports provide a detailed view of learner engagement, course progress, and participation across different training formats.
| Report Name | Description | Documentation Link |
|---|---|---|
| Multiple Course Analysis | Reviews learner progress, course attempts, and enrollment dates across multiple courses. | Multiple Course Analysis |
| Multiple Learning Path Analysis | Review learner progress at the learning path level. | Multiple Learning Path Analysis |
| Instructor-Led Training | Identifies learners registered for instructor-led training sessions. | Instructor-Led Training |
| Course Completion | Shows which learners have or have not completed courses. | Course Completion |
| Learner Activity Ranking | Shows learner activity based on course views and completions. | Learner Activity Ranking |
Content Performance
Dashboards provide insights to evaluate the effectiveness of training content.
| Report Name | Description | Documentation Link |
|---|---|---|
| Single Course Analysis | Shows learner progress across a single course. | Single Course Analysis |
| Single Quiz Analysis | Shows learner performance on a single quiz. | Single Quiz Analysis |
| Course Popularity | Shows course popularity based on completion rates. | Course Popularity |
| Video Engagement Insights | Shows video views, completions, and progress to analyze engagement. | Video Engagement Insights |

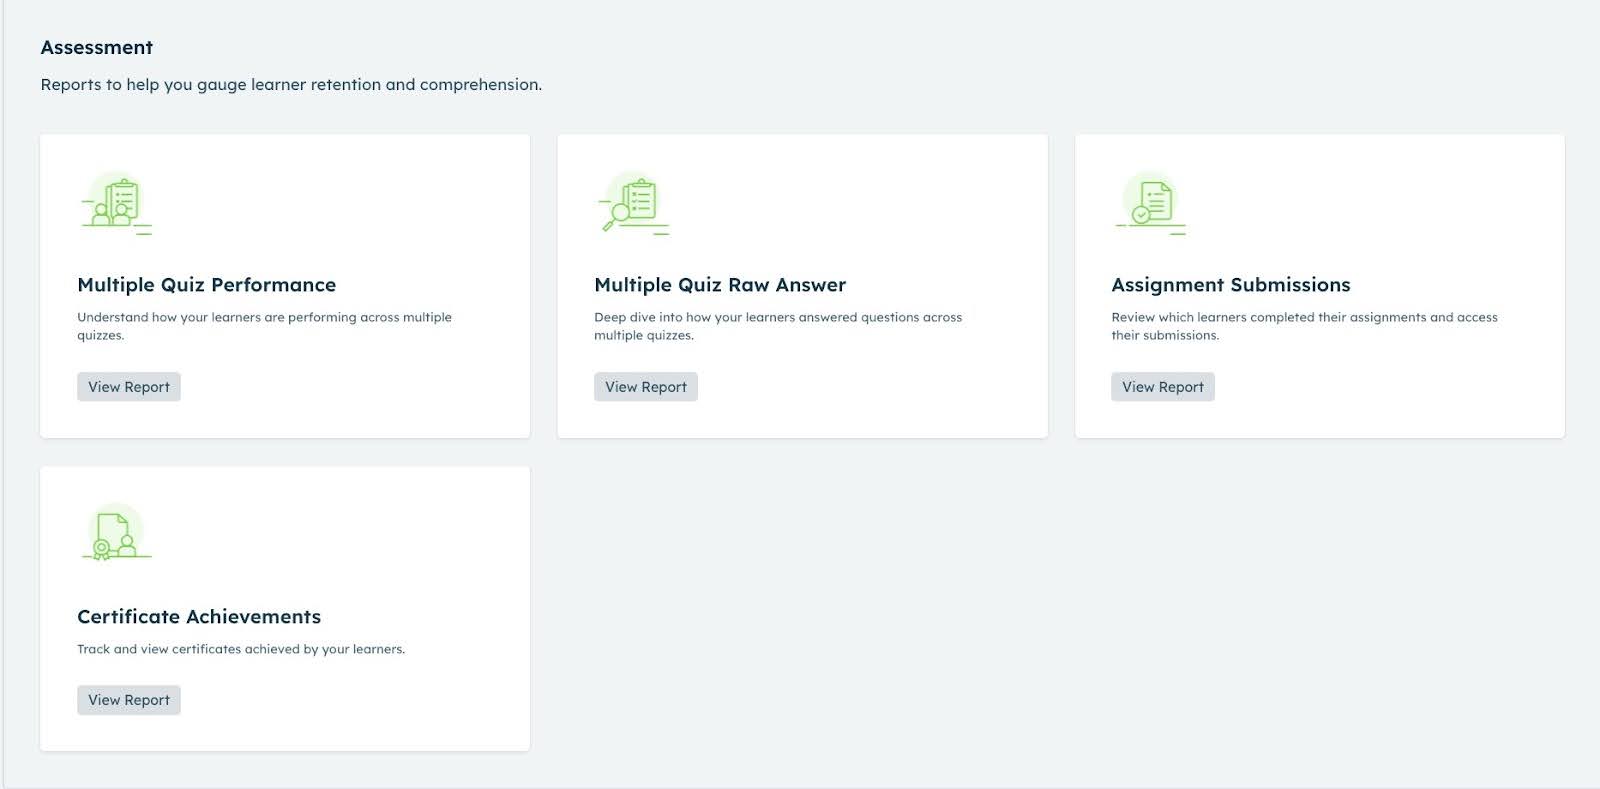
Assessment
Measures learner retention and comprehension through quizzes, assignments, and certifications.
| Report Name | Description | Documentation Link |
|---|---|---|
| Multiple Quiz Performance | Tracks learner performance across multiple quizzes. | Multiple Quiz Performance Dashboard |
| Multiple Quiz Raw Answer | Shows how learners answered questions across multiple quizzes. | Multiple Quiz Raw Answer Dashboard |
| Assignment Submissions | Reviews which learners completed assignments and provides access to submissions. | Assignment Submissions |
| Certificate Achievements |