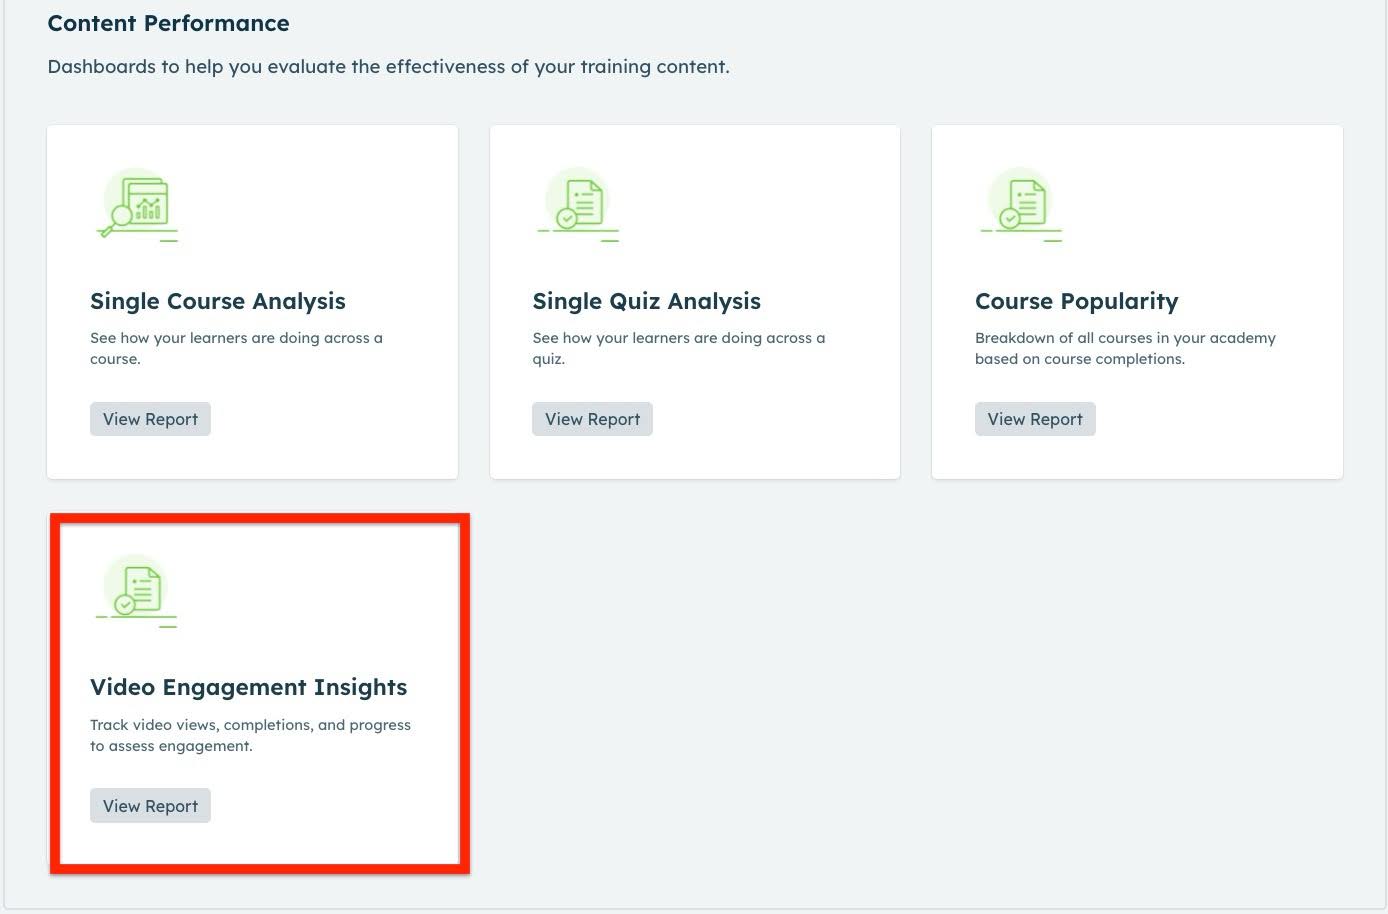
Video Engagement Insights
This article helps admins to understand how to track learner engagement with videos in your Gainsight CE academy and how to take informed decisions based on insights.
Overview
The Video Engagement Insights report provides visibility into how learners interact with videos across your entire academy. Whether videos are reused in multiple courses or presented in a single journey, this report helps you analyze performance.
Key Benefits
- Understand which videos drive engagement and where learners drop off.
- Identify opportunities to improve course content.
- Reuse high-performing videos strategically.
- Navigate quickly to linked media, courses, and activities.
By leveraging this report, you can:
- Track learner start and completion rates.
- View average progress per video.
- Access content directly from the report for quick iteration.
- Filter results by course, video name, or group name.
Access the Report
To access the Video Engagement Insights report:
- Navigate to Analytics > Content Performance > Video Engagement Insights.
-
Click View Report. A table appears with filtering options at the top.

Understand the Report Fields
Each row in the Video Engagement Insights report represents one video within the context of a specific course and learning activity.
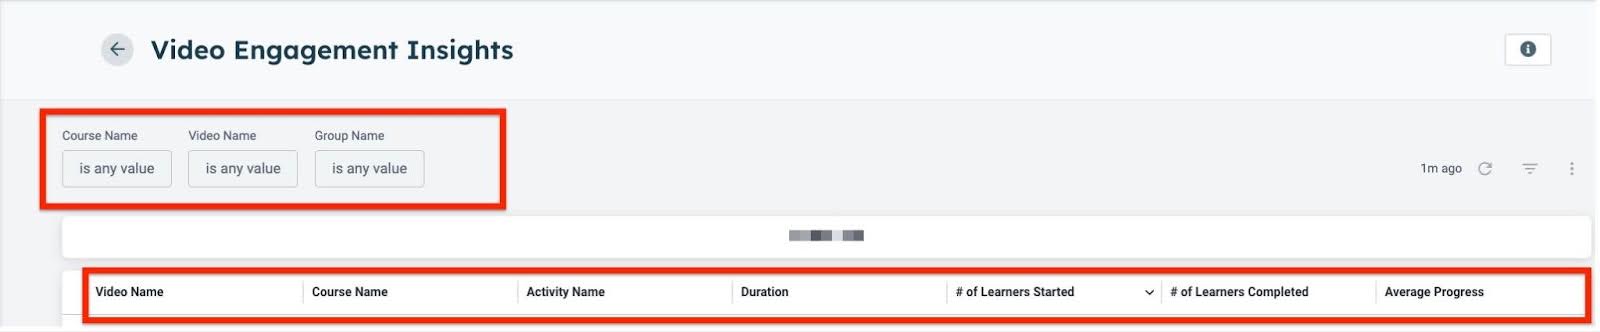
Apply Report Filters
Use filters at the top to narrow your results by:
- Course Name
- Video Name
- Group Name
Note: Once a filter is applied, the table updates to display only videos relevant to your selection. Progress and completion data are displayed in the context of the selected course.

Understand Report Columns
Each column provides specific data about video engagement.
| Column | Description |
|---|---|
| Video Name | Title of the video |
| Course Name | Course where the video appears |
| Activity Name | Specific learning activity |
| Duration | Total length of the video |
| # of Learners Started | Count of learners who started the video |
| # of Learners Completed | Count of learners who completed the video |
| Average Progress | Average watch percentage across learners |
Note: If a video is reused across multiple courses, the report displays performance data for each course context separately.
Action from the Report
You can click the following fields directly in the report to access and manage related content:
| Field | Linked Destination |
|---|---|
| Video Name | Opens the video in Media Library |
| Course Name | Opens the course in Course Builder |
| Activity Name | Opens the associated Activity Editor |

Note: This enables quick edits and updates without leaving the report view.
Access Individual Learner Progress
To access detailed progress for individual learners:
- Click on the numeric value in the # of Learners Started or # of Learners Completed columns for any video row.
- A detail panel opens with:
- Learner names
- Email addresses (if shown)
- Progress percentages
- You can choose to:
- Download the table as a report.
- Review the data inline to identify patterns.
Note: This drill-down view provides actionable insights to help you understand exactly who is engaging and to what extent for each video.
Best Practices
- Use the Media Library to manage and reuse high-performing videos.
- Analyze average progress to detect drop-off points.
- Use filters to compare performance by course.
- If videos underperform, consider shortening or updating content.