Reports and Dashboard Exports
Gainsight NXT
This article explains how to export a report in different formats, the export options, and the limitations on export options in Reporting.
Overview
Customer Success Managers (CSMs) can download a report as an Image and/or an Excel, and share it with any user, based on their business needs. CSMs can also share a dashboard as a link or as a PPT through email with internal user(s) from the Dashboards tab. For example, a CSM could share the Monthly Renewals dashboard with the CRO of the company, a CSM Manager can generate a report and see how many CTAs each of his CSMs are working on, etc.
Example Business Use Cases:
- A CSM want to share the share the Monthly Renewals dashboard with the CRO of the company.
- CSM Manager can generate a report and see how many CTAs each of his CSMs are working on.
Enable Download Image and Download Data
Admins can Enable/Disable the Download option to allow or restrict users from Downloading the Report. Navigate to the General Settings page and configure the following settings:
-
Disable downloading report data: enabling this toggle restricts the report data downloads from everywhere. For example, if you do not want a CSM to download a report, you can toggle ON this option.
-
Disable downloading report data in external link shares: enabling this toggle restricts the report data downloads from the externally shared links.
For more information on how to Enable/Disable the Download options, refer to the Report List View and Settings article in the Additional Resources section at the end of this article .
Download Image
To export a report as an Image:
-
Perform one of the following tasks:
-
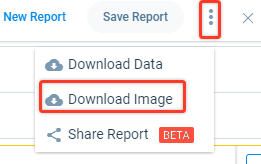
From the Report Builder page, click the Context menu and select Download Image. For more information on how to export a report from the Report Builder page, refer to the How to Build Basic Reports article in the Additional Resources section at the end of this article.
-
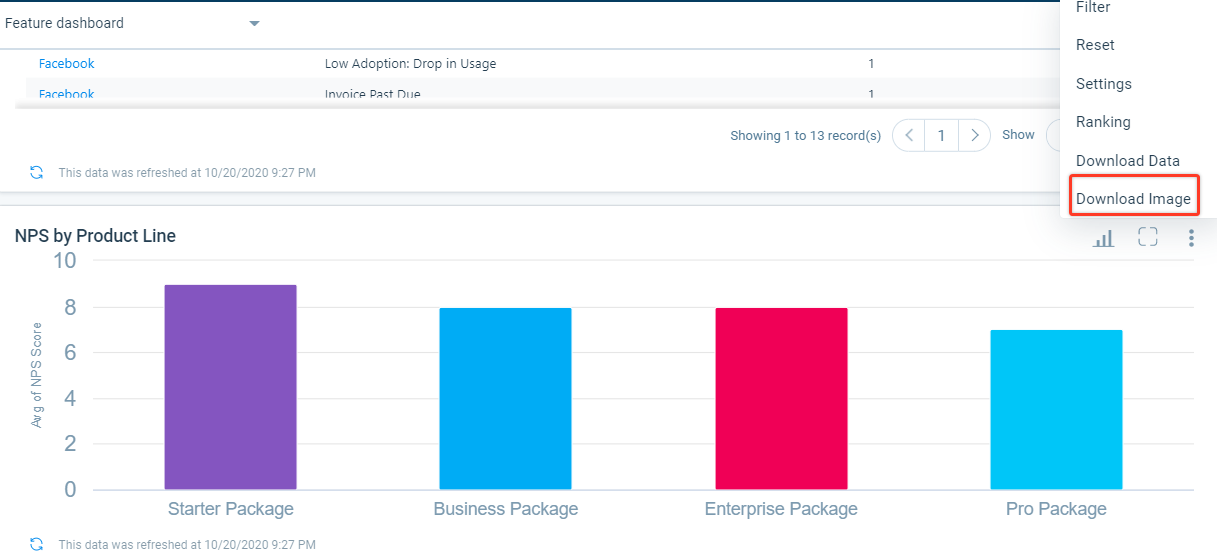
- From the Dashboards page, click the context menu of the corresponding report and select Download Image. For more information on how to export a report from Dashboard Builder page, refer to the Dashboards Overview article in the Additional Resources section at the end of this article.
Notes:
-
Download Image option is available only for graphical visualization reports.
-
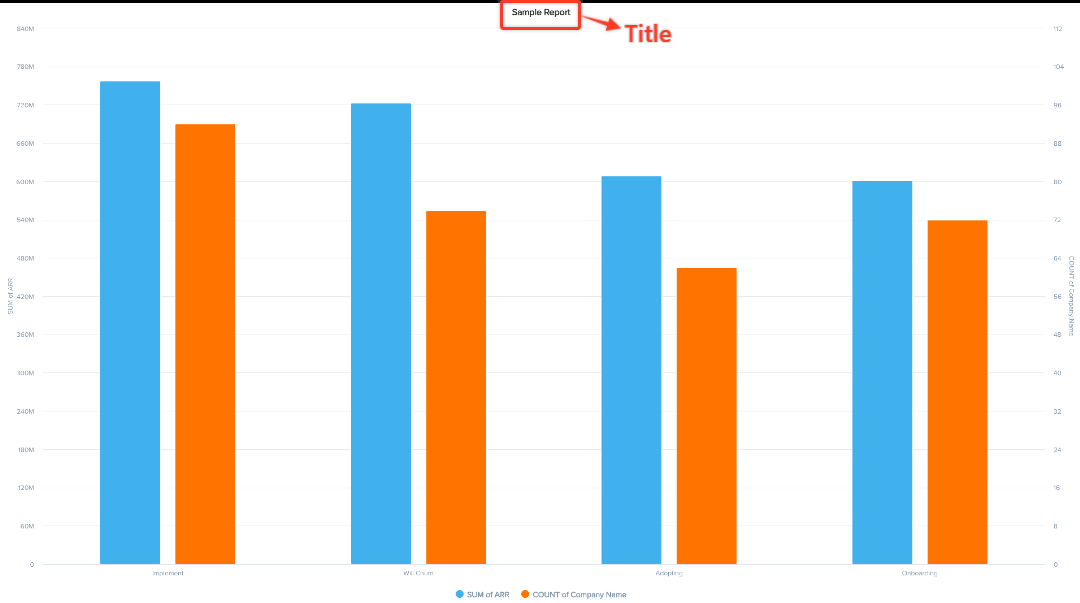
When you download a report as an image, the title of the report is embedded in the exported image. The title is placed at the top, is boldfaced, and center-aligned as shown below.
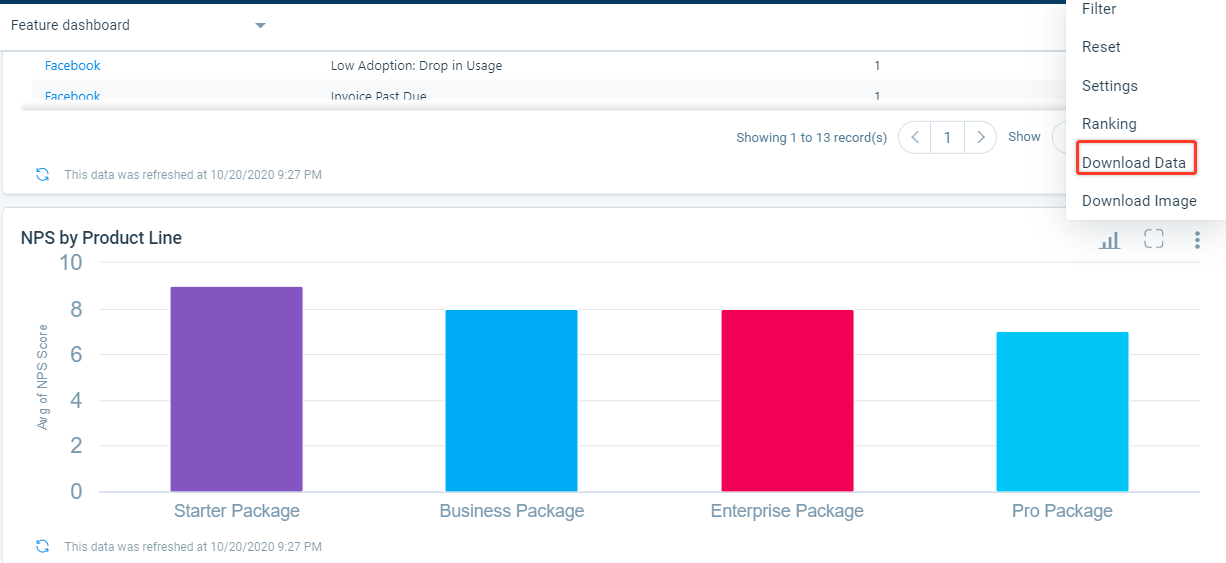
Download Report Data
To download the report as an excel file:
-
Perform one of the following tasks:
-
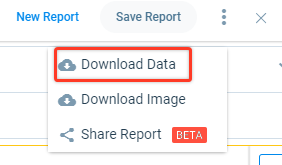
From the Report Builder page, click the Context menu and select Download Data. For more information on how to export a report from the Report Builder page, refer to the How to Build Basic Reports article in the Additional Resources section at the end of this article.
-
- From the Dashboards page, click the Context menu of the corresponding report and select Download Data. For more information on how to export a report from Dashboard Builder page, refer to the Dashboards Overview article in the Additional Resources section at the end of this article.
Notes:
-
Download Data option is available for both tabular and graphical visualization reports.
-
You can export a report to excel to a maximum of 100k records. Gainsight recommends to use Export to S3 from Bionic Rules, if the records in your report exceed 100K records.
-
HTML tags (div, p, br, and so on) are supported in new line formatting when you export a report to Excel.
-
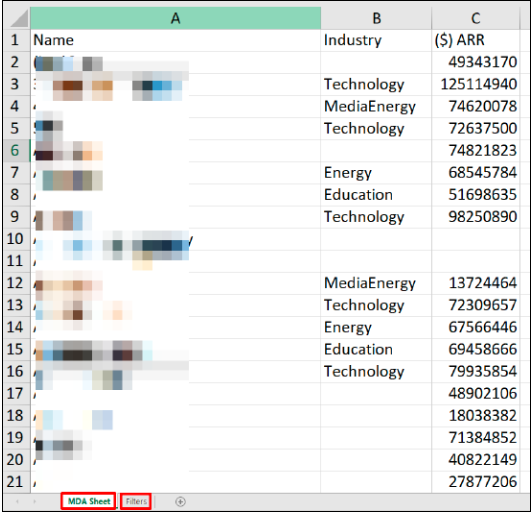
While exporting a report to an Excel file, the filters applied to the reports are also exported.
-
The export of filters is supported only for Report Builder and Dashboards.
-
Filters are not exported when you export a report from the Report drill-down.
Email/Export Dashboard to Gainsight Users
Share a dashboard as a link or PPT via email with a user from the Dashboards page. The dashboards must be configured for sharing by the admin. The configured dashboard can then be shared through email as a link or PPT, with optional security settings. To share the dashboard, the recipient must be added as a Gainsight user into the Gainsight User object.
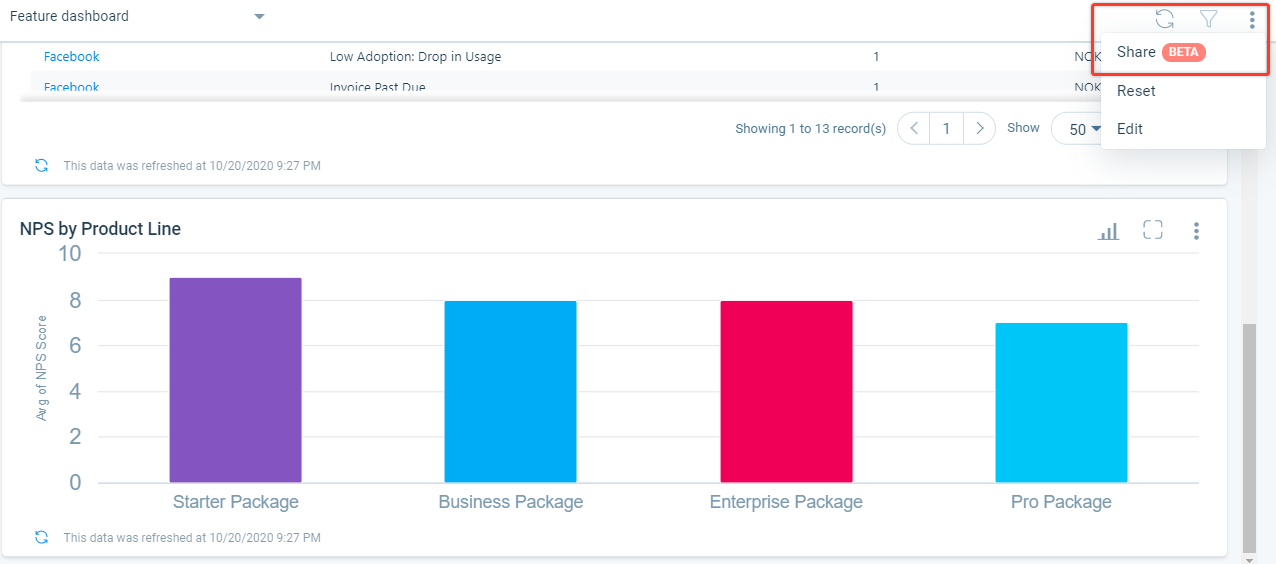
To share Dashboards:
-
Navigate to the Dashboards (BETA) page, and select the required dashboard from the dropdown list.
-
From the Context menu, click Share. The Share Dashboard page appears.
Here, you can configure the Dashboard for sharing through an email as link or PPT. Dashboards which are shared as a link can be configured with optional security. These include:
-
Enable OTP Verification: Select the Enable OTP Verification checkbox, to enable OTP verification. The OTP can be generated a maximum of five times per link, and the recipient can re-try it three times.
-
Disable Download: Select the Disable Download checkbox, to restrict the data download from the reports or charts shared with users.
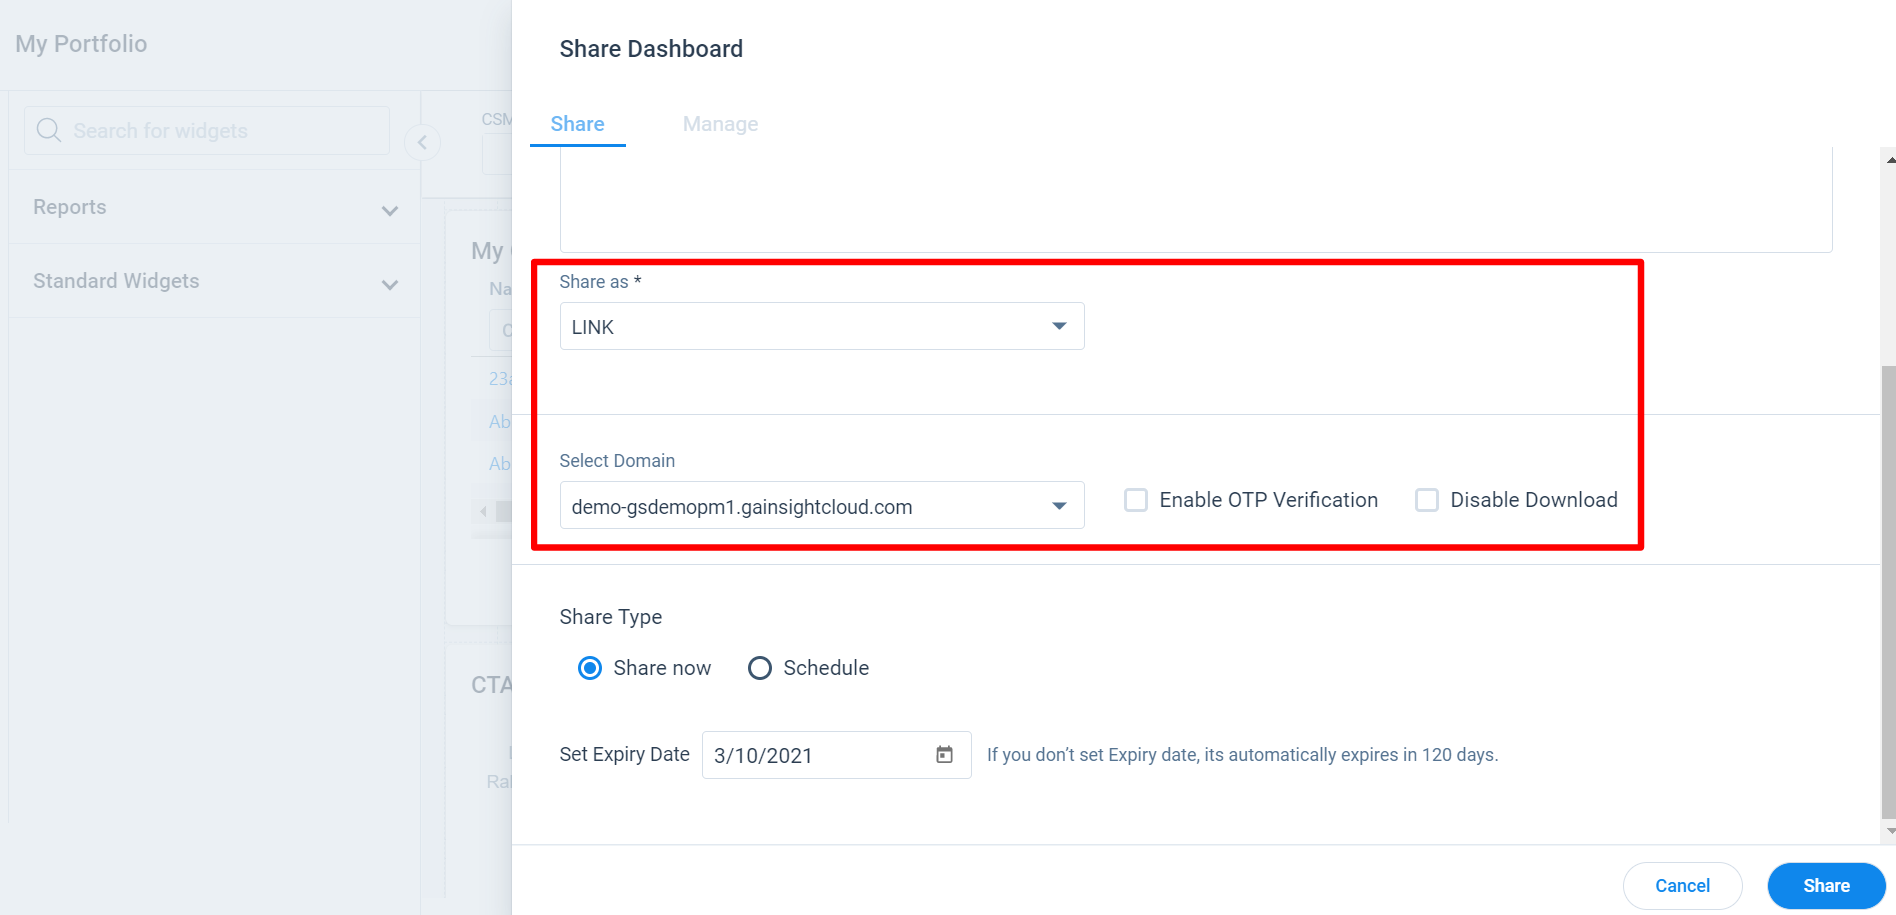
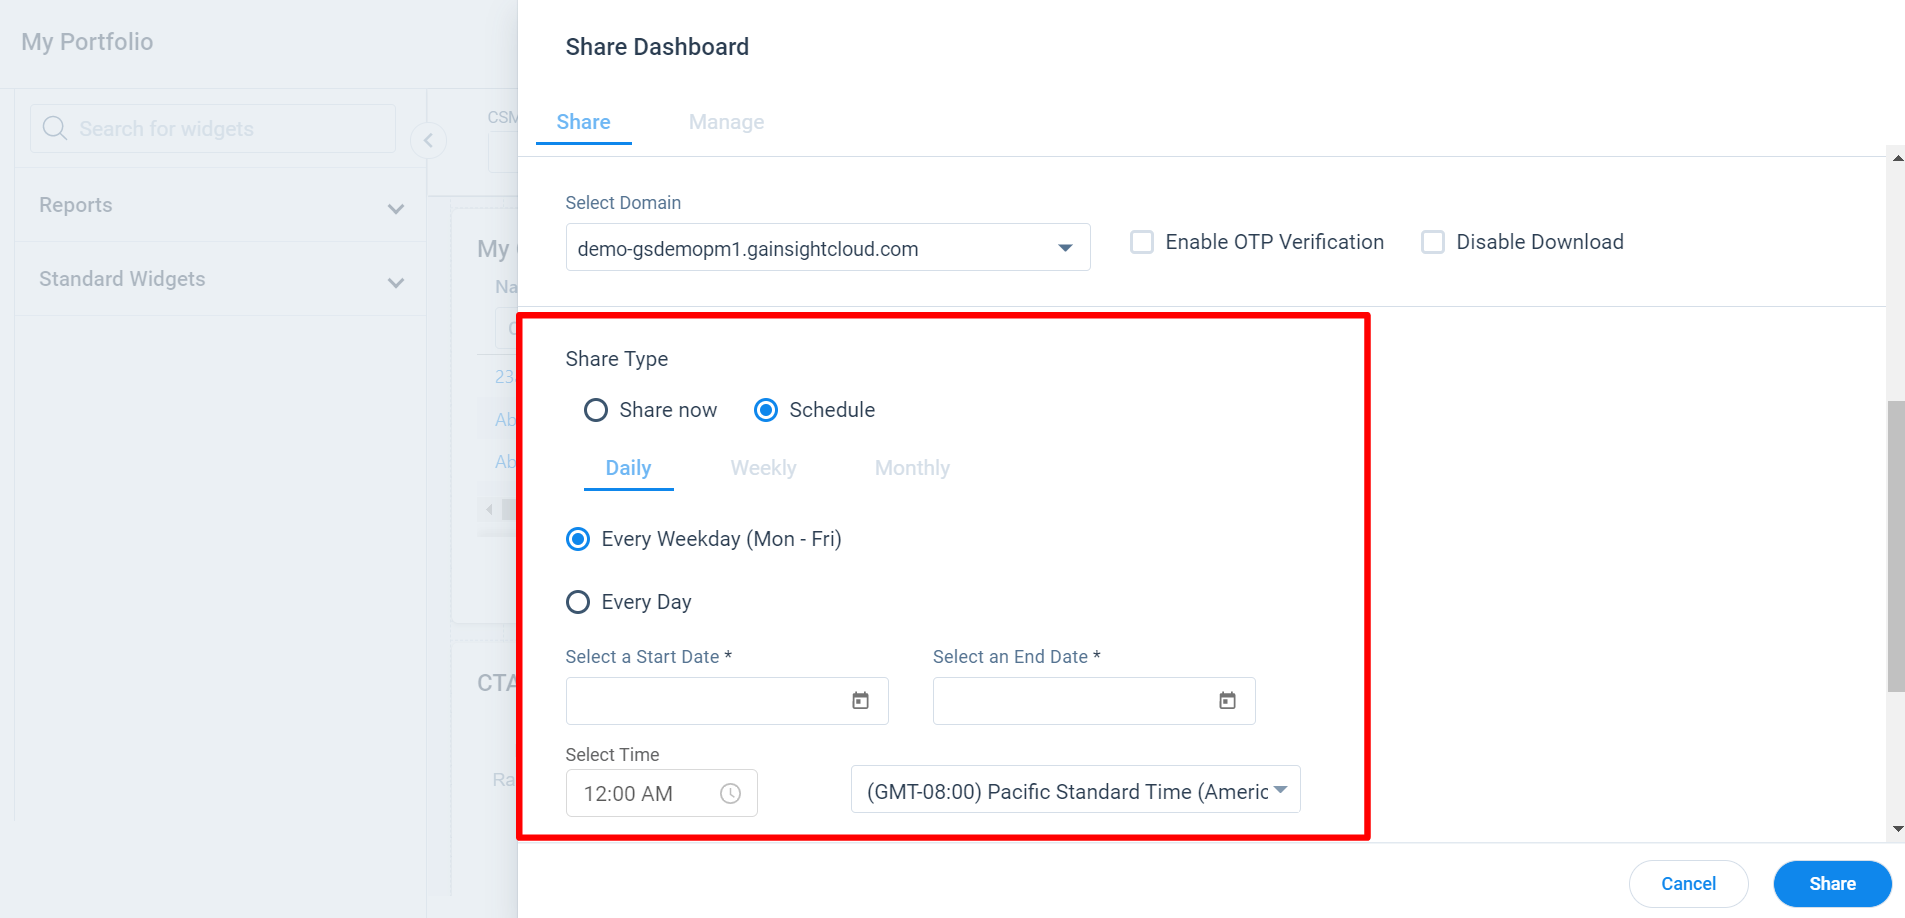
Dashboards can also be shared based on a criteria in the Share Type section. In the Share Type section, you can select either Share now or Schedule for setting the sharing criteria.
-
Share now: Select this option to share the dashboard with users immediately and set an expiry period for the link.
-
Schedule: Select the schedule type based on your business requirement.
- Daily: Select either Every Weekday (Mon-Fri) or Everyday to share the dashboard with the users on a daily basis.
- Weekly: Select the preferred day in a week for sharing the dashboard.
- Monthly: Select a preferable Date or Day in a month to schedule sharing on a weekly basis.
For more information on how to Share a Dashboard, refer to the Share Dashboard article in the Additional Resources section at the end of this article.
Once the export is completed, as a logged-in user, you will receive an email with the PowerPoint attached. The exported dashboard can be viewed in Microsoft PowerPoint. However, Google Slides and Apple Keynote files may work, but something in the PPT might break.
Notes:
-
If the current user has configured report visualization types or local filters, all these settings along with Global Filters are respected in the PPT version of the dashboard.
-
If the dashboard contains tabular reports, approximately 10 rows of data is displayed per slide for that report.
Additional Resources
- Reports and Dashboards Overview
- Advanced Report Settings
- Chart Settings and Chart Editor
- Color Setting in Reports
- Configure Aliases in Reports
- Configure Column Line Visualization Report
- Configure Dashboard for Sharing
- Configure Dashboards
- Dashboard Permissions
- Formula Fields in Reporting
- Global Filters for Dashboards
- How to Build Basic Reports
- Report List View and Settings
- Dashboards Overview
- Share Dashboard