Dashboards Overview
Gainsight NXT
This article provides an overview of the Dashboards page.
Overview
A Dashboard is a collection of reports and widgets, which helps users track and analyze the data. Admins must configure dashboards within Administration > Dashboard Builder before end users can see them. For more information about the setup process, refer to the Configure Dashboards article in the Additional Resources section at the end of this article.
Different dashboards can be configured for different users and purposes. For example, managers can review dashboards in executive or team meetings, or users can review their book of business using a dashboard. Optionally, export the dashboards via email to internal users as live links or as PPTs.
Dashboards Page
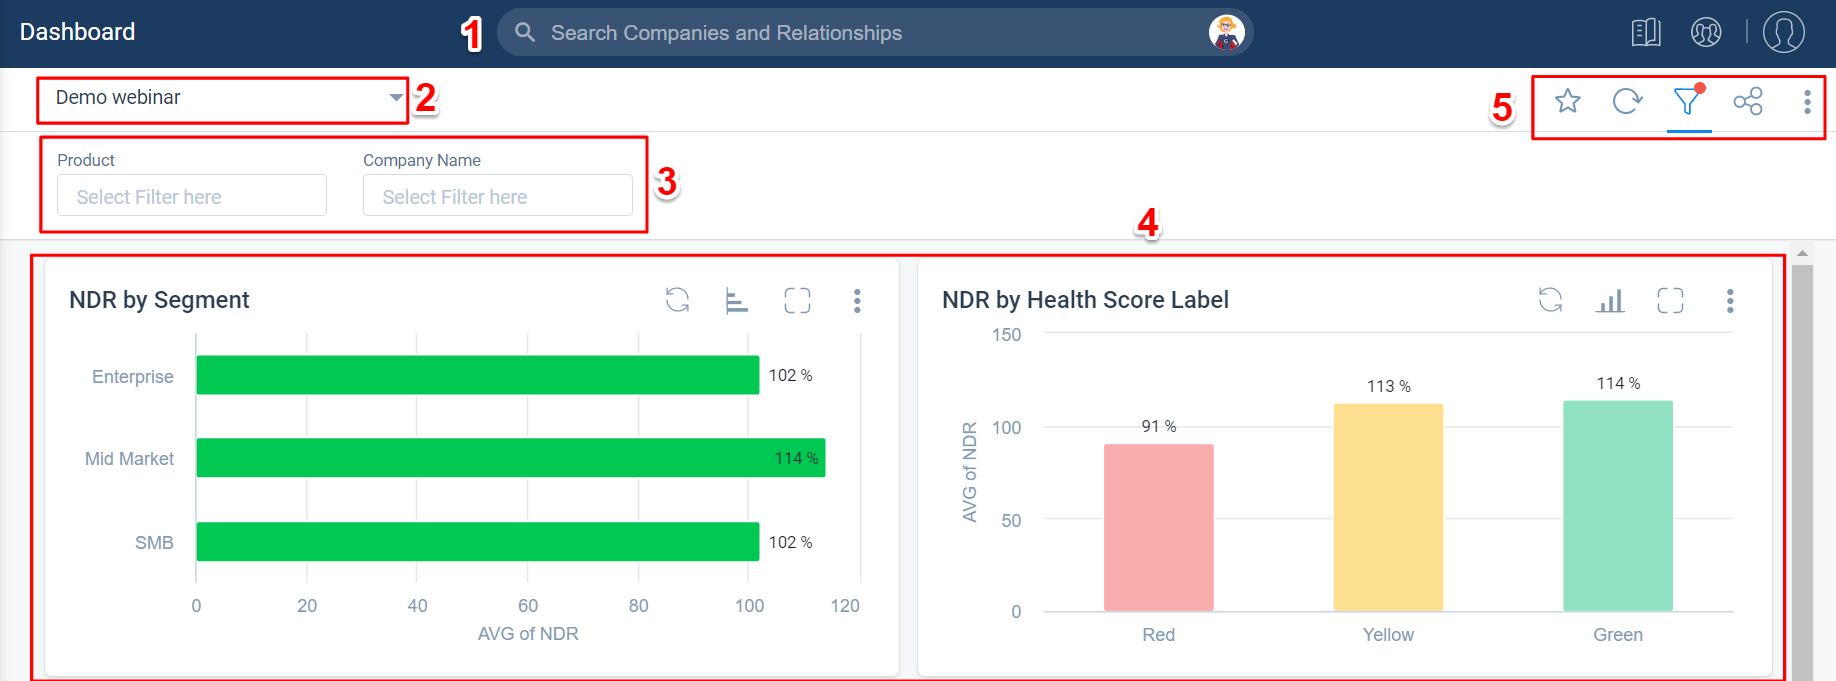
In the Dashboards page, the following details are displayed as shown in the image.

- Global Search: Enables you to search for companies and relationships. Admins can configure companies and relationships search to include additional fields for searching a company or relationship. For more information, refer to the Configuring Customer Search Settings (C360) article in the Additional Resources section at the end of this article.
- Dashboard Search: The Dashboard Search dropdown list contains all dashboards that you have access to. You can view My Favorites and Others sub-categories in the Dashboard Search dropdown.
Note: For more information on how admins can assign dashboards to users, refer to the Dashboard Permissions article in the Additional Resources section at the end of this article. - Global Filter: Global Filters allow you to filter the data in multiple reports in one go for easier analysis. They are created by Admins during the dashboard creation. Users can modify the Global Filters only if they are unlocked by admins.
- Dashboard Layout: The layout is the main part of the dashboard which contains Reports and Widgets. Users can also modify the Reports by adding additional filters or changing visualizations. These changes are no longer sticky and we will only save them if you click on the Save button in the banner. For more information, refer to the Dashboard Filters section in this article.
Note: Stare preservation is not supported when filters are added to widgets (except for Reporting widgets) in the Dashboard. - Dashboard Functionalities: You can perform the following actions:
- Favorite: Click to mark that specific dashboard as a favorite. You can view all your favorite dashboards in the Dashboard Search dropdown under the My Favorites sub-category.
- Refresh: Click to refresh data in the reports. If you run a report multiple times in a day, we cache the data for faster performance. Use this icon to get the latest data across the dashboard.
- Filters: Click to hide or show the Global Filters in the dashboard.
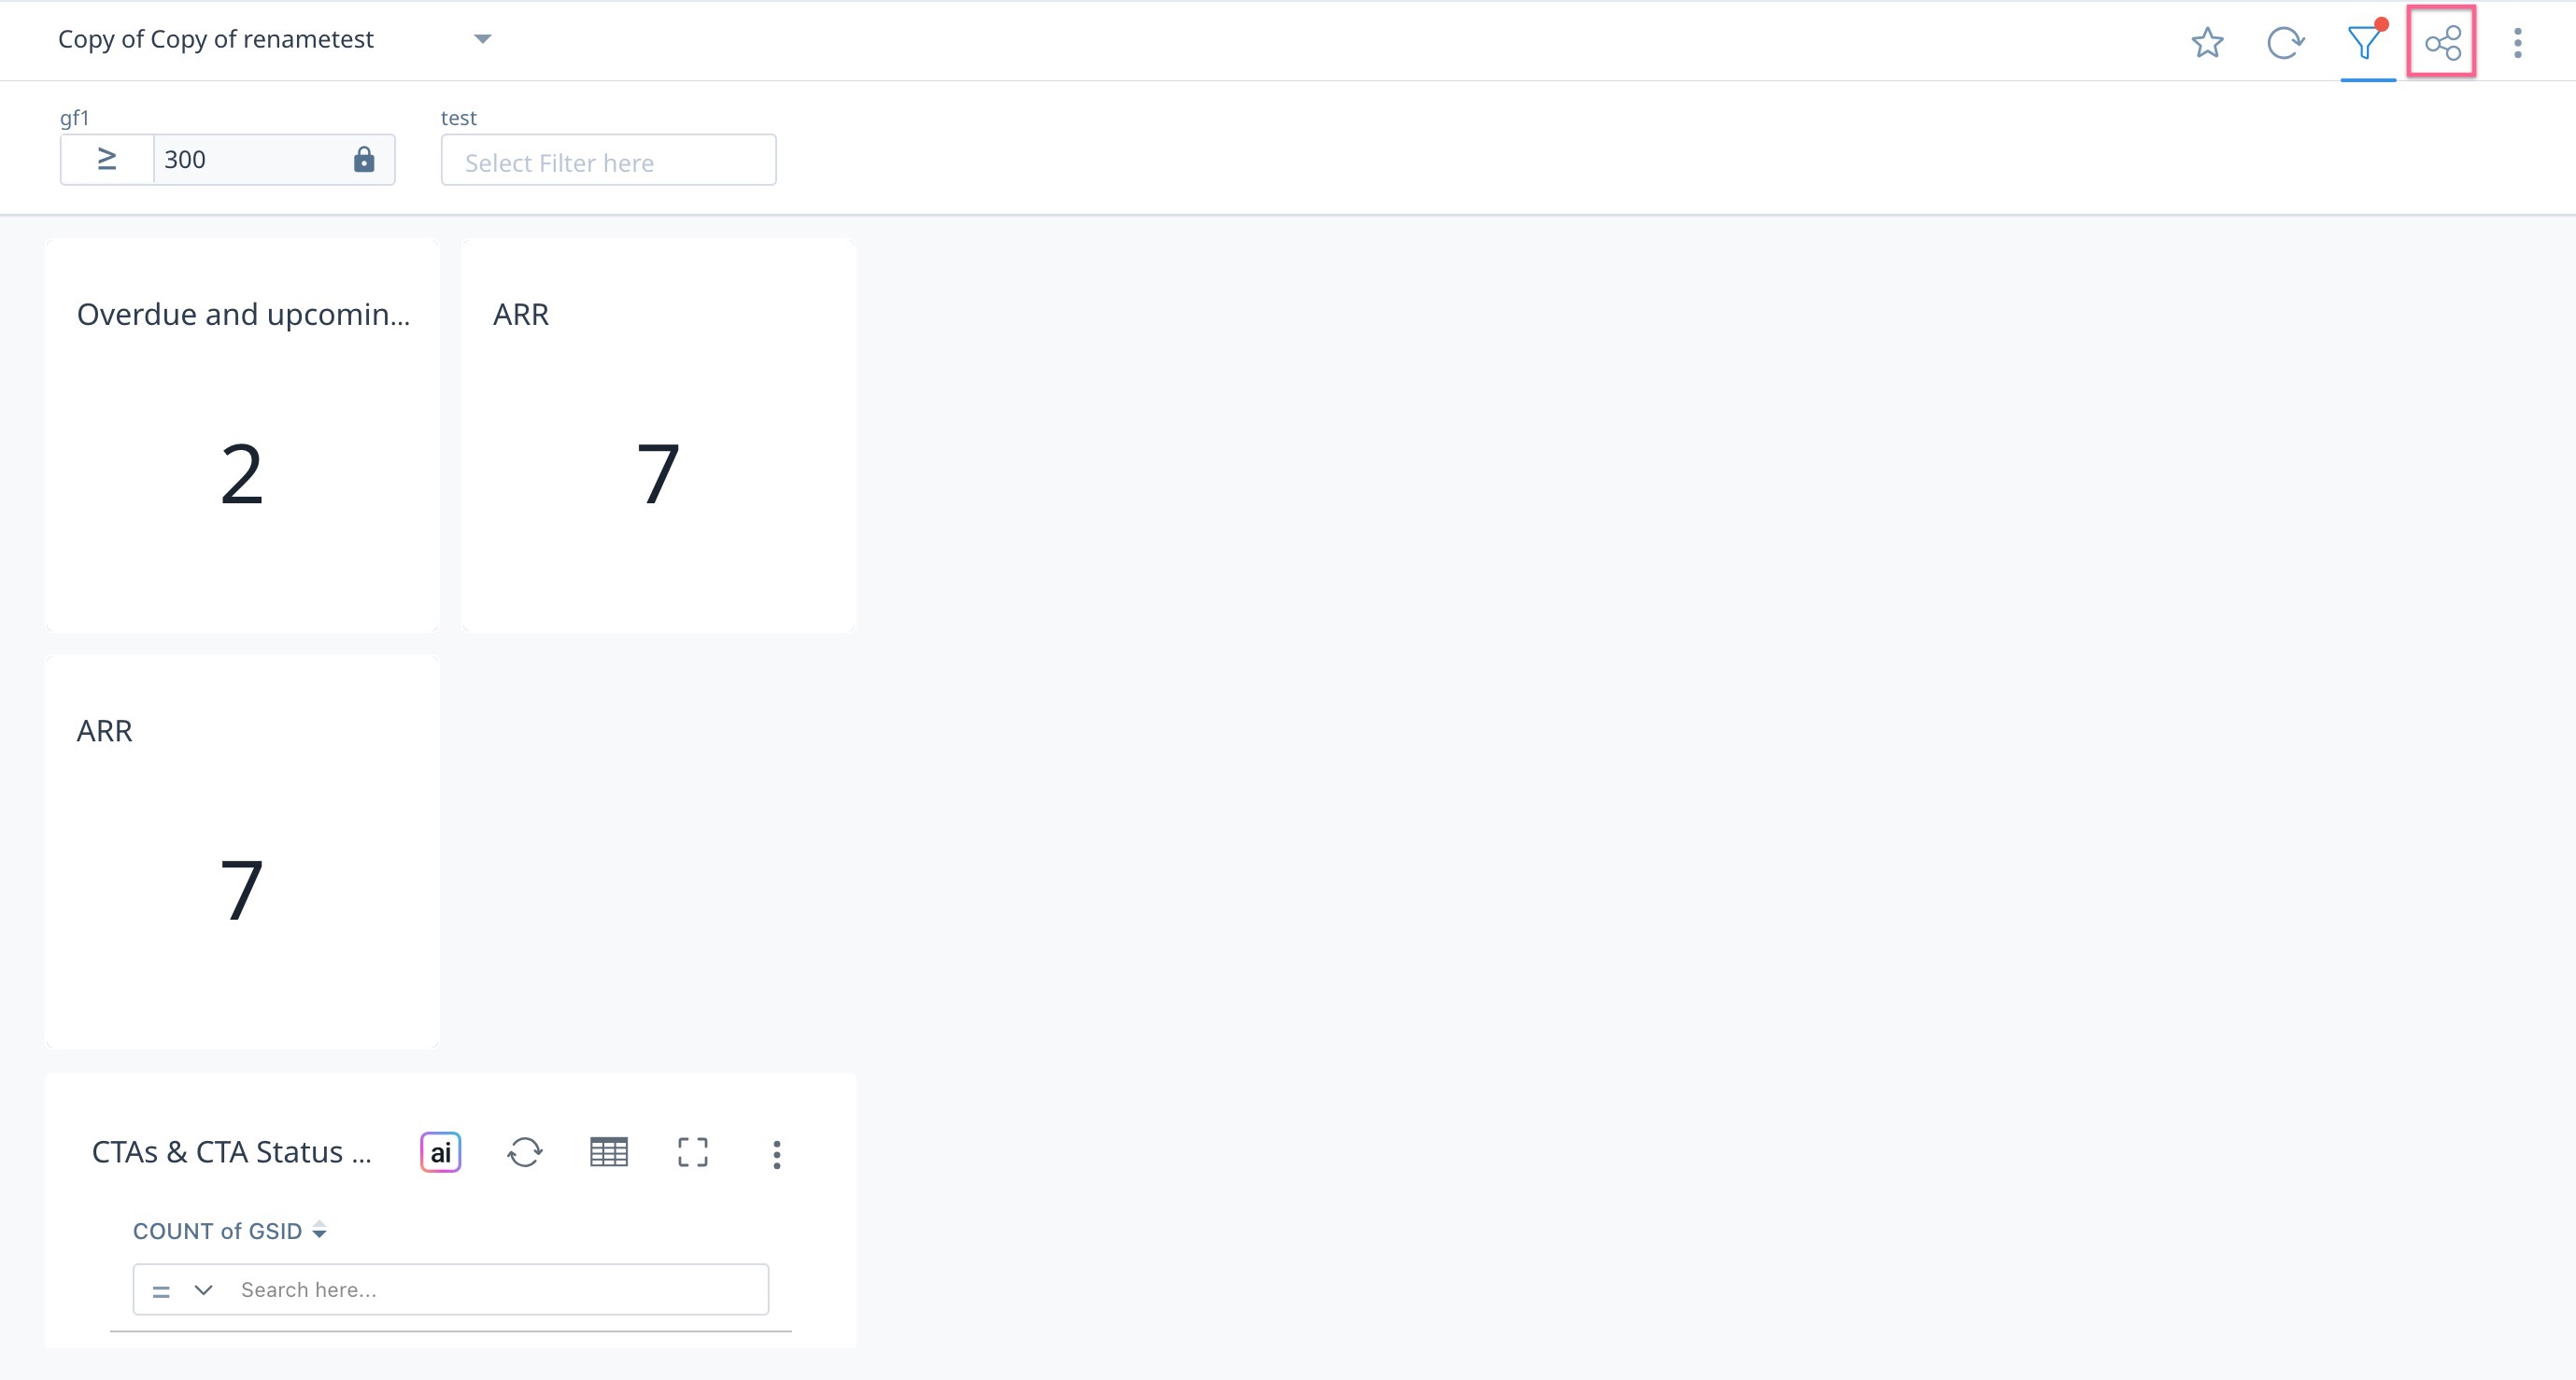
- Share Dashboard: Users can Share dashboards via email to other Gainsight users. You need to have Share access to view this. For more information, refer to the Share Dashboard with Users section in this article.
- Context Menu: Click to view the following options:
- Download as PDF: Click to export the PDF version of the dashboard.
- Reset: If you make any changes to the dashboard and in case it becomes unusable, you can always reset it to the original dashboard created by the admin by clicking on the Reset button.
- Edit: Click to make changes to the dashboard in the Dashboard Builder page. Users with edit access can see this option.

Share Dashboard with Users
Share a dashboard as a link or as a PPT via email with any user. The dashboards must be configured for sharing by the admin and the user must have sharing access. The configured dashboard can then be shared through email as a link or PPT, with optional security settings. The recipient must be added as a Gainsight user into the Gainsight User object. For example, a CSM could share the Monthly Renewals dashboard with their CRO, which is delivered to the CRO as a link in an email every month.
For information on how to configure a dashboard for sharing (admin), refer to the Configure Dashboard for Sharing article in the Additional Resources section at the end of this article. For information on how to share the dashboard (CSM/user), refer to the Share Dashboards article in the Additional Resources section at the end of this article.
Dashboards can be shared in two ways:
- From the Dashboard page, click Share icon.

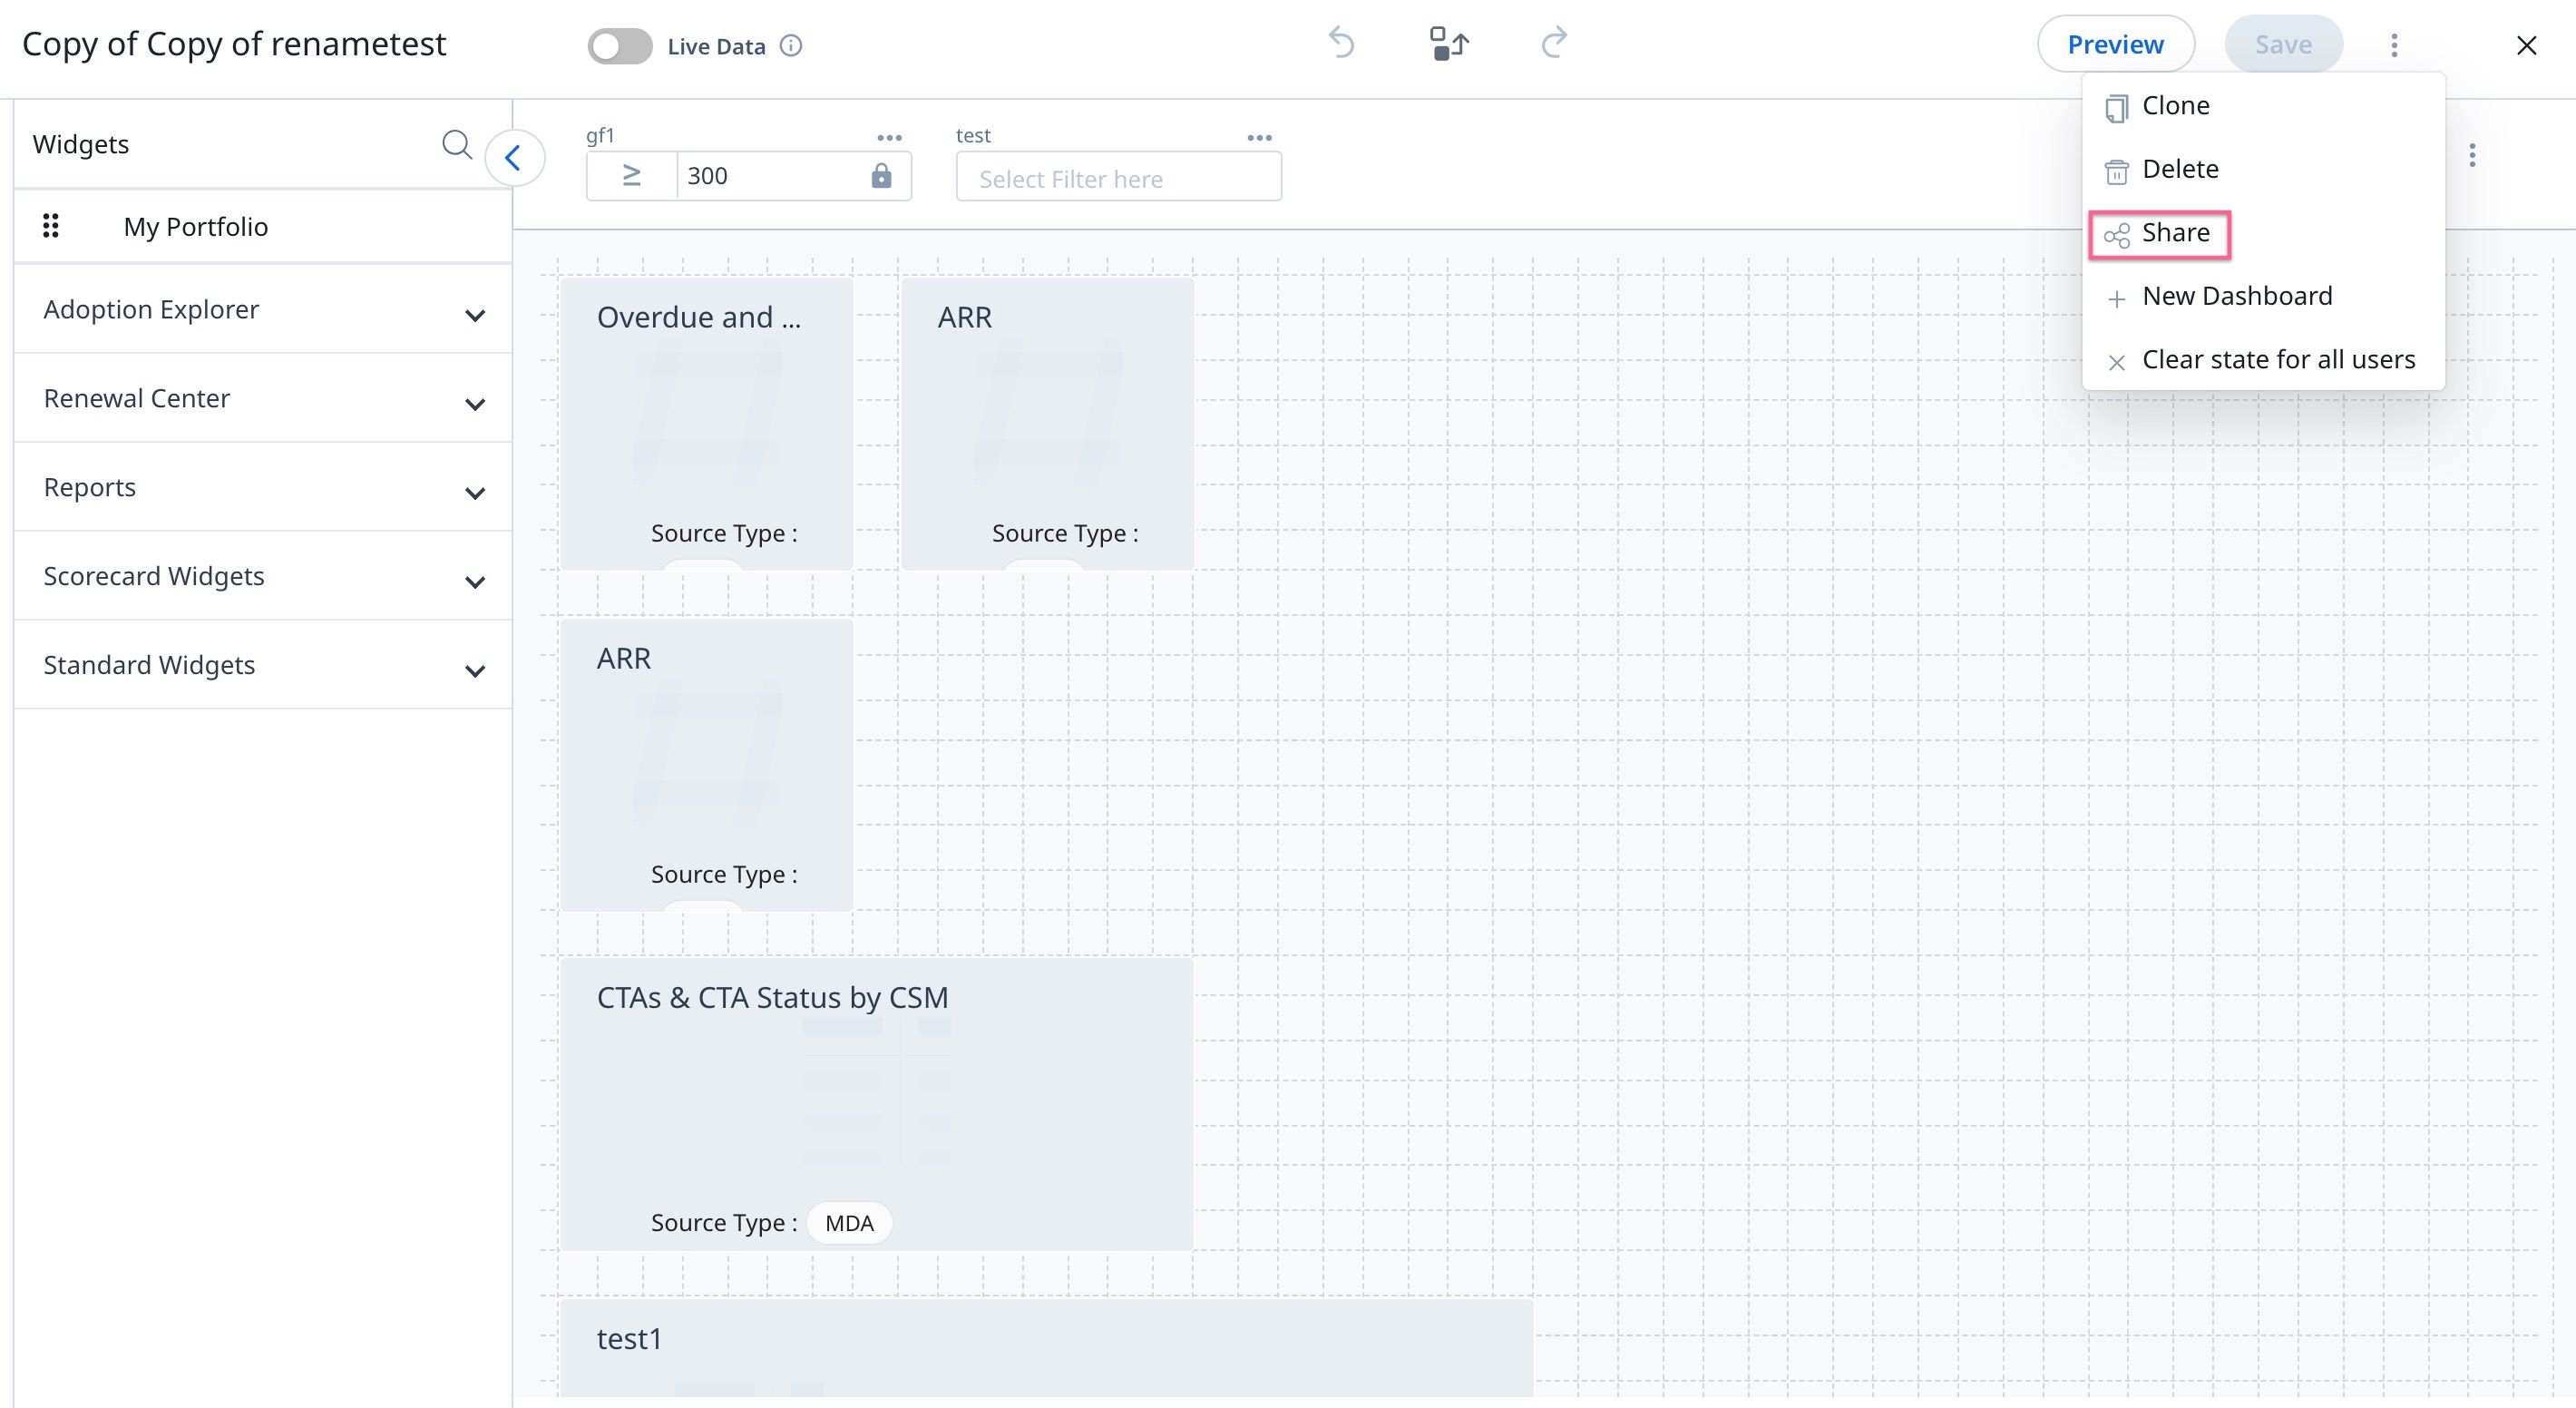
- From the Dashboard Builder, under the context menu.

Dashboard Filters
The admin can configure Global Filters for reports in the dashboards. Users can apply filter values to the Global Filters in the dashboards, only if the Global Filters are not locked by the admin.
For more information on how admins can add Global Filters, refer to the Global Filters for Dashboards article in the Additional Resources section at the end of this article. Apart from Global Filters, Users can add Additional Filters to the reports in the dashboard. For more information, refer to the Tabular Report and Graphical Overview section in this article.
Tabular and Graphical Report Overview
In the tabular report, perform the following actions:
- Sort ascending/descending by clicking the column header.
- Click the Operator in the column header, select the operator and search for a value.
- Click on the customer name to jump to the Customer 360 view for that customer.
- Hyperlink a Report Name in Dashboard with another Dashboard/external resources.
Note: Sorting and Searching are not allowed for all data types (Picklist, Multi picklist, Rich text area, etc.)
In addition to the above, you can do the following:
Change Visualization
Click the Change visualization icon to change the visualization of the tabular or graphical report to any other representation.
Note: Visualization types are dependent on the number of fields added to Show Me and Group By. For more information, refer to the How to Build Basic Reports article in the Additional Resources section at the end of this article.
If a user modifies the filters or visualization types on the Dashboards page, their changes are saved in their view. When admins make any changes to the Report Filters or Visualization Types on a report that already exists in a dashboard, those changes are not automatically propagated to the dashboard. CSM’s need to Reset the dashboard to make the admin changes visible.
Maximize Report Details
To maximize the report:
- Click the Maximize report icon to display the detailed data of tabular or graphical reports.
- Depending on the data you have in the tabular report, use the Pagination to view data in a set of 50,100 or 200 on a single page, based on your selection.
Note: You can also see the total number of records in a report. - Click the Exit full screen icon to return to the Dashboards page.
Context Menu
Click the Context menu on the corresponding report, the following options are displayed as shown in the below image.
- Filter: Click Filter to add additional filters to the corresponding reports. For more information on adding filters, refer to the Add Report Filters section in this article.
- Reset: Click Reset to reset the report to its default settings.
Notes:- Changes made to reports by adding filters can be preserved by clicking Save on the preserve state message that appears on top of the page.
- These changes will be preserved only for that User.
- Reset the dashboard to the one that the admin created. Admins can also clear these changes as they improve the dashboard.
- Settings: Click Settings to configure the chart settings. The chart options may vary based on the selected chart type. For more information on chart settings, refer to the Chart Settings and Chart Editor article in the Additional Resources at the end of this article.
-
Ranking: Use Ranking to sort the tabular report in either Ascending order, Descending order, or setting a Limit count in the reports. For more information on how to configure the ranking, refer to the Advanced Report Settings article in the Additional Resources at the end of this article.
-
Download Data: Allows you to download data in the Excel file.
-
Download Image: Allows you to download the image of Graphical Reports.
Note: Download Data and Download Image options are not available if the admin has disabled the Download Report Data options in the General Settings page. For more information, refer to the Report List View and Settings article in the Additional Resources section at the end of this article.
Drilldown Report
The Drilldown Report can be accessed by clicking on a data point on the graph from Dashboards page or by viewing the report in maximized page.
- Click any data point on the graph, the Drilldown Report appears.
- Use Pagination to view the data in a set of 50,100, or 200 on a single page, based on your selection.
- Click Analyze Report, to make changes to report in the Report Builder page.
- Click the Download icon to download the report in Excel file.
- Click + icon to add additional fields to the report.
- Search the fields in the Search Fields box, or scroll and select the Fields.
- Click Apply.
- Click Run, to refresh the report with the added fields.
- Click Save, to retain the changes.
Note: Once the fields are added, click Save in the message that appears on the Dashboards page to preserve the state of the report.
To remove the fields added in the report:
- Access the Drilldown Report.
- Click the Reset icon to reset the current field selection to the default display setting.
- Click Save.
Note: To reset the Report to the original default settings of Admin, click Reset from the context menu of the Dashboard. For more information refer to the Dashboards Page section in this article.
Global and Report Filters
To view the Dashboards with applied filters:
- Navigate to the Dashboards page.
- Select the required dashboard. The Global Filters created in the Dashboard Builder page are displayed in the Dashboards page.
- As an end-user, you can modify the filter values of unlocked filters on this page and view the updated dashboard.
Note: When a user modifies a filter, a message on the top of the dashboard is displayed asking to save the changes made. Click Save or click Dismiss as required. - Add additional filters to a report on the dashboard, click Filter in the context menu of the corresponding report.
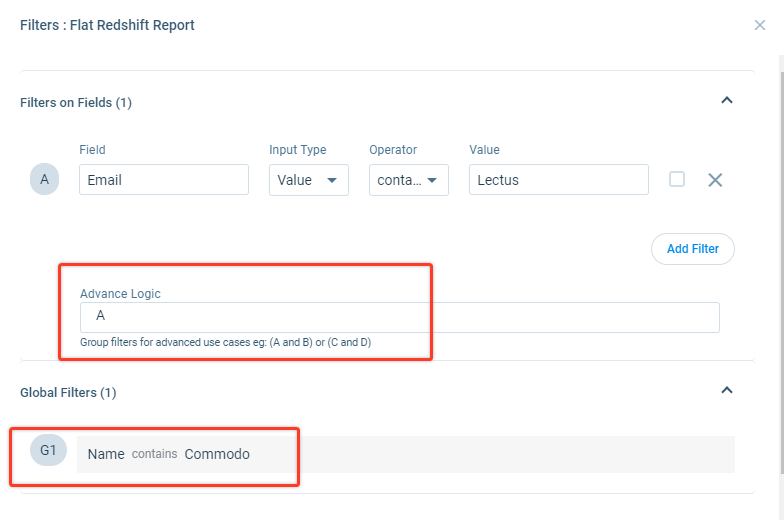
- The Filters page for the report is displayed. This page displays Filters on Fields section and Global Filters section.
- Expand the Filters on Fields section to add additional filters to the report.
- Expand the Global Filters section to see the global filters applied.
Add Report Filters
To add additional filters to reports in dashboards:
- From the Context menu of the corresponding report, click Filters. The Filters page for the report is displayed.
- Expand the Filters on Fields section.
- Click Add Filter.
- From the Field dropdown list, select the object.
- From the Input Type dropdown list, select either Value or Field.
- From the Operator dropdown list, select the required operator.
- If the Input Type selected is Value, enter the field value in the Value text box.
- If the Input Type selected is Field, from the Target Field dropdown, select the object.
- Click Apply.
IMPORTANT:
- The global filters applied to the report are displayed with a prefix, for example, G1 for the first Global Filter, G2 for the second global filter, and so on. Also, the global filters are appended at the end of Advanced Logic with the AND operator.
- If a global filter is applied on a field on which a report level filter is already applied, the global filter overrides the report level filter.
- If any Date or Date-Time object related field is selected from the Field dropdown list, you can apply time range filters to cover preferred time span. For example, 'Current and Next N Years', 'Current and Past N Quarters' etc.
- Filters on Aggregated Data section allows you to apply filters on the aggregated data. You can only see the aggregated fields in this section.
- When a user modifies a filter, a message on the top of the dashboard is displayed asking to save the changes made. Click Save or click Dismiss as required.

- To reset additional filters, click Reset in the context menu of the corresponding report. Resetting the filter will move it back to the default state, which is the state of the filter defined by the admin when it was created.
Note: To reset the Global Filters back to the default state, which is the state of the filter defined by the admin, click Clear in the Global Filters.