Advanced Report Settings
Gainsight NXT
This article explains admins about the settings available in Report Builder. Before getting started with this article, Gainsight recommends reading the How to Build Basic Reports article in the Additional Resources section at the end of this article to understand general reporting functionality.
The following are the settings available in Report Builder:
Aggregations
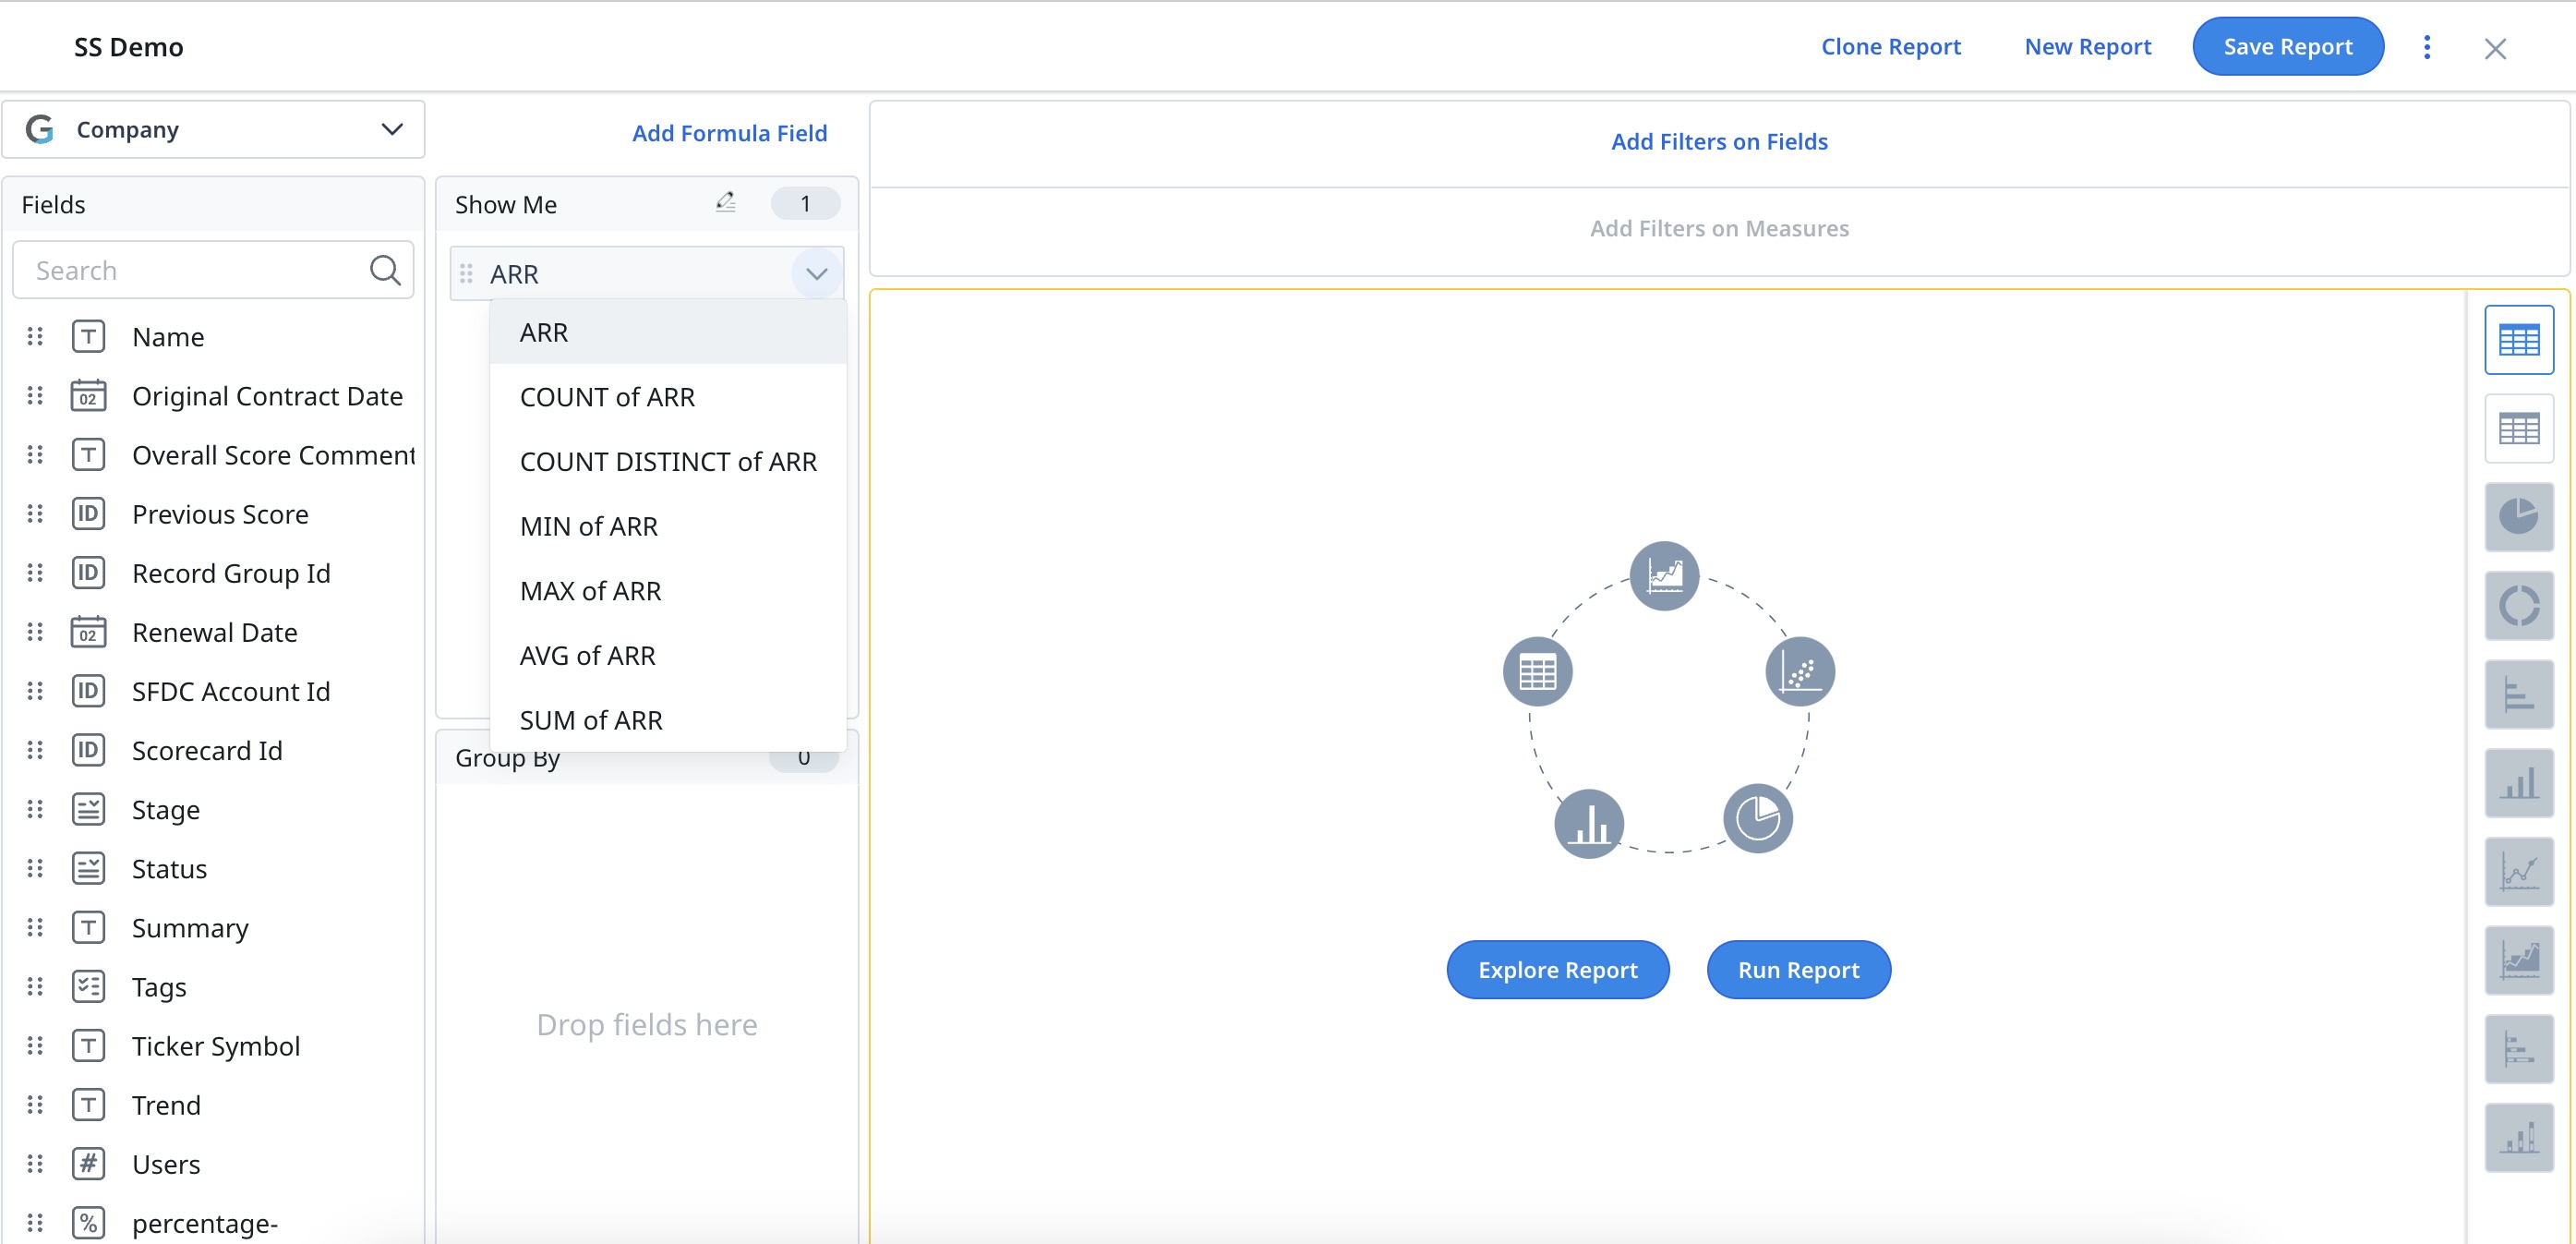
To choose aggregations, add the fields to Show Me. When you add a field to the Group By section, all the fields in Show Me are aggregated. The default aggregation is dependent on the field type. Text fields are automatically set to Count, and numeric fields are automatically set to Sum. Aggregation options for each data type include:
- String/Text: Count, Count Distinct
- Numeric: Count, Count Distinct, Min, Max, Avg, Sum
- Boolean: Count
- Date: Count, Count Distinct, Min, Max
- DateTime: Count, Count Distinct, Min, Max
Note: When you add a Date field to the Show Me section and have applied a Min/Max function with a field in the Group By section. You can only see the tabular report, but not the other visualization types. This behavior is applicable for MDA Objects, and for SFDC objects the Min/Max function is not shown on the Date Fields.
Set Column Calculations for Individual Columns
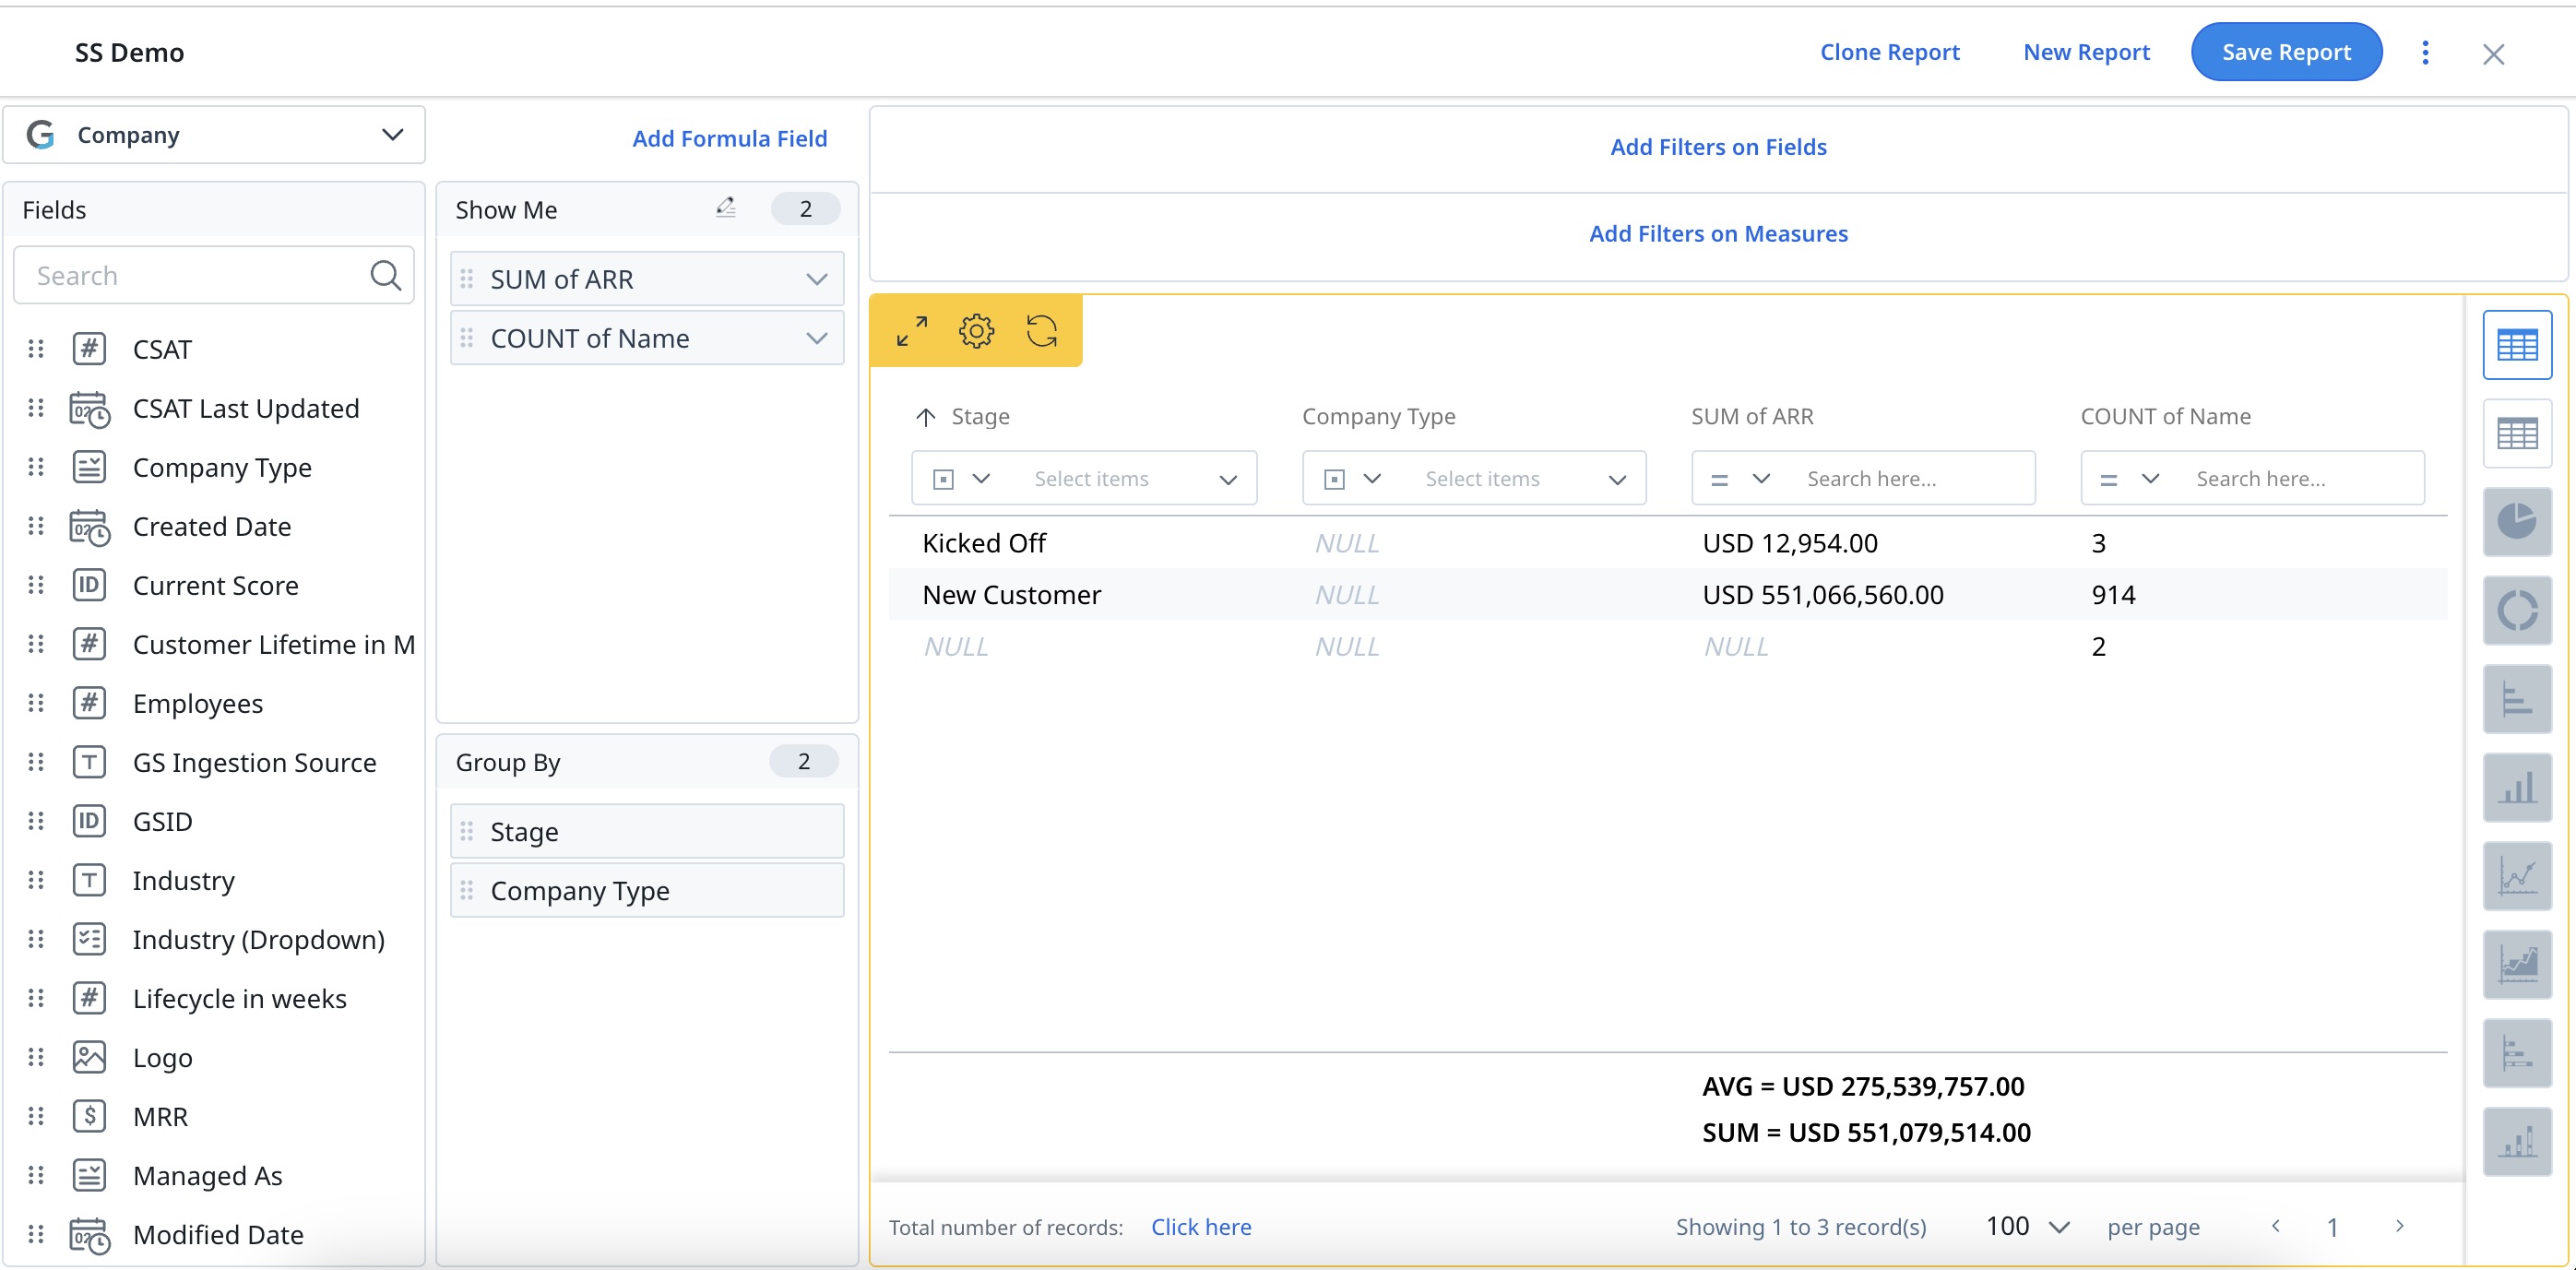
Add Column Calculated Function values (column aggregates) to tabular reports. In the Report Builder, for any numeric field in a tabular report, you can set aggregations (Sum and/or Average) for individual columns.
To set column totals:
- Click the Settings/Gear icon on the field.
- From the Column Calculations dropdown list, select the required aggregation. For example, select Sum and/or Average option (function) to appear in the column totals.
The column aggregate values are in reports on the Customer360, Gainsight Dashboards, and Success Snapshots, but are not available in CSV exports.
Limitations:
- Column Calculated Function values are not supported for Pivot reports that are visualized in Tabular format or any other chart visualization. Additionally, this feature is not supported when you export such reports using a CSV or Excel sheet.
- Works only with Tabular reports.
- Column Totals do not display Currency symbols in the exported reports.
- Column Calculations on Currency fields do not work if Multi Currency is enabled in your org.
Configure Decimal Places
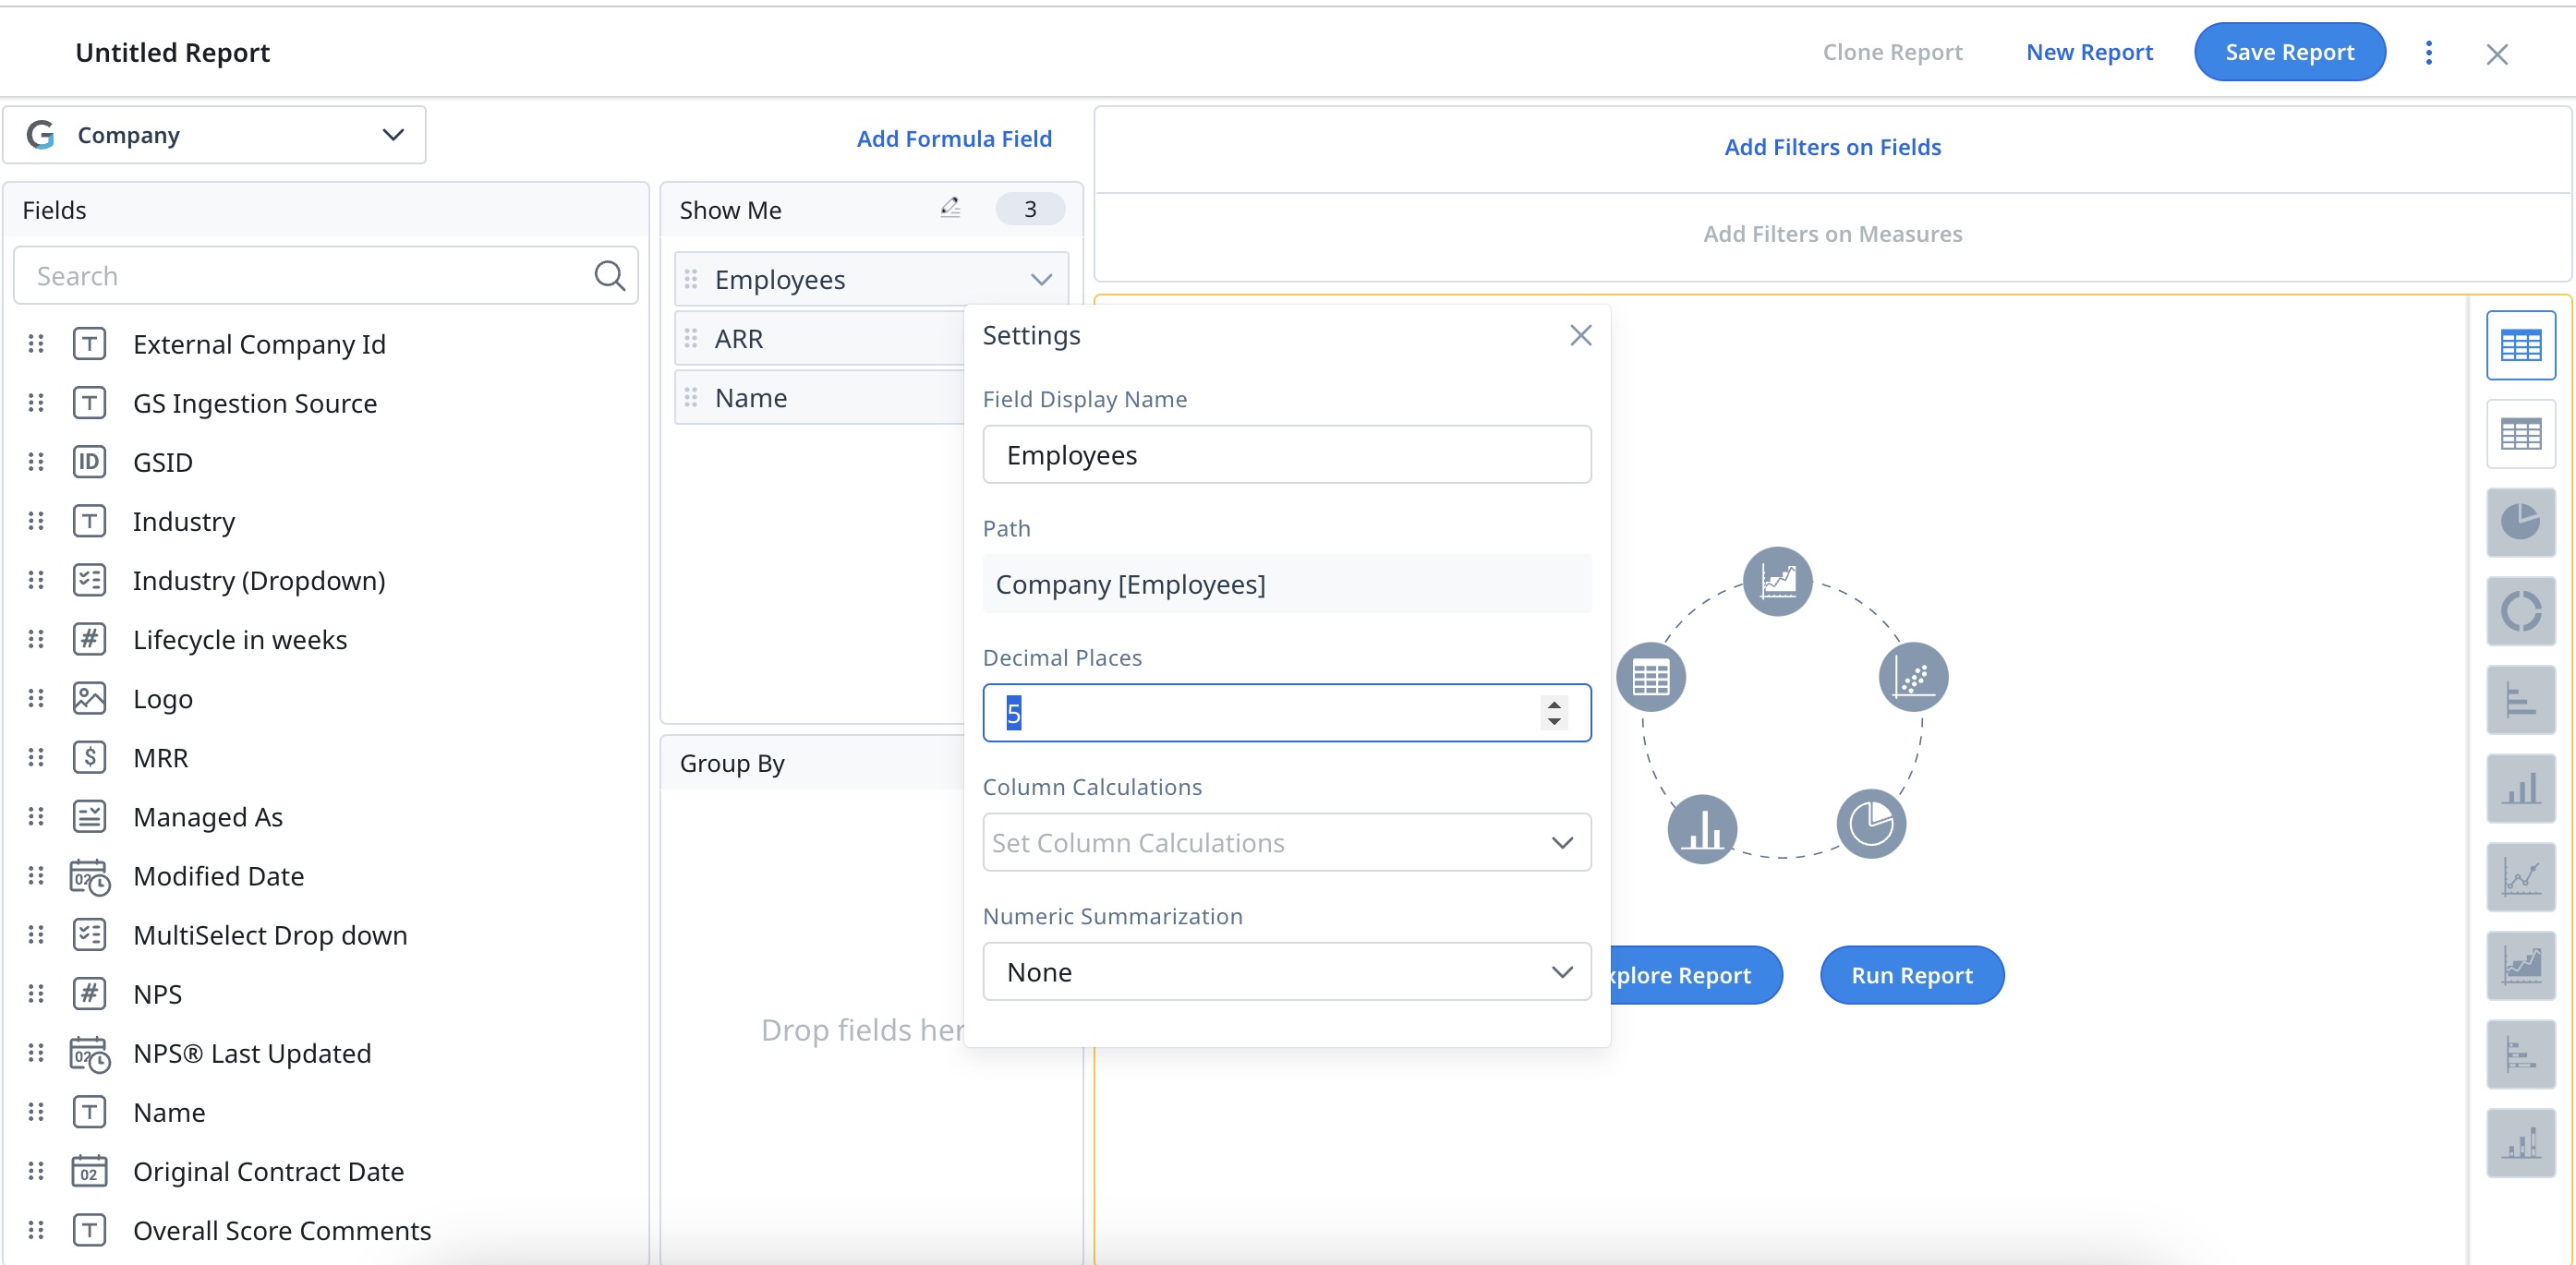
In the Report Builder, for any numeric field, you can assign up to five decimal places. By default, the assigned decimal place is zero.
Assign Numeric Summarization
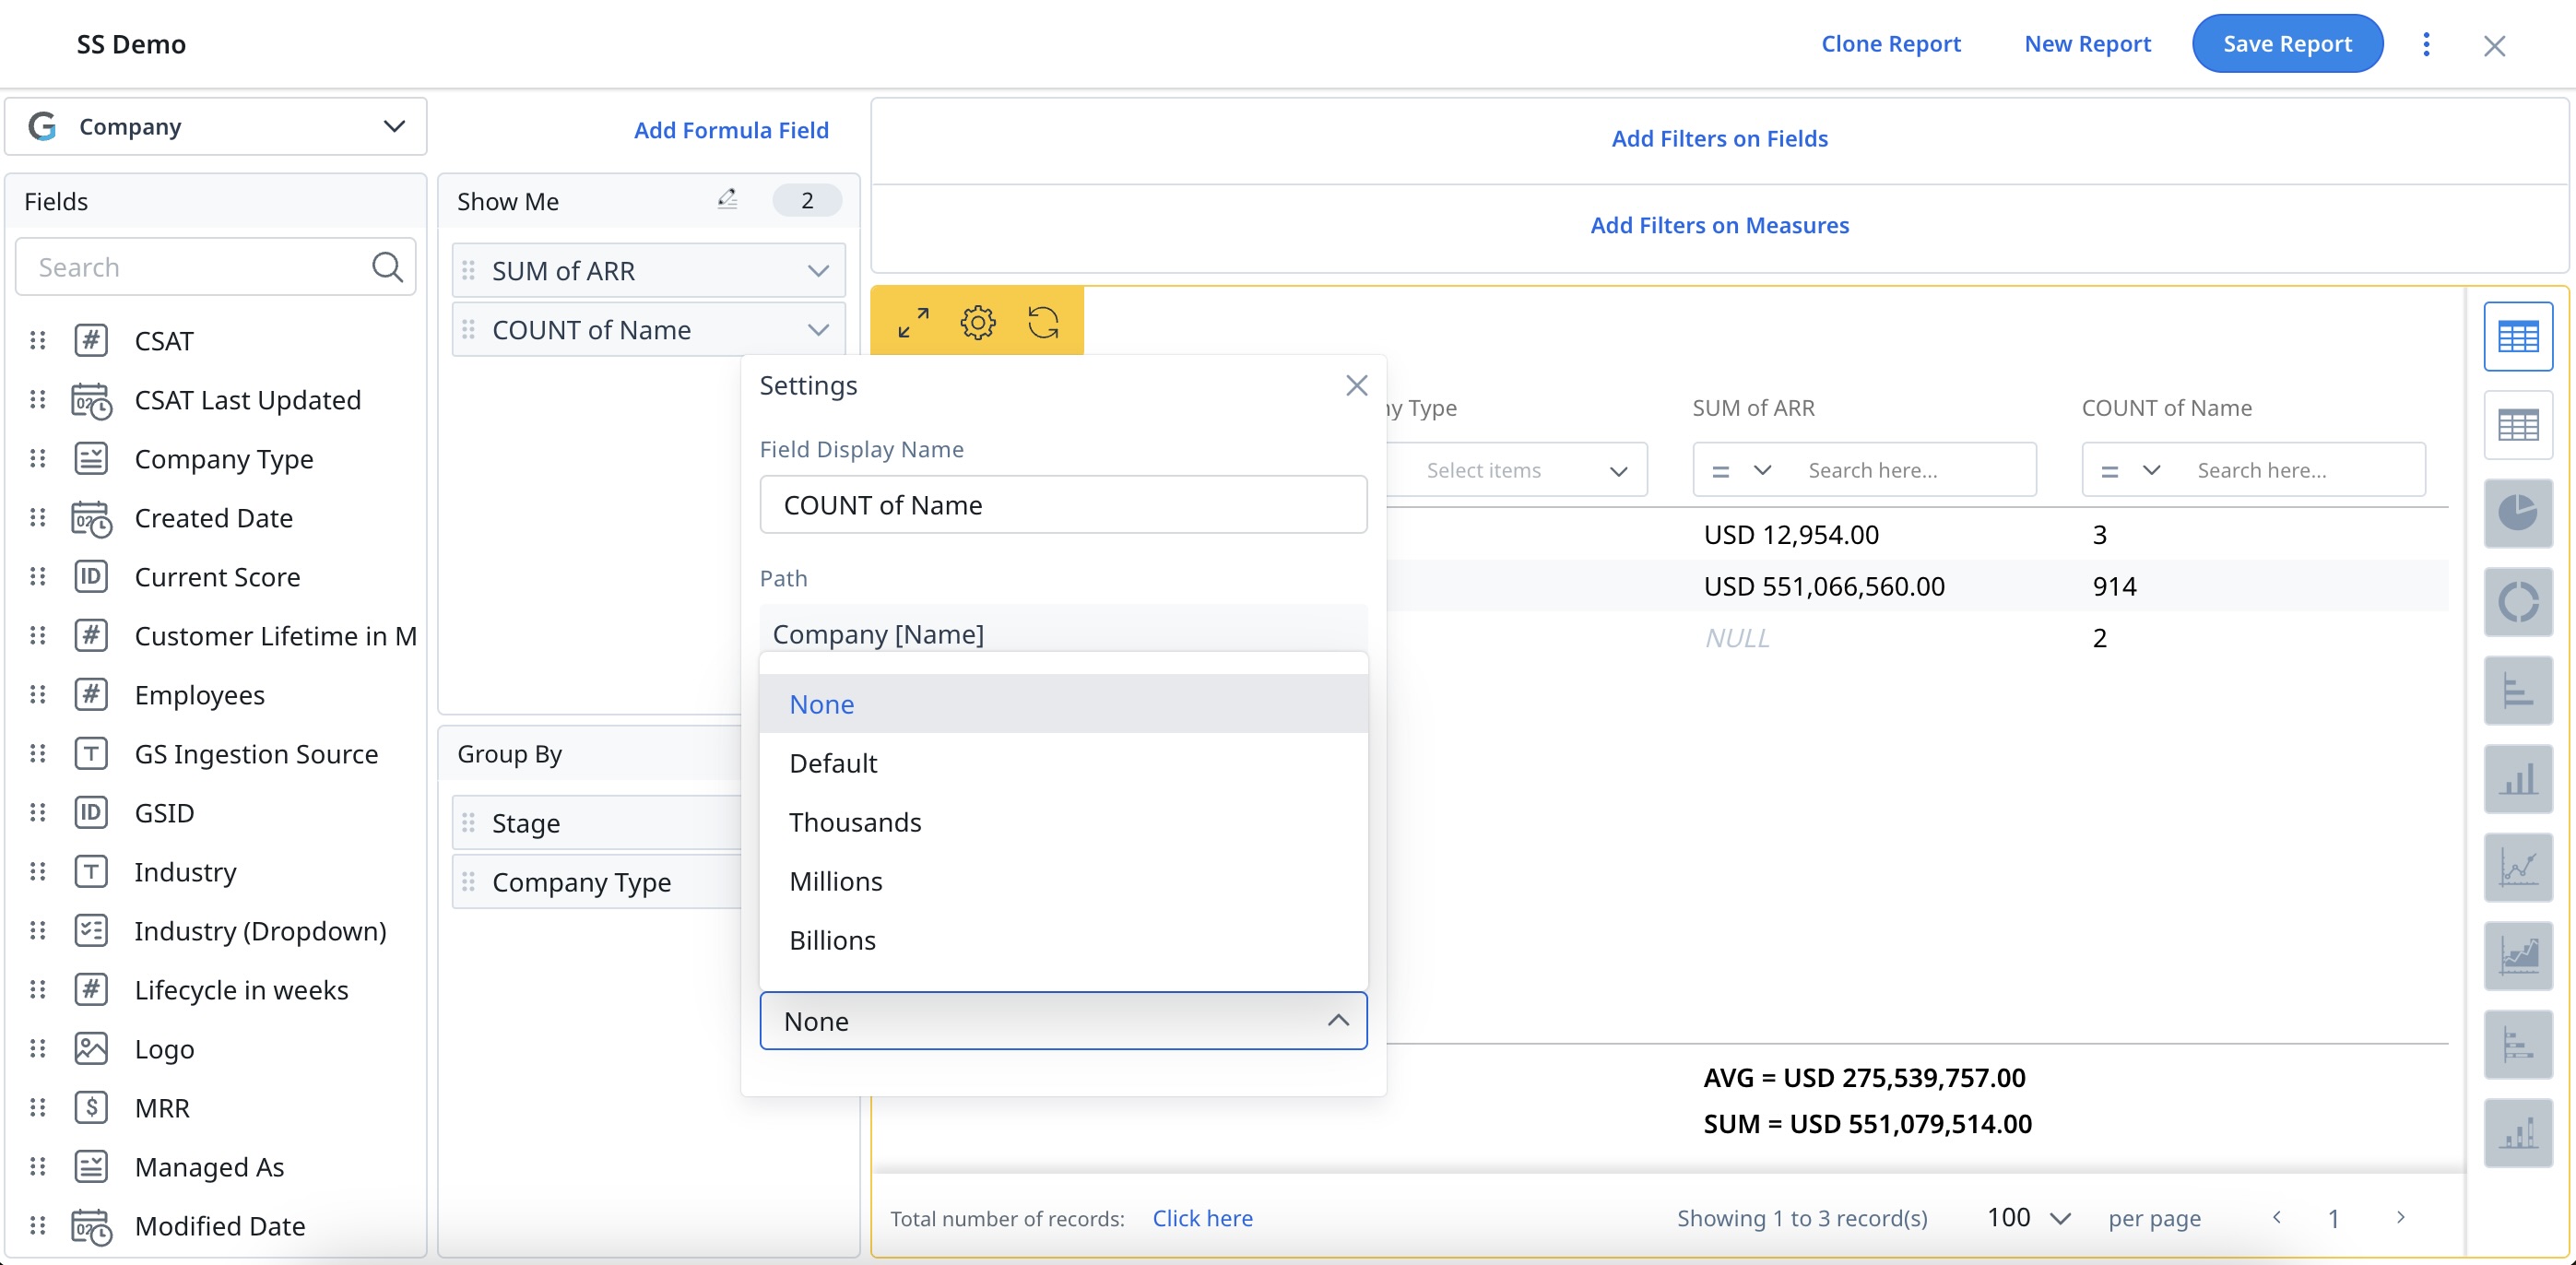
In the Report Builder, for any numeric field, you can assign Numeric Summarization value type (Default, Thousands, Millions and Billions) for individual records. By default, the assigned numeric summarization is None.
To assign Numeric Summarization:
- Click the Settings/Gear icon on the field.
- From the Numeric Summarization dropdown list, select the required value type. For example, select Default, Thousands, Millions and Billions for individual records.
Enable Row Grouping
Row Grouping in Reporting allows you to visually group the rows/records in a report by a dimension type field without aggregating all of the other fields.
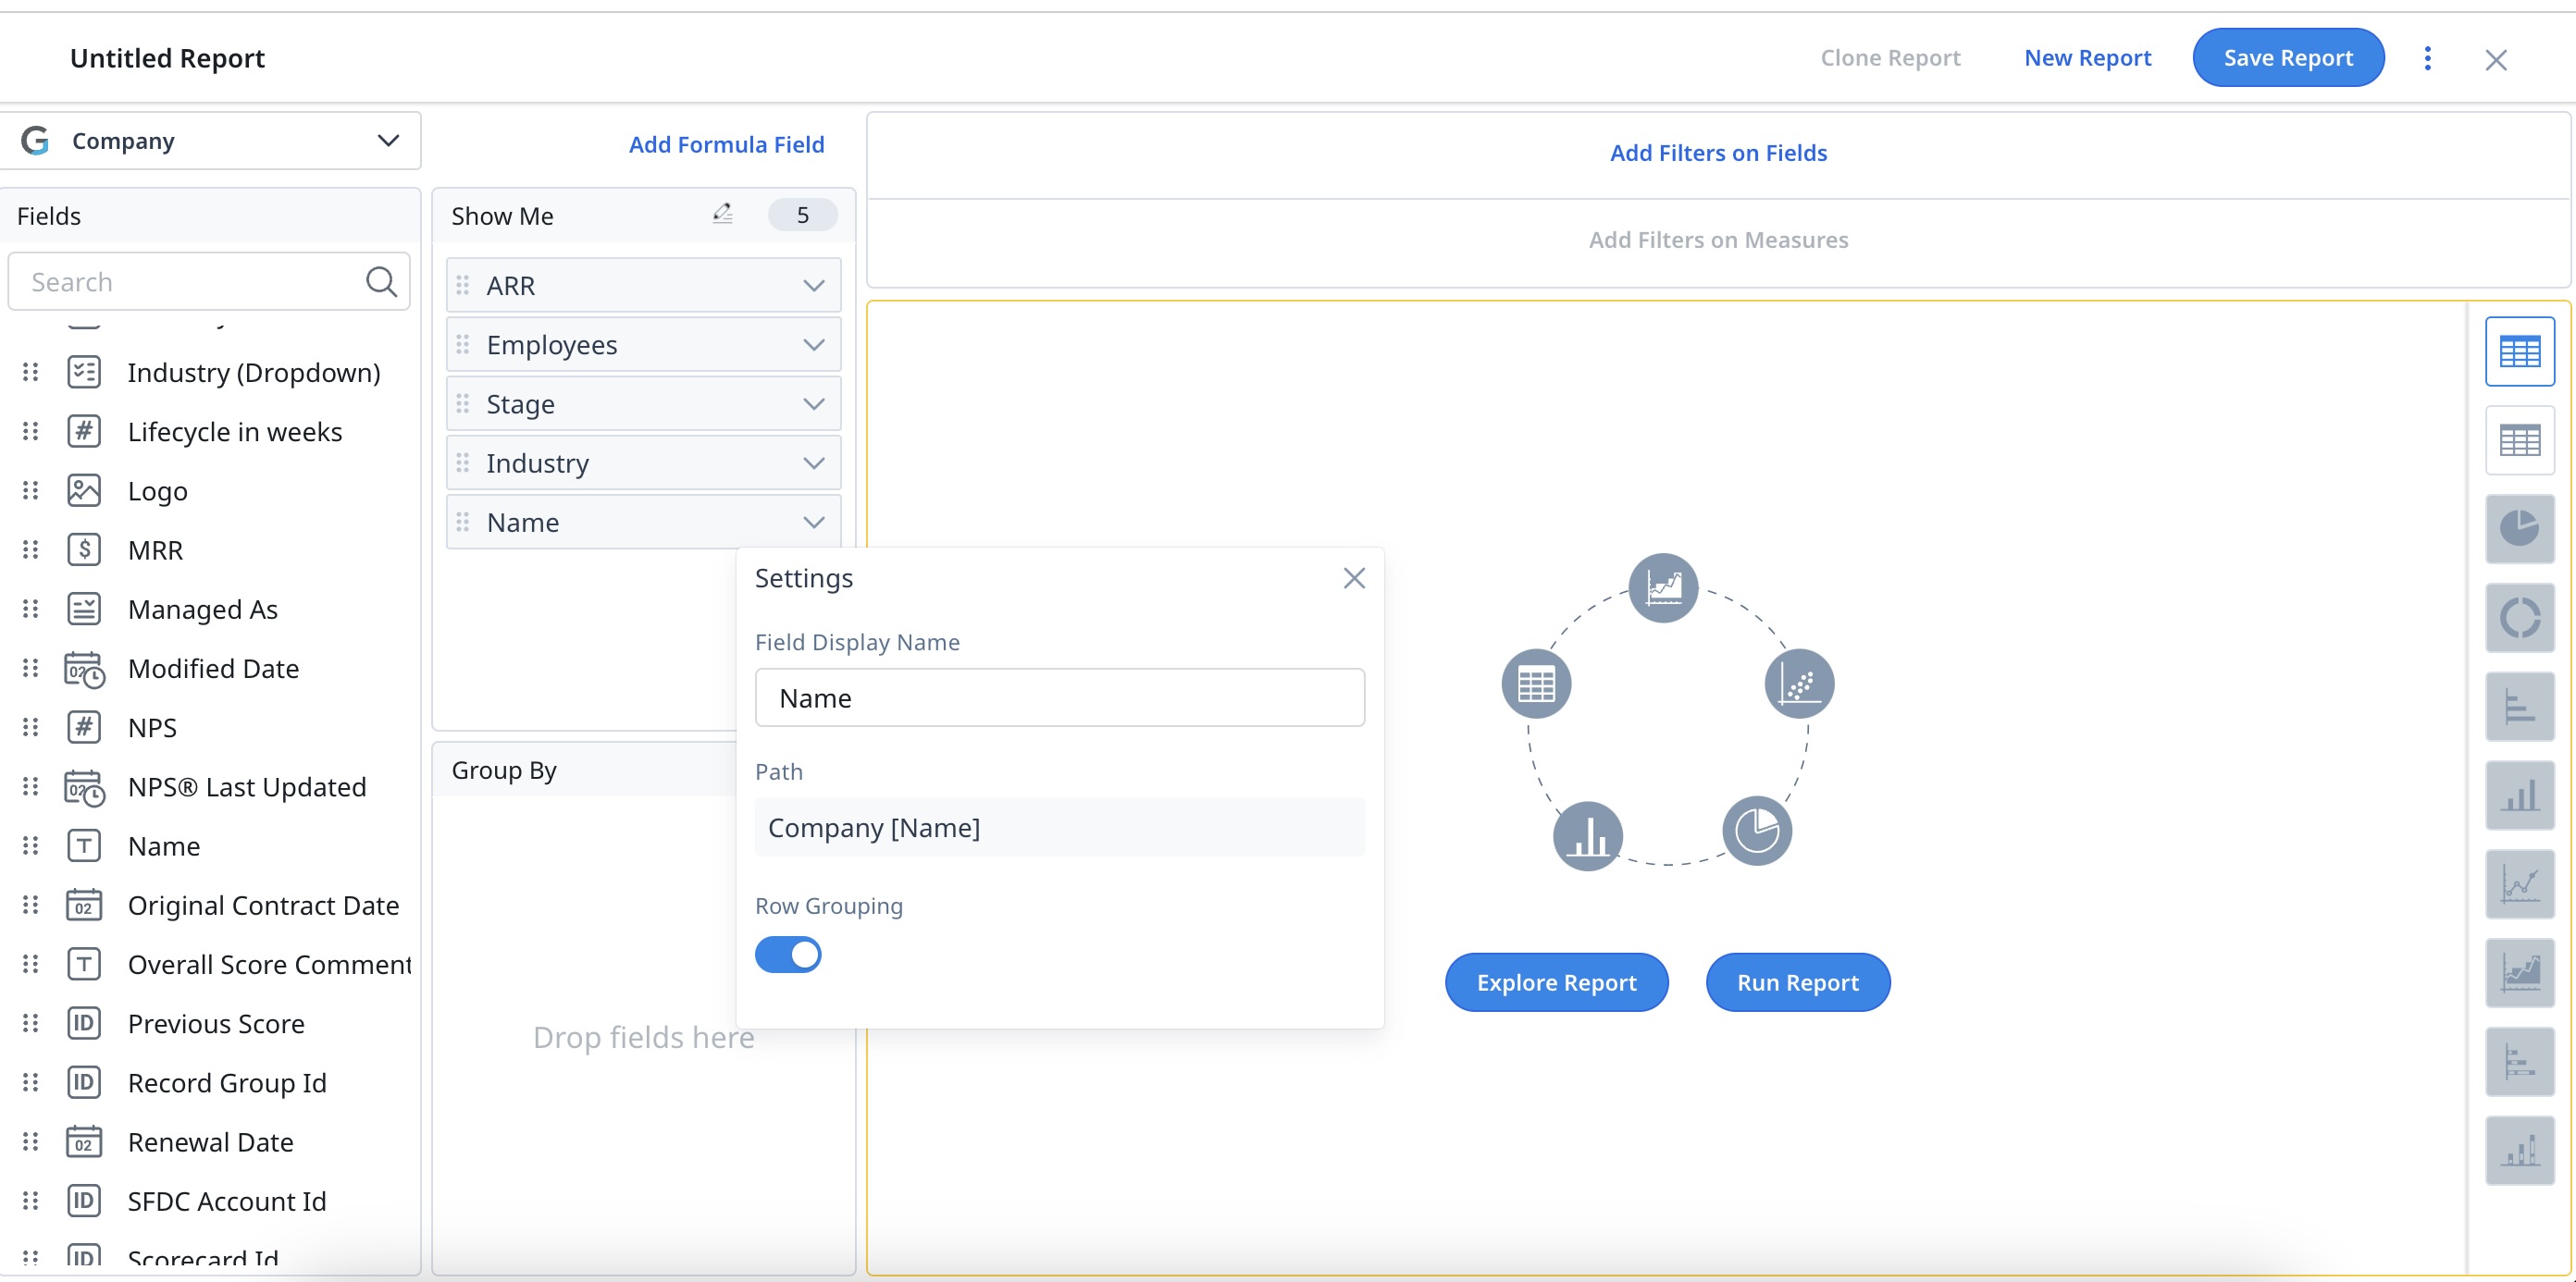
Row Grouping feature is visible when you click the gear icon on the dimension type fields added to Show me and Group By.
You can enable Row Grouping on the following dimension data types:
- String
- Boolean
- Picklist
- Date
To enable Row Grouping:
- Click the Settings/Gear icon on the required dimension type field.
- Turn ON the Row Grouping toggle switch.
- Click Run Report. This displays the visual hierarchy of the Company and its details grouped by Stage Name.
Expand and collapse the records in each group by clicking (v) and (>) icons respectively.
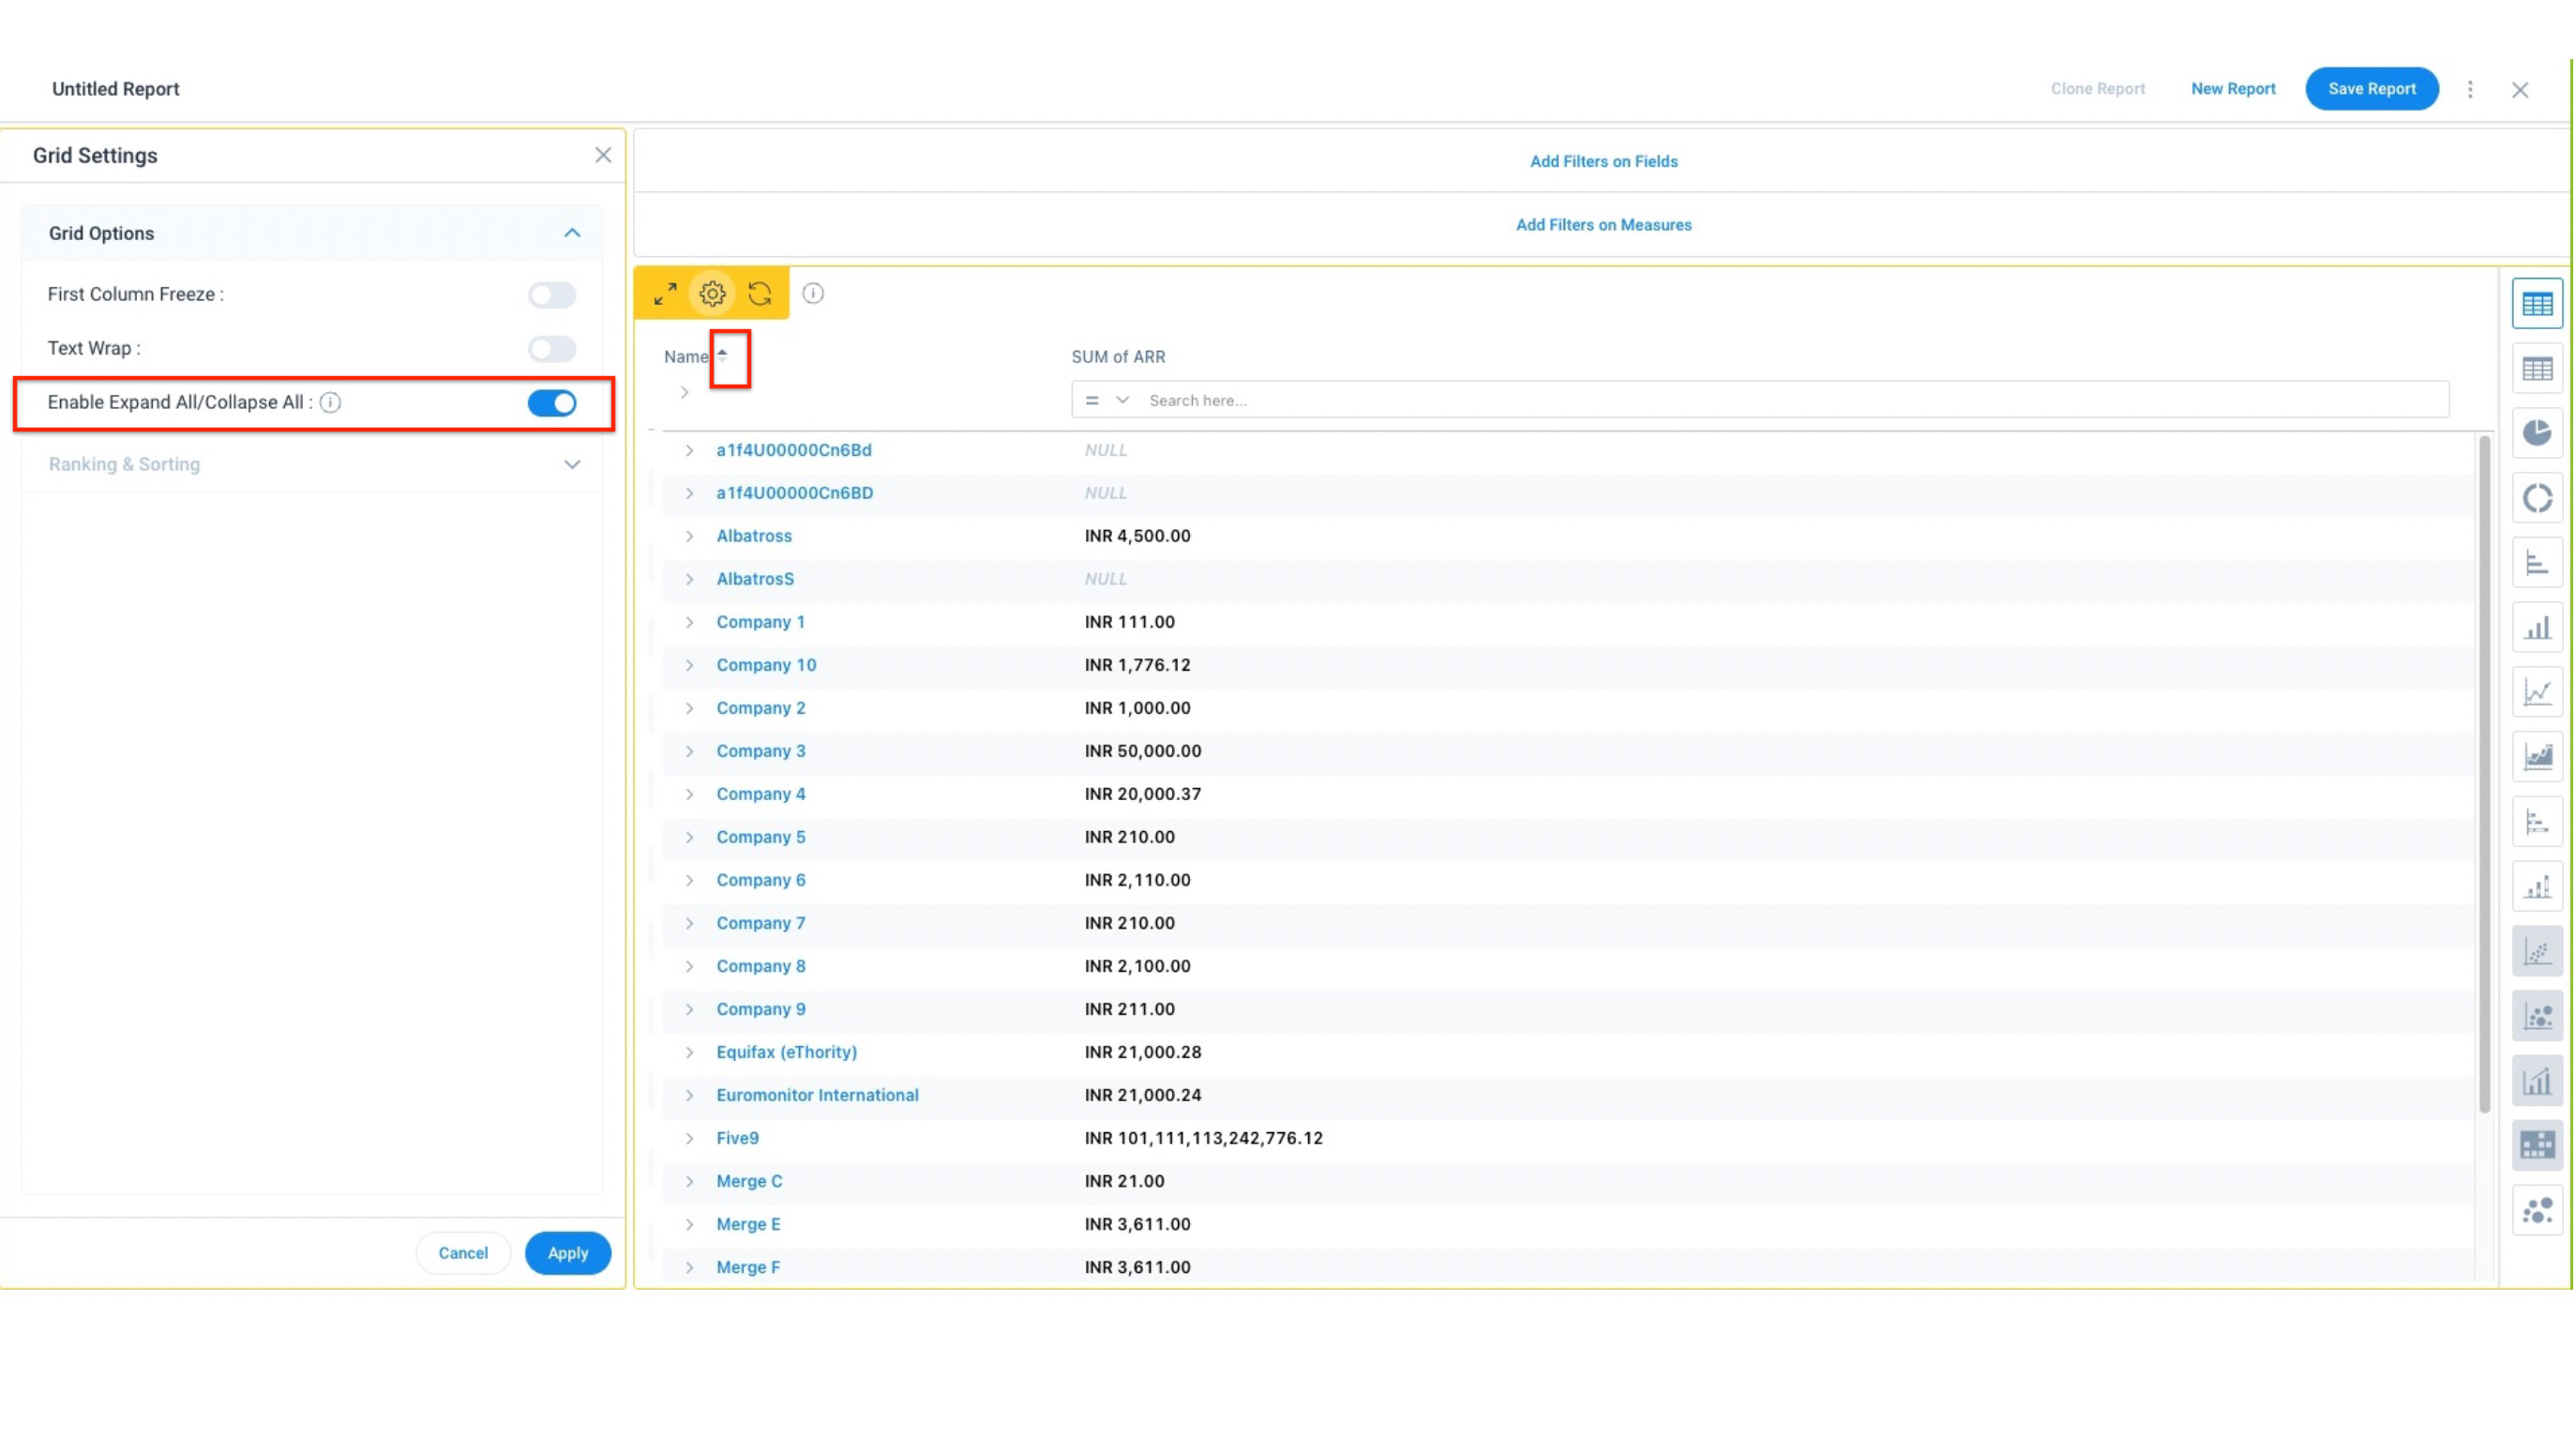
You can also expand or collapse all records at once. Click the Settings icon and turn ON the Enable Expand All/Collapse All toggle. You can now click the Expand icon to expand all records at once.
Note: Turning this option ON may lead to a reduced number of records displayed on screen.
Notes:
- When you export the Row Grouped tables, you will get the data as a flat tabular report.
- The aggregations for Row Grouped reports are customizable for aggregated reports.
Limitations:
- You can apply row grouping only on one field at a time. Assume, you have applied row grouping on Field 1, and if you try applying again on Field 2, the row grouping applied on Field 1 is automatically disabled.
- Once you enable row grouping, the pivot is auto-disabled.
- Row grouped reports are not visible in Sally and Journey Orchestrator.
Apply Pivot
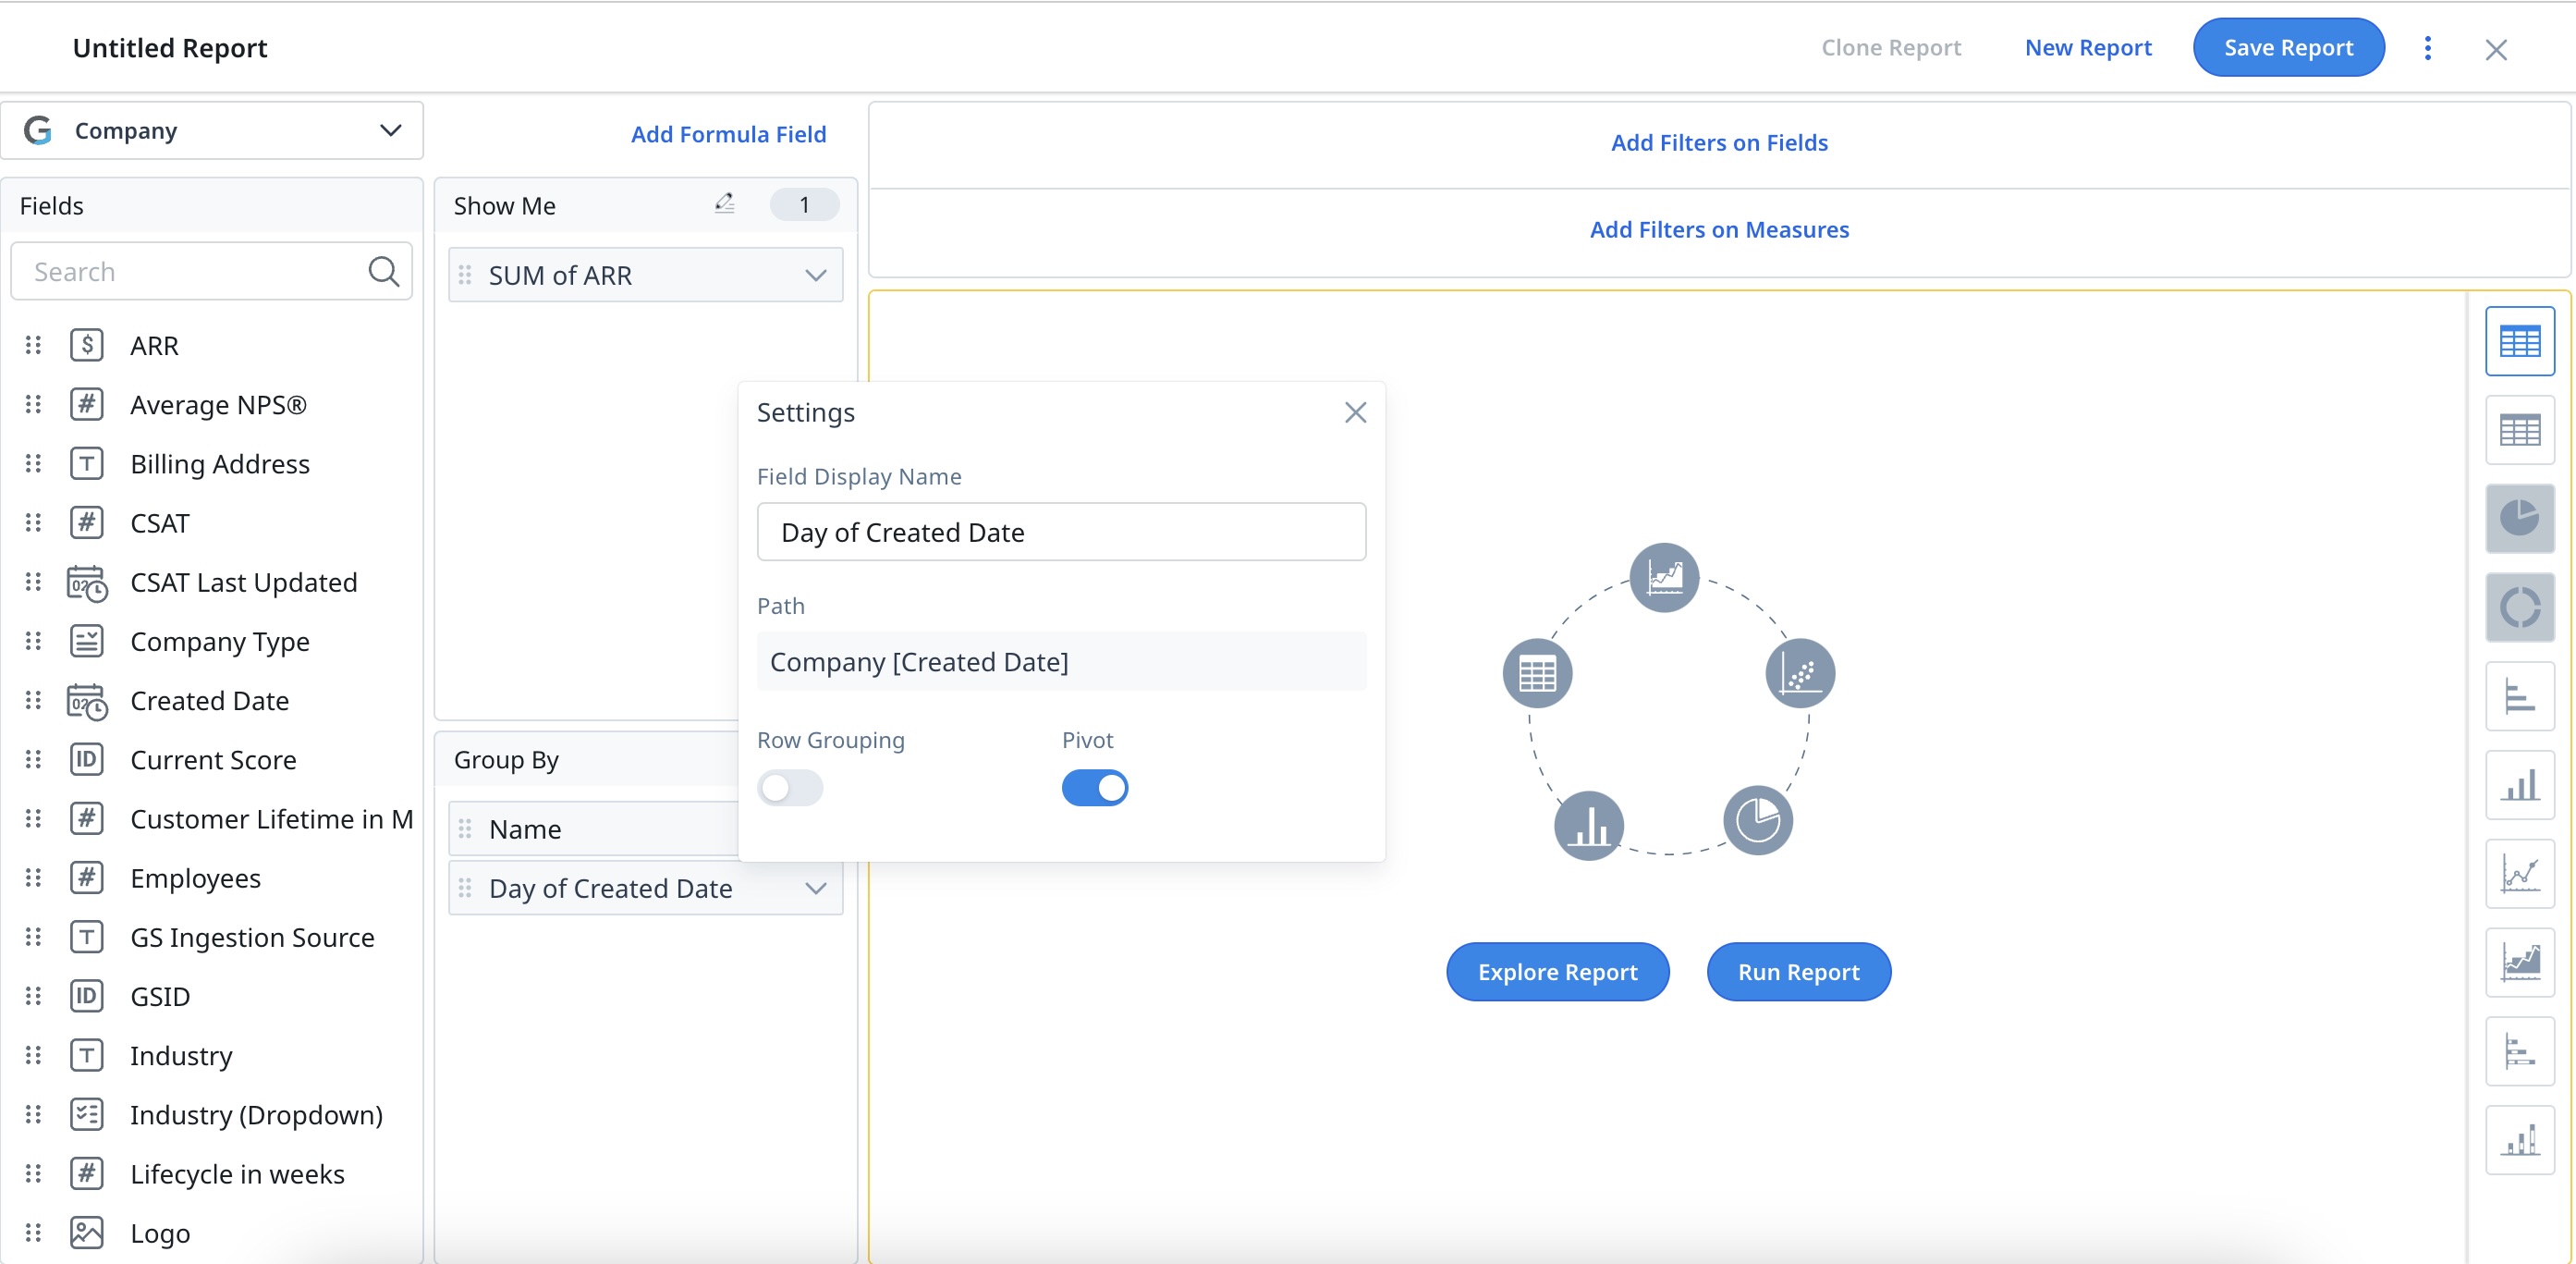
Pivot feature is visible when you click the gear icon on the Group By fields, and you can see this option only when you have a minimum of two fields in the Group By section. The Pivot can be applied only on one field at a time. You can pivot reports on the entire dataset from the server-side. There is no row limit for pivoted reports.
Note: The maximum number of pivoted columns visible in a report is 53.
Example Business Use Case: For example, when you create a report on Company, and Pivot by Created Date. You will see that the Renewal Date changes from Rows to Columns.
Limitations:
- Ranking cannot be applied on pivoted reports.
- Pivot and Row Grouping cannot be applied at the same time.
- Pivoted columns are generated on the fly, it is not possible to honor the column width preferences set by the admin/user.
Export Pivot Reports
You can export reports even when the pivot is being applied to a column with a maximum of 53 unique fields. Click the Download Data option to export a report. If a pivot is applied on a column with more than 53 unique fields, you can choose to either export a pivot report with the first 53 fields or download a flat report to retrieve the raw data.
You can also use the Share Report option to share a pivot Excel report.
Notes:
- You can download a pivot report only if you select the Share now option.
- If a pivot is applied to a report with more than 53 unique records, by default a flat report with raw data is downloaded.
Configure Drill Downs
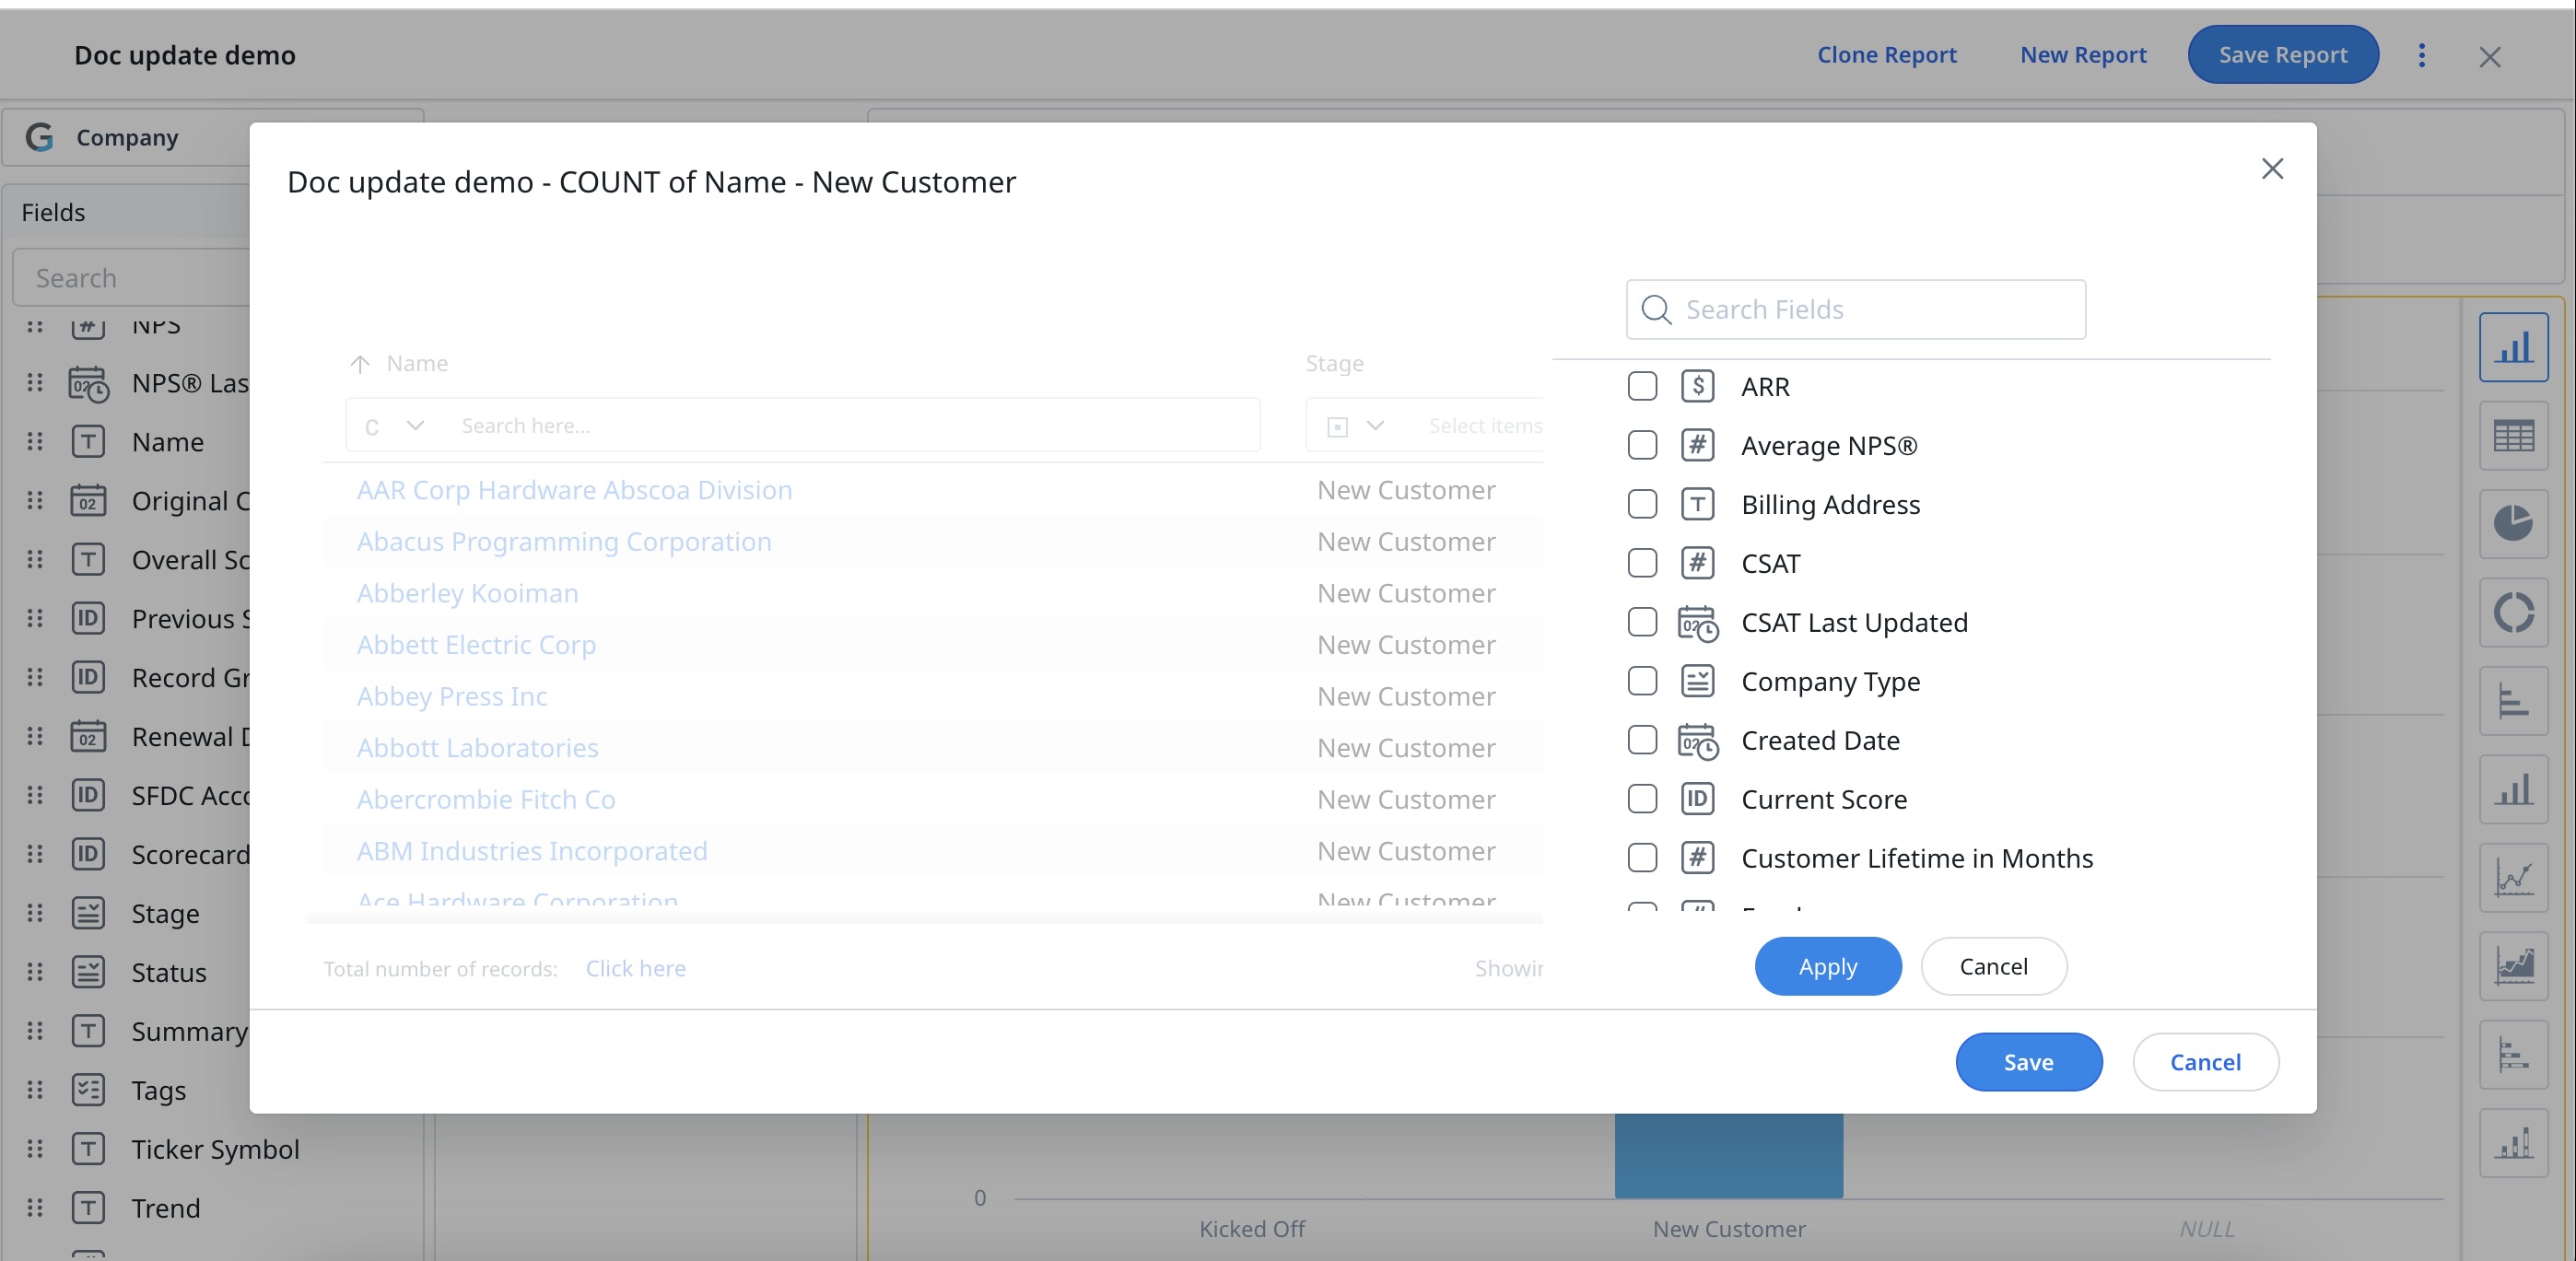
To Configure Drill down:
- Click on any point in a graph or widget to see a drill down of the data associated with that data point.
- Once you are in the drill down page, click the + icon on the top right to see the list of available fields.
- You can add or remove the fields from the table. Select the required fields to add.
Notes:- You can also restore the report to its original state, by clicking the Reset button.
- You can also rename the drill down fields, by clicking the Pencil icon.
- Click Apply after you make your selections.
- Click Run to view the report.
The drill down table displays your selections when users click on a data point on the graph. You can change the column order in the drill down reports and can be retained after saving the report.
If there are too many records in the drill down table, use the pagination tool in the bottom right corner of the screen to navigate through different pages and view multiple records, in a set of 50, 100 or 200 on a single page, based on your selection.
You can download an Excel sheet report using the download icon. To save the changes you made, click Save.
Configure Ranking and Sorting
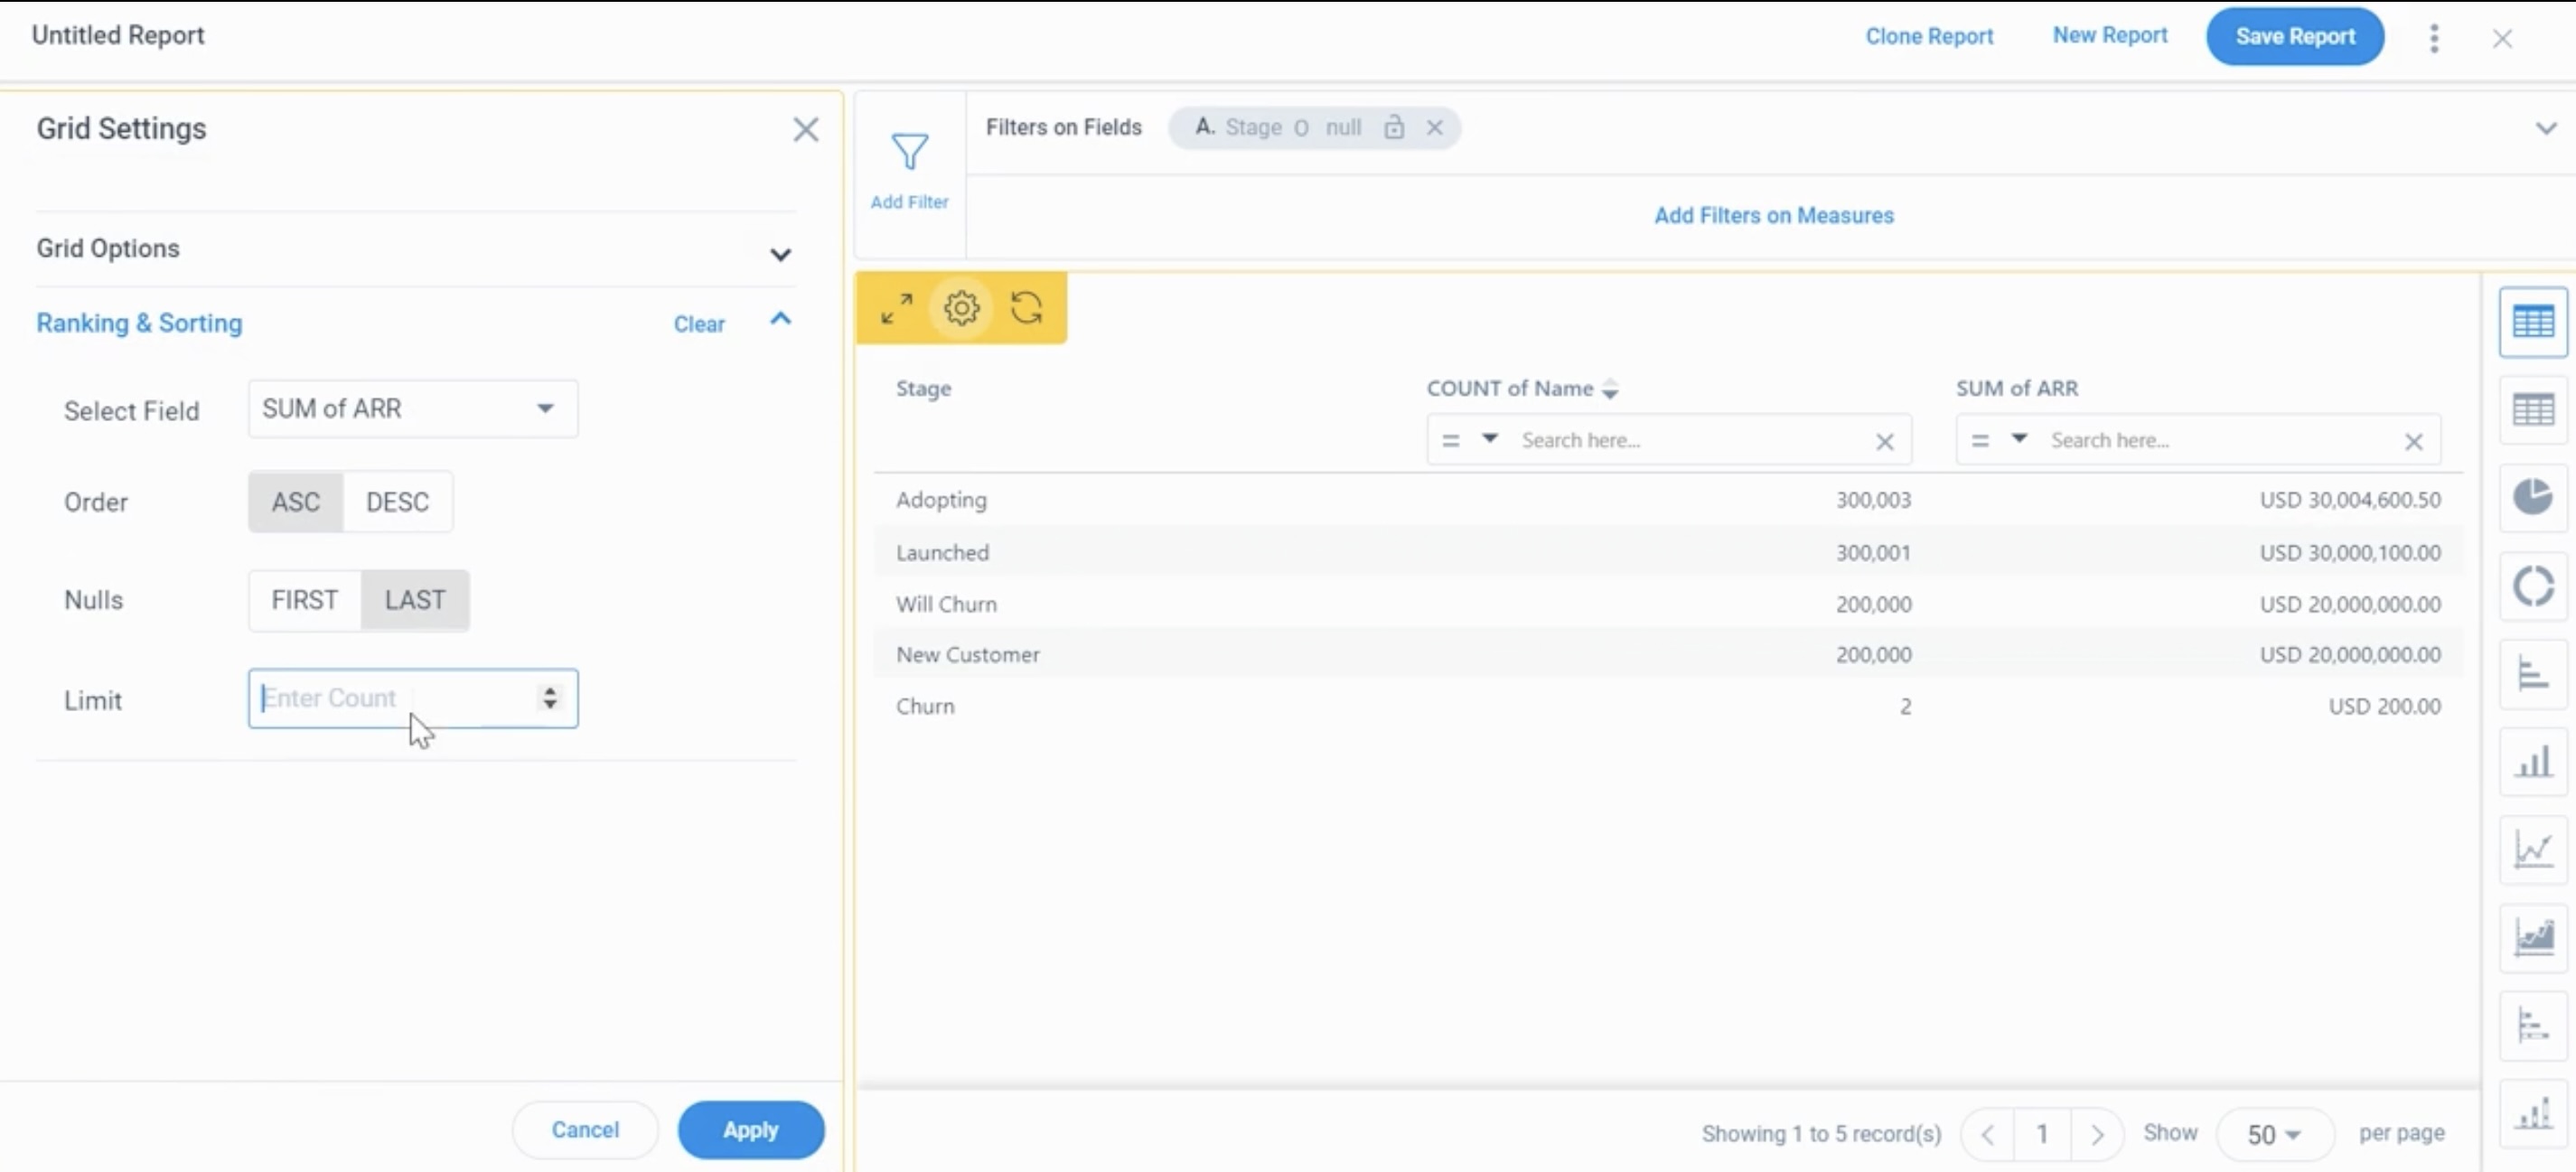
Sorting is applicable for all charts. Ranking is relevant if you only want to include Top (ASC) x or Bottom (DESC) x records based on a particular field in the report.
Note: You can also sort the order for Tabular reports, even after applying Ranking.
To configure Ranking:
- Click the Settings/Gear icon.
- Select Ranking & Sorting.
- From the Select Field dropdown list, select the required field to rank your report.
- Select Order, either Ascending or Descending.
- Select where to include Nulls, either First or Last.
- In the Limit text box, enter the ranking limit.
- Click Apply.
To remove the applied Ranking:
- Click the Settings/Gear icon.
- Click Clear on the Ranking & Sorting option.
- Click Apply.
