Scorecard Widgets Overview
Gainsight NXT
This document explains the tools and options available for admins while configuring Scorecard Widgets feature.
Overview
| IMPORTANT: Starting with the 6.32 release, Visualization tab is renamed as Scorecard Widgets. The section is now available under Analytics with all report building features to make the experience more intuitive. |
Scorecard Widgets have been designed as part of the Horizon Experience to be intuitive and consistent with other reporting features. Admins can configure Scorecard Widgets by navigating to Administration > Analytics > Scorecard Widgets. Both admins and CSMs can add Scorecard Widgets to Gainsight Home layouts. For more information on how to add Scorecard widgets as an admin or CSM, refer to the Configure Gainsight Home and Gainsight Home for CSMs links respectively under Additional Resources.
Admins can take the following actions on the Scorecard Widgets screen.
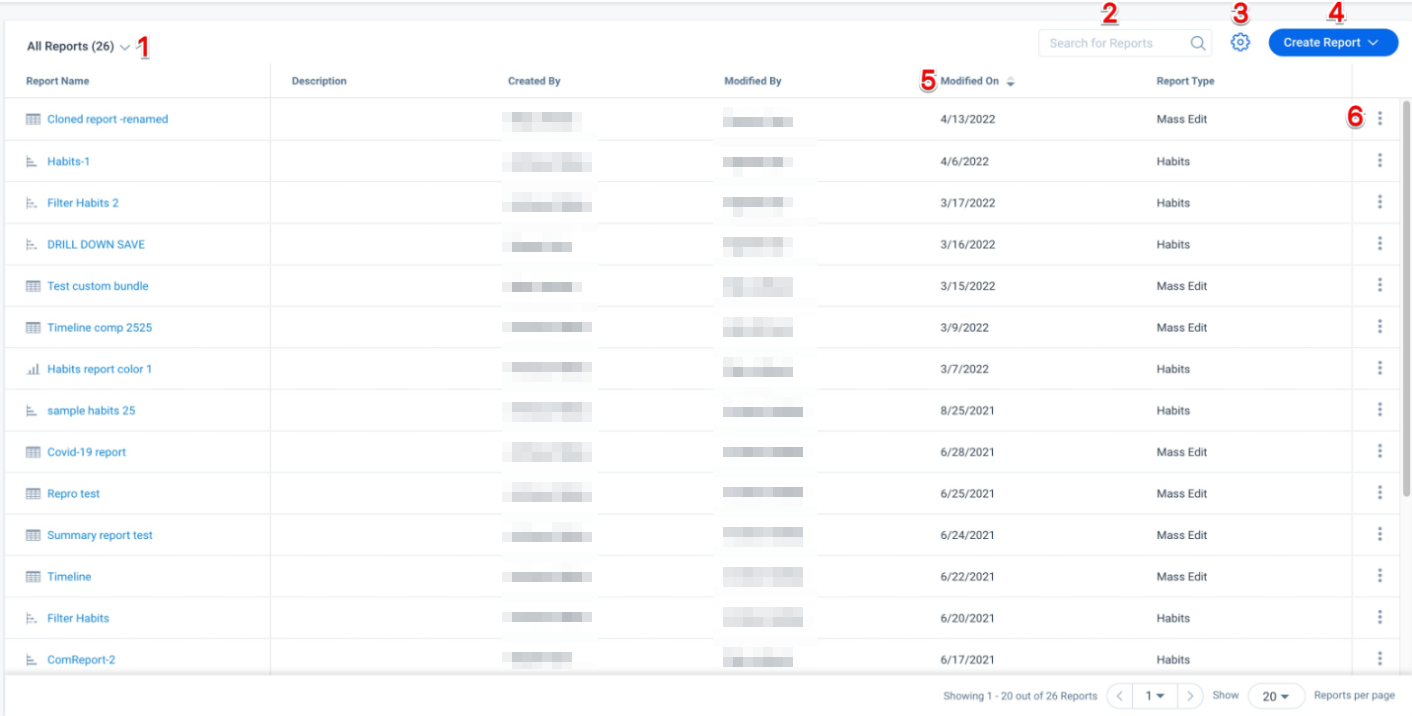
- Report Type Filter: Click here to display only Habits reports, Mass Edit reports, or All Reports.
- Search for Reports: Click here to search for reports based on the name field.
- Select Display Columns: Click here to check the columns you wish to display on the Scorecard Widgets screen.
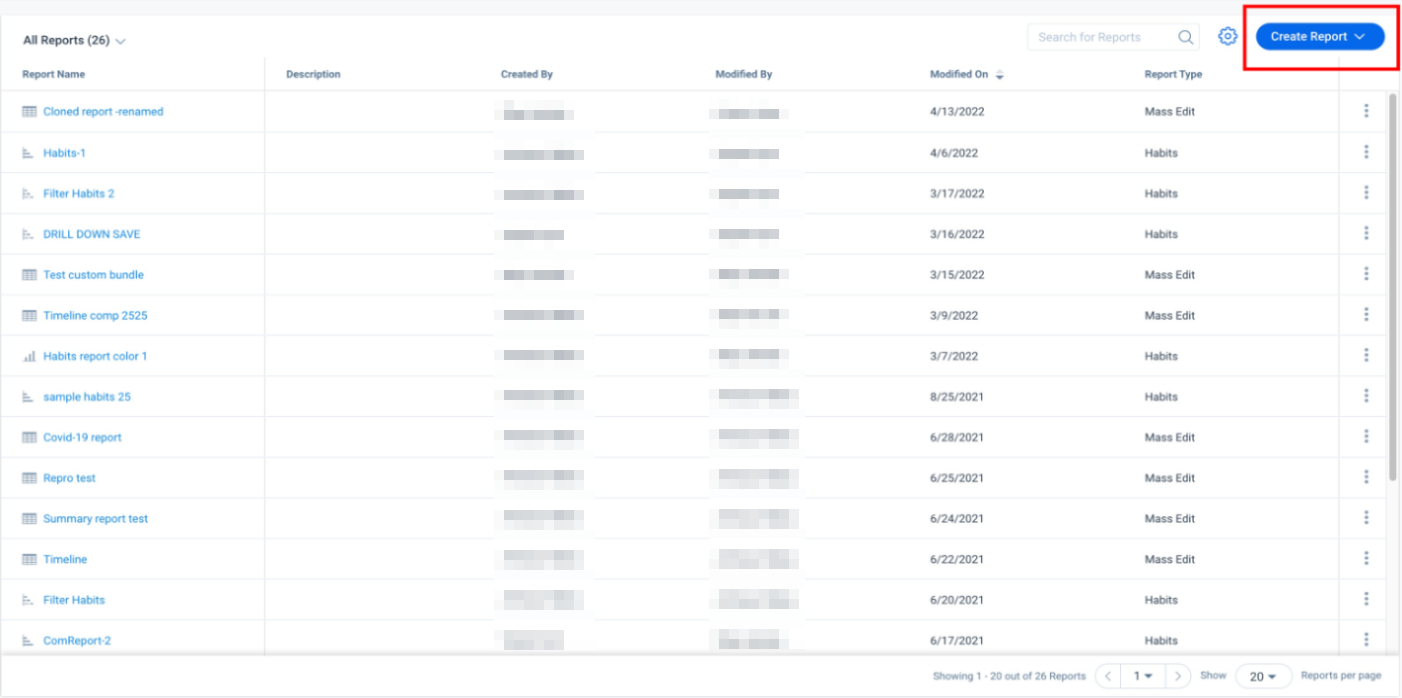
- Create Report Button: Click here to select either Habits or Mass Edit and begin creating a report of that type.
- Sort: You can click certain columns to sort the Scorecard Widgets screen based on its contents. You can also click and drag columns to reposition them.
- Report Options: Click here to select options to Edit, Rename, or Delete a report.
Limitation
The following limitation exist in Scorecard Widgets in comparison to Report Builder:
- The Ranking and Sorting feature under Grid Settings is not available in Mass Edit and Habits reports.
Create Scorecard Widgets
To create a Scorecard Widget:
- Navigate to Administration > Analytics.
- Click on Scorecard Widgets. The Scorecard Widgets screen is displayed.
- Select either Company or Relationship from the entity drop-down field depending on the type of Scorecard Widget you want to create.
- Click Create Report.
- Select to create either a Habits or Mass Edit report. For more information on configuring these report types, refer to Habits Report or Mass Edit Report respectively.
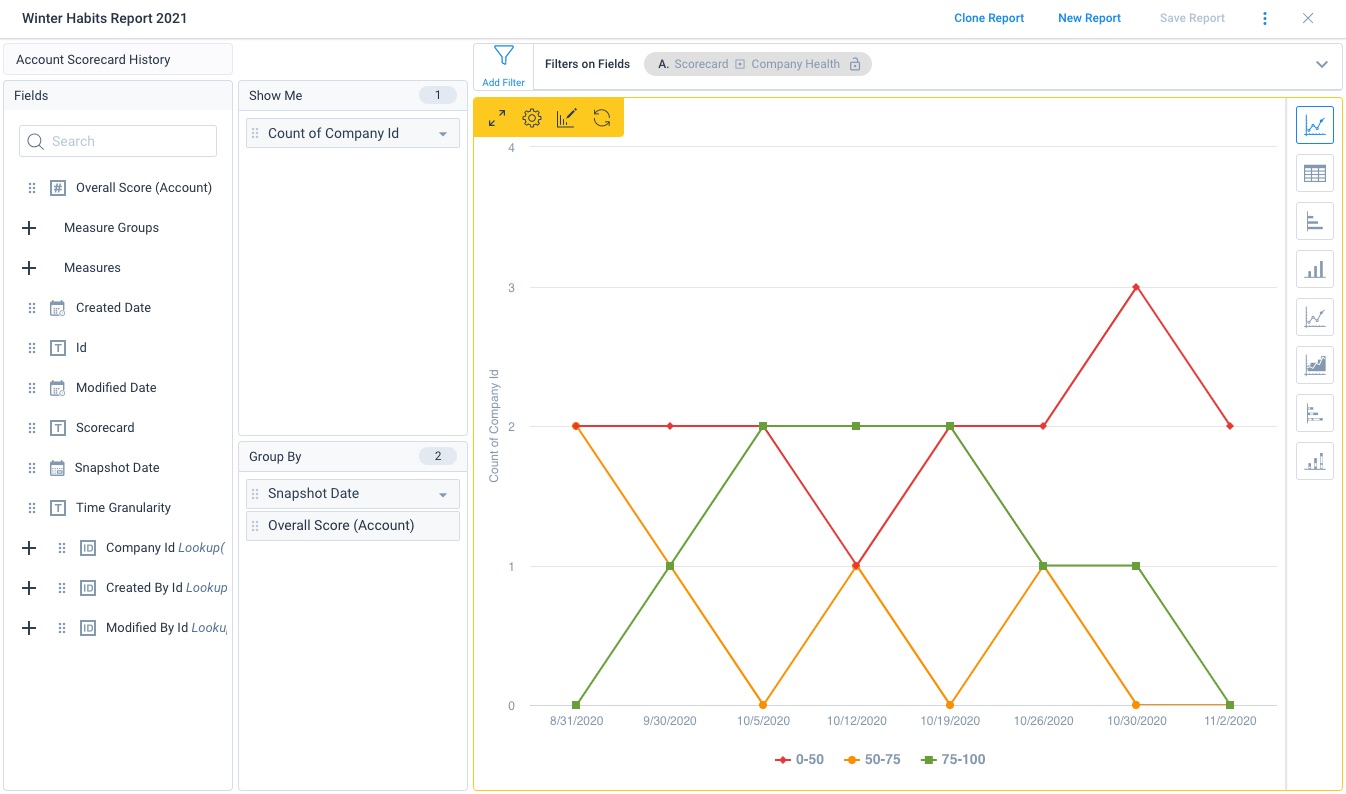
Habits Report
A Scorecard Habits report allows you to review your customer’s health scores. This report displays score trends with reference to your configured grading scheme.
Take the following steps to configure a Scorecard Habits report:
- Follow the steps presented under Create Scorecard Widgets.
Note: When you select the Habits report, the following fields are selected by default.- Show me: Count of company Id
- By: Snapshot Date
- Filter: Results are filtered to display any one scorecard.
- Drag and drop the company field you wish to display from the Fields column to the Show Me column. Only one field can be added to the Show Me column at a time. For more information on selecting fields or the Show Me column, refer to Select Object and Fields or Show Me, under Additional Resources.
- Select an aggregation option for the field you included in the Show Me column. For more information on aggregation options, refer to Aggregations under Additional Resources.
- Drag and drop up to one measure or measure group score to display in the Group By section alongside the Snapshot Date field. For more information on this Group By section, refer to Group By under Additional Resources.
Note: The Snapshot Date field cannot be removed from this section. - Add any relevant filters to fields. For more information on adding filters, refer to Filters under Additional Resources.
Note: If you are filtering based on scorecards in a Habits report, you can only select scorecards from a single scheme. - Click Run Report to display the results of your scorecard query. For more information on running reports, and the options available for tabular reports, refer to Run Report under Additional Resources.
Note: You must add at least one Company field to the Show Me column, and one measure (in addition to the Snapshot Date field) to the Group By column to successfully run a report. - (Optional) Select a visualization type from the right most column to determine how you would like the data to display. For more information on visualization types, refer to Visualization Types under Additional Resources.
- Click Save Report to save your configurations. For more information on saving reports and other report options, refer to New, Save, Clone, Share Reports and Download Data under Additional Resources.
Mass Edit Report
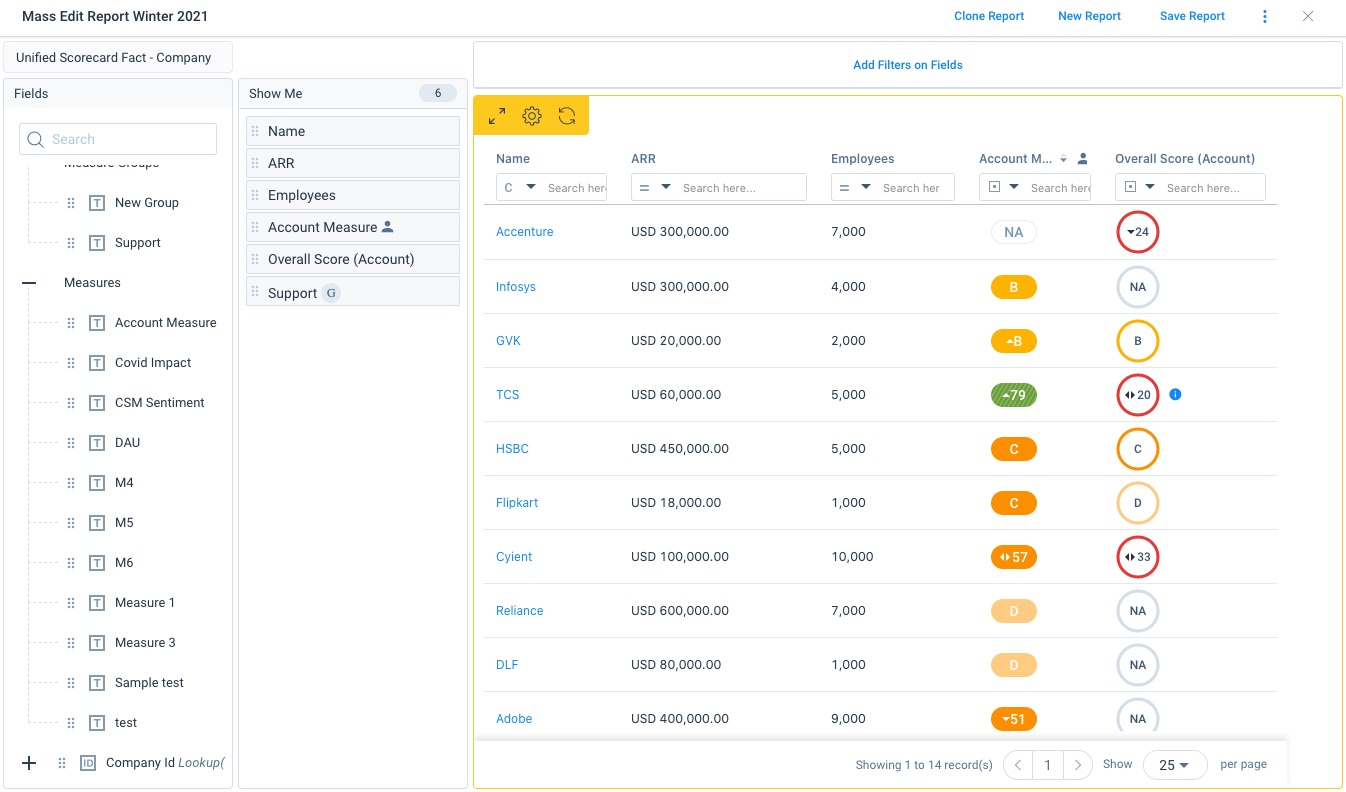
A Scorecard Mass Edit report allows users to view the health scores of multiple Companies or Relationships at once in a tabular format. Users can also edit the scores and add notes through the report, as well as embed the report in a Dashboard. A Scorecard Mass Edit report is built on the Unified Fact object.
Take the following steps to configure a Scorecard Mass Edit report:
- Follow the steps presented under Create Scorecard Widgets.
- Drag and drop the scorecard measures, groups, and company or relationship fields you wish to display from the Fields column to the Show Me column. For more information on selecting fields or the Show Me column, refer to Select Object and Fields or Show Me under Additional Resources.
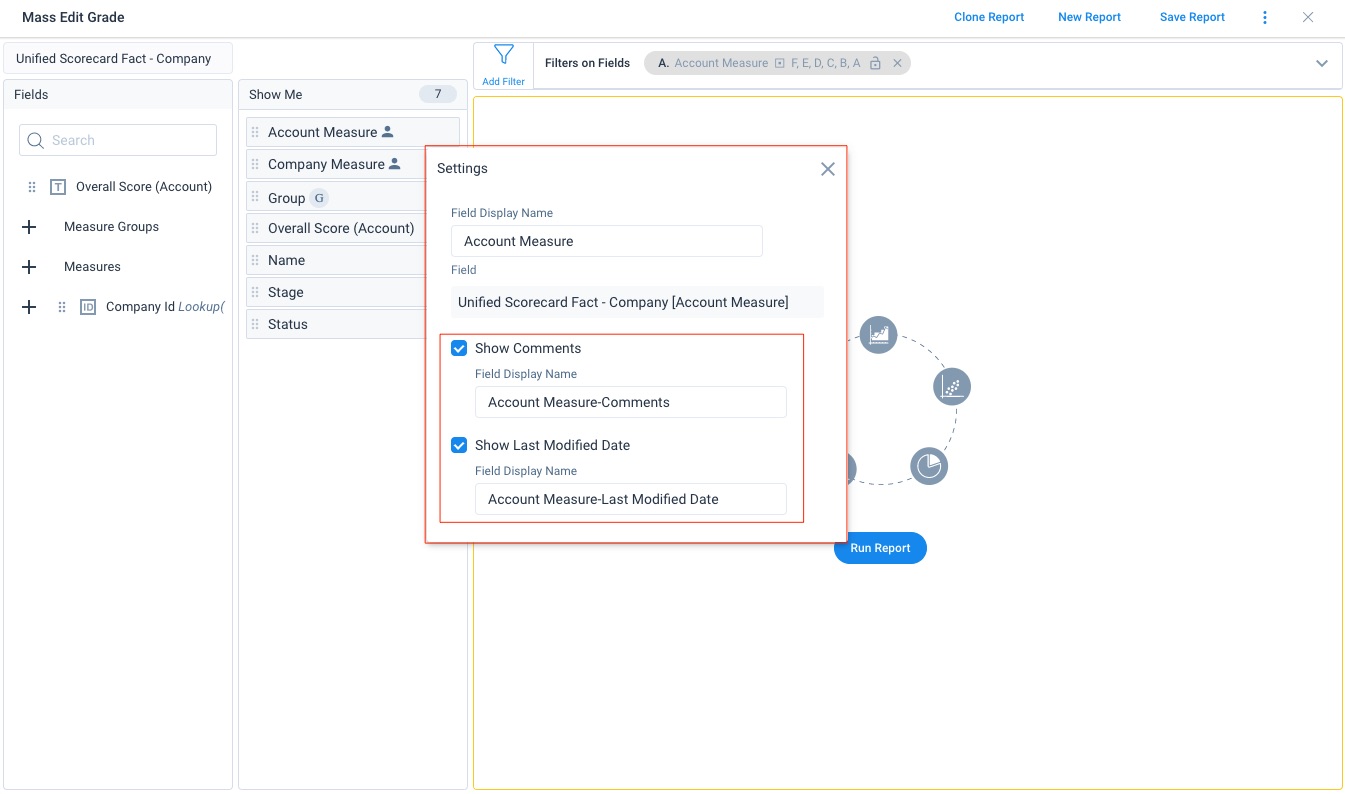
Note: Scorecard Mass Edit reports do not have a Group By section, and only the Tabular visualization type is supported. - (Optional) Select to display the Comments or the Last Modified Date field for any measure in the Show Me column, by clicking the measure’s gear icon and checking the Show Comments or Show Last Modified Date checkbox. The selected fields will display next to the measure score as a separate column. You can select both checkboxes for each measure.
- (Optional) Click to drag and resize column widths where relevant. You can freeze these adjustments by saving the report. For more information on freezing column widths, refer to Mass Edit Report Features.
- Add any relevant filters to fields or measures. For more information on adding filters, refer to Filters under Additional Resources. For more information on filter options specifically available for Scorecard Mass Edit reports refer to Inline Filters.
- Click Run Report to display the results of your scorecard query. For more information on running reports, and the options available for tabular reports, refer to Run Report under Additional Resources.
Note: You must add at least one measure and at least one company or relationship field to successfully run a report. - (Optional) Update scores and add notes where relevant. For more information on these actions, refer to Update Scores and Add Notes.
- Click Save Report to save your configurations. For more information on saving reports and other report options, refer to New, Save, Clone, Share Reports and Download Data under Additional Resources.
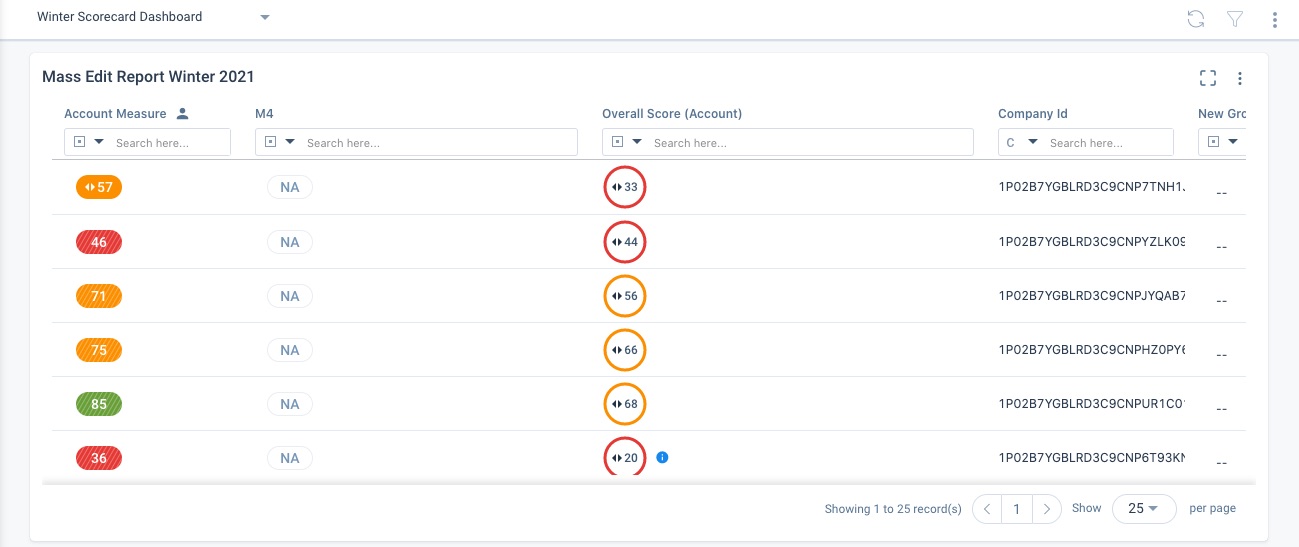
Mass Edit Report Features
Scorecard Mass Edit Reports include the following visual elements to make the displayed data more intuitive and easier to interpret:
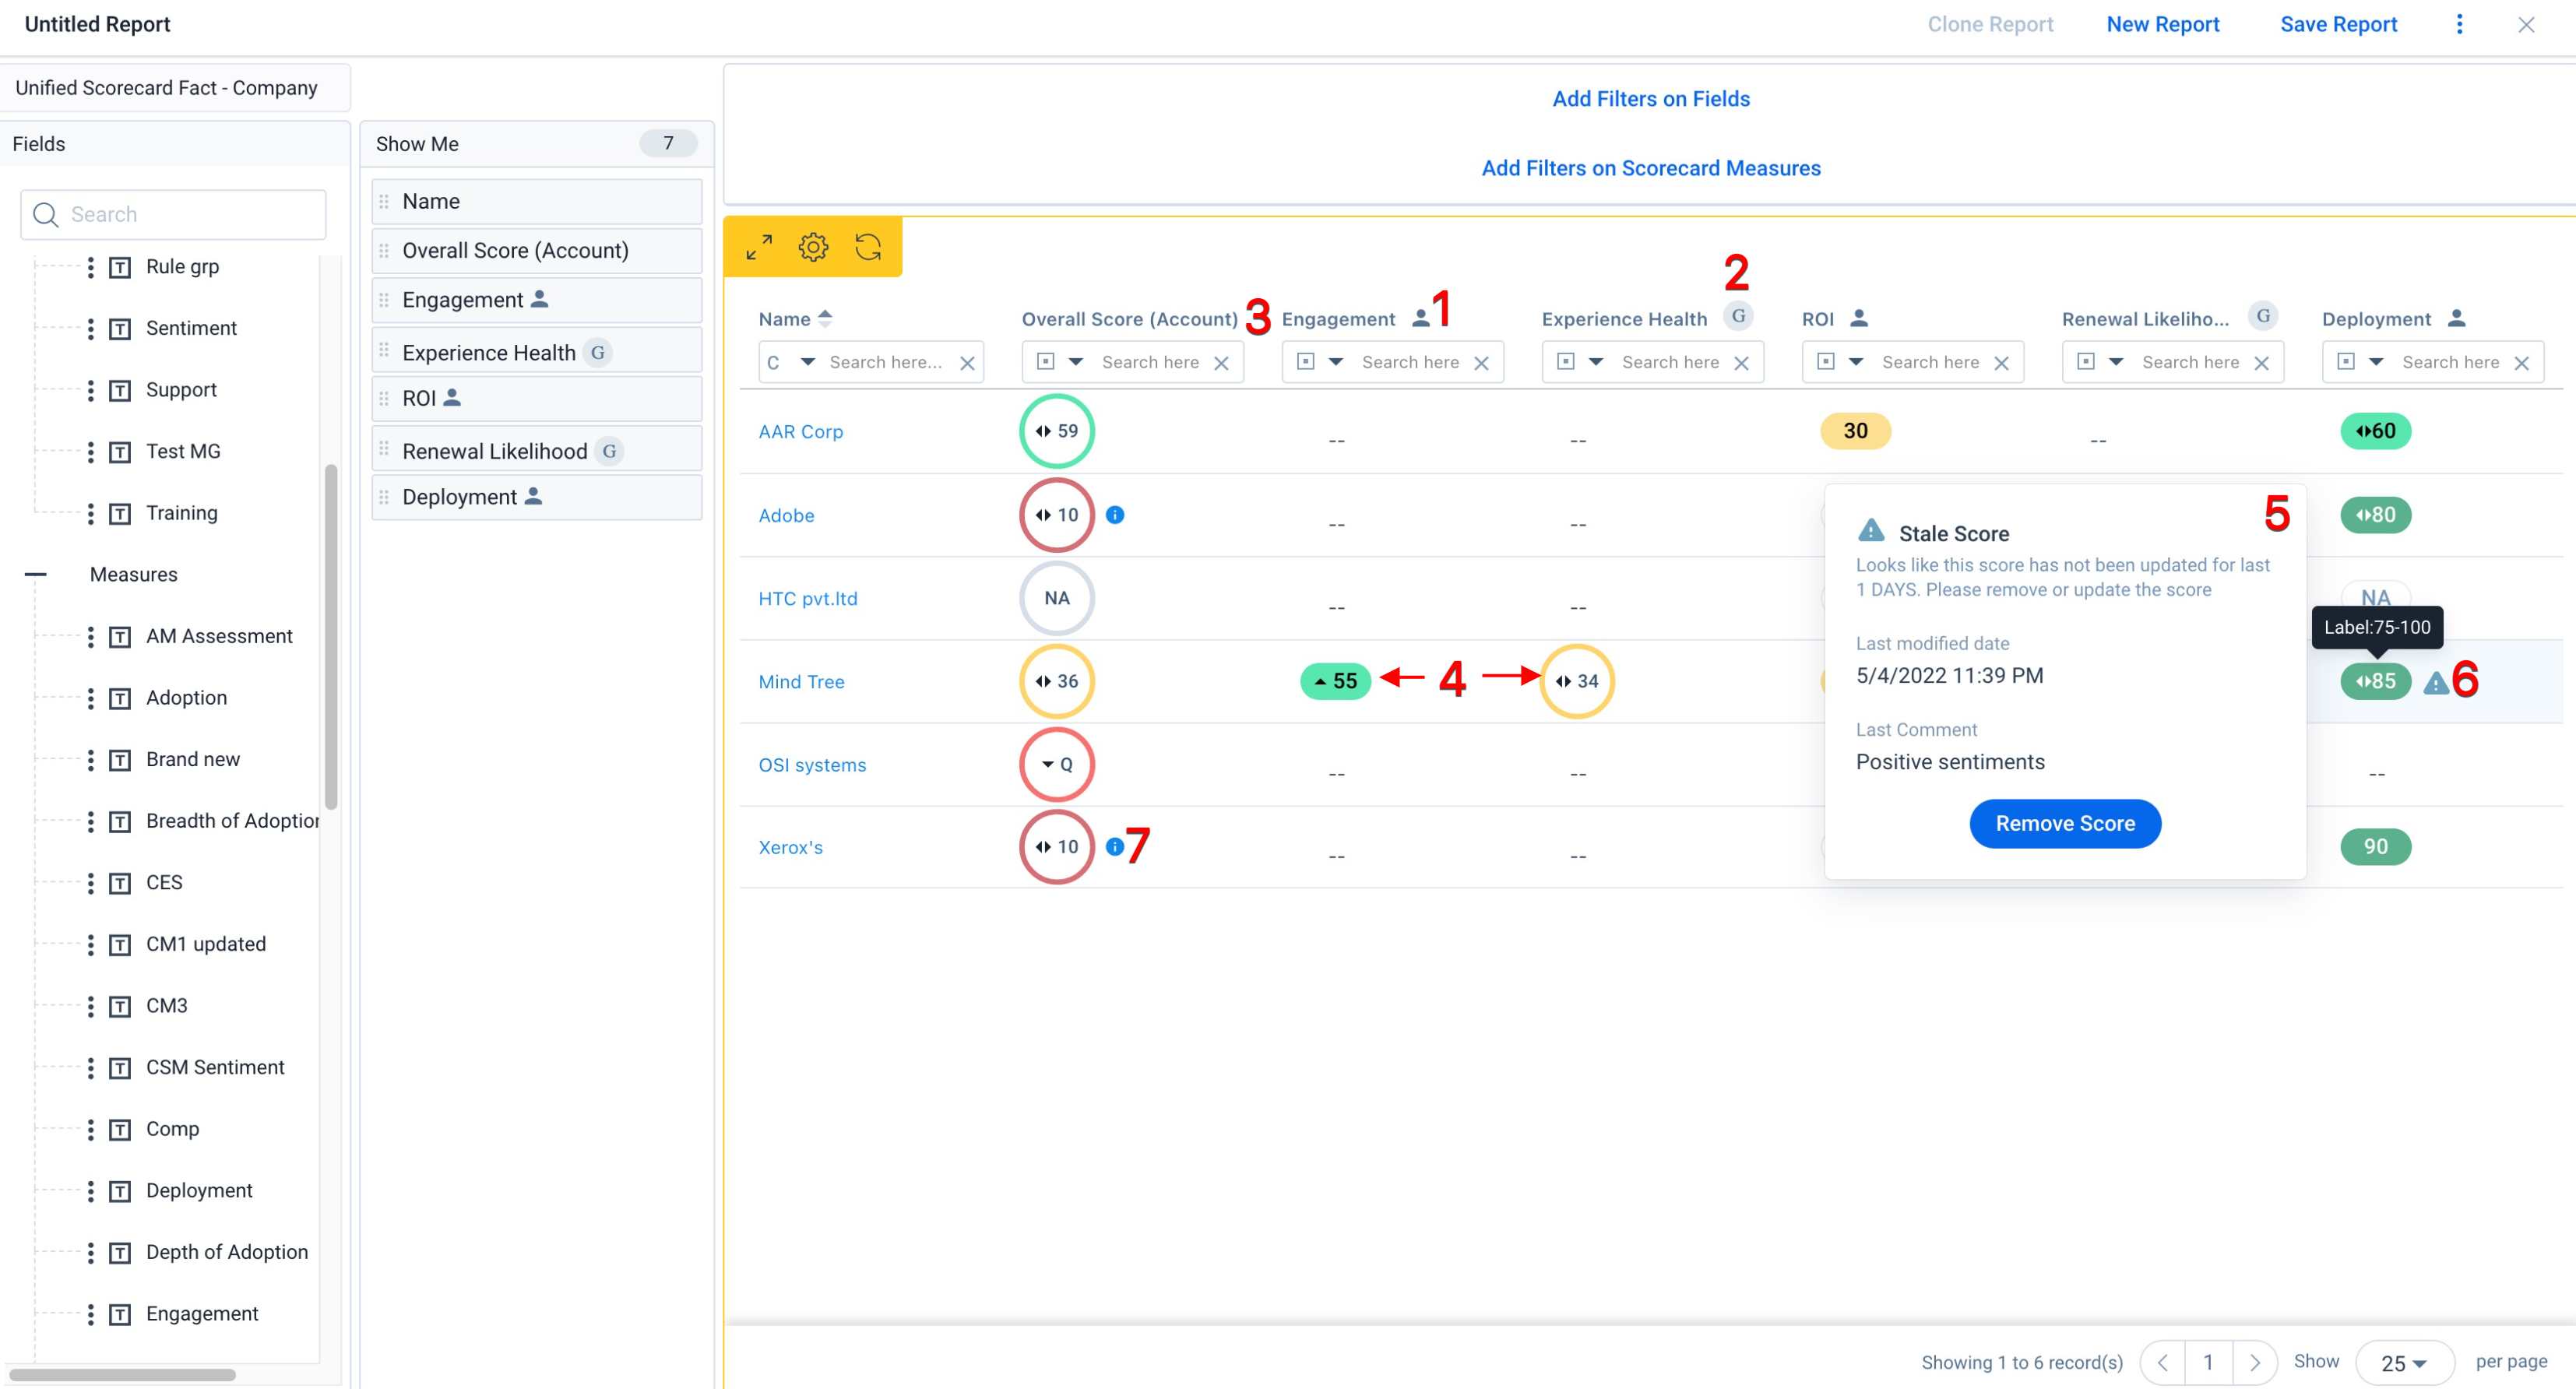
- Manual Measure icon: This icon displays at the top of the column for each manual measure to distinguish them from automatic measures.
- Group Measure icon: This icon displays at the top of the column for each measure group to distinguish them from individual measures.
- Frozen Column Widths: You can click to drag and resize the width of any column. You can then freeze these adjustments by saving the report. The frozen adjustments are retained if the report is refreshed or reloaded.
- Distinct Measure and Group score icons: Mass Edit reports display measure scores as pill shaped icons and measure group scores as circle icons to make them easy to distinguish.
- Hover Functionality: You can hover over any measure or group measure score to quickly view the Last Modified Date and Last Comment fields.
- Highlight for Stale Scores: Stale scores are highlighted with diagonal lines across the score’s icon.
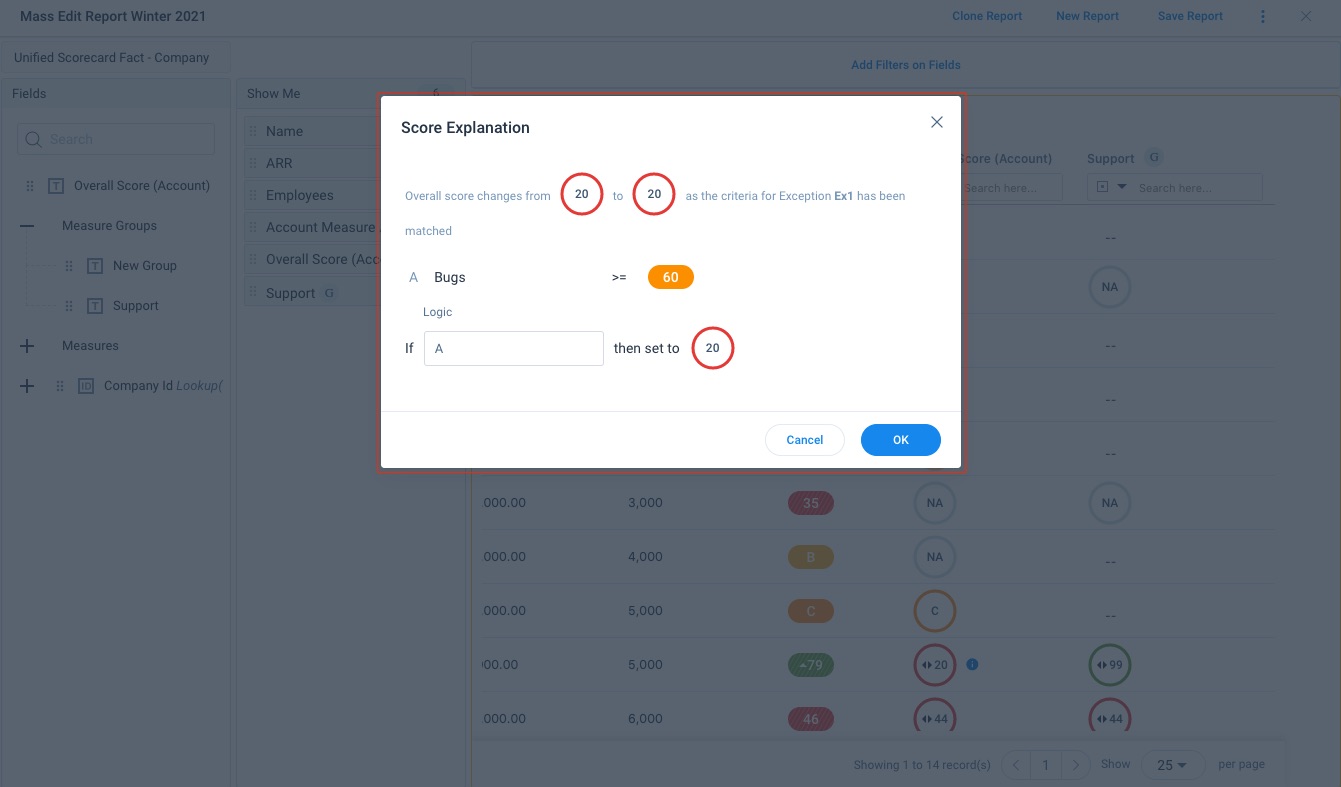
- Group Exception icon: This icon displays next any measure group with an exception. You can hover over this icon to display more information about the exception.
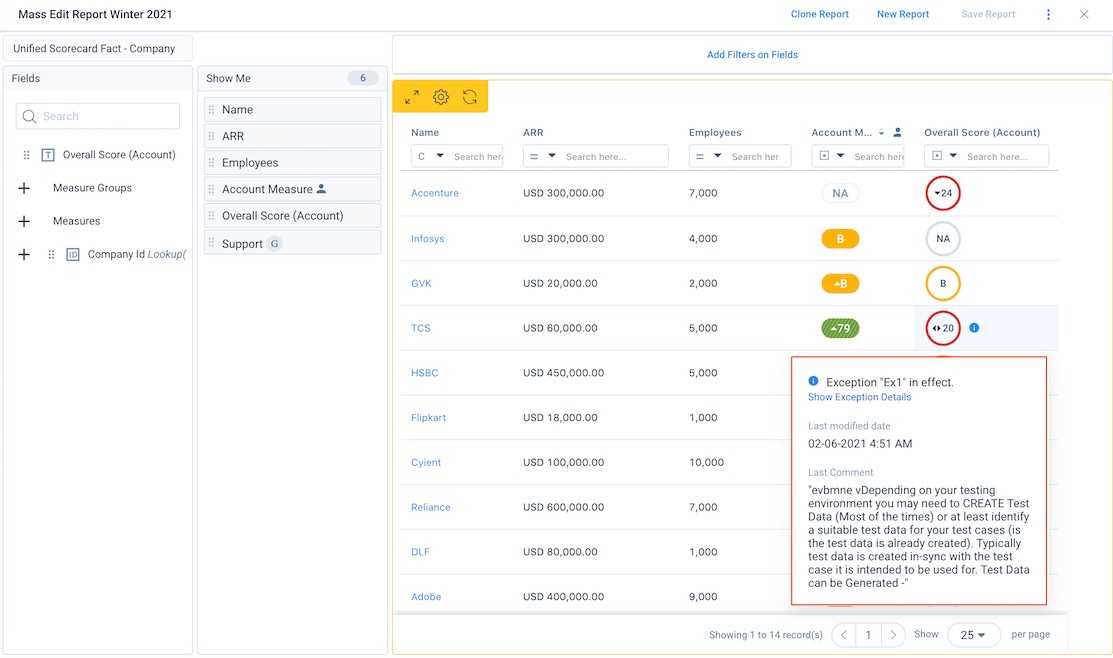
Click Show Exception Details to open the Score Explanation window and see more information about the exception.
Inline Filters
The following inline filter options are available specifically for Scorecard Mass Edit reports:
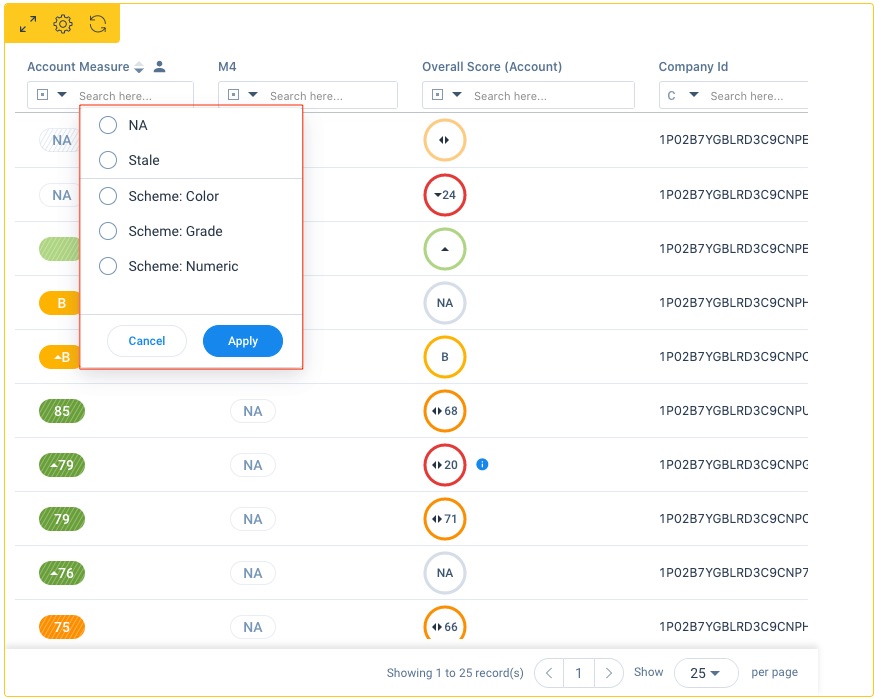
- NA: Select to filter for only scores with the value of NA.
- Stale: Select to filter for only stale scores. This option is only available for measure score columns.
- Exception in Effect: Select to filter for only measure groups that have exceptions applied. This option is only available for measure group columns.
- Scheme: Color: Select to filter for scores of a specific color. You can select more than one color.
- Scheme: Grade: Select to filter for scores of a specific grade. You can select more than one grade.
- Scheme: Numeric: Select to filter for scores within specific numerical ranges. You can select more than one number range.
Update Scores and Add Notes
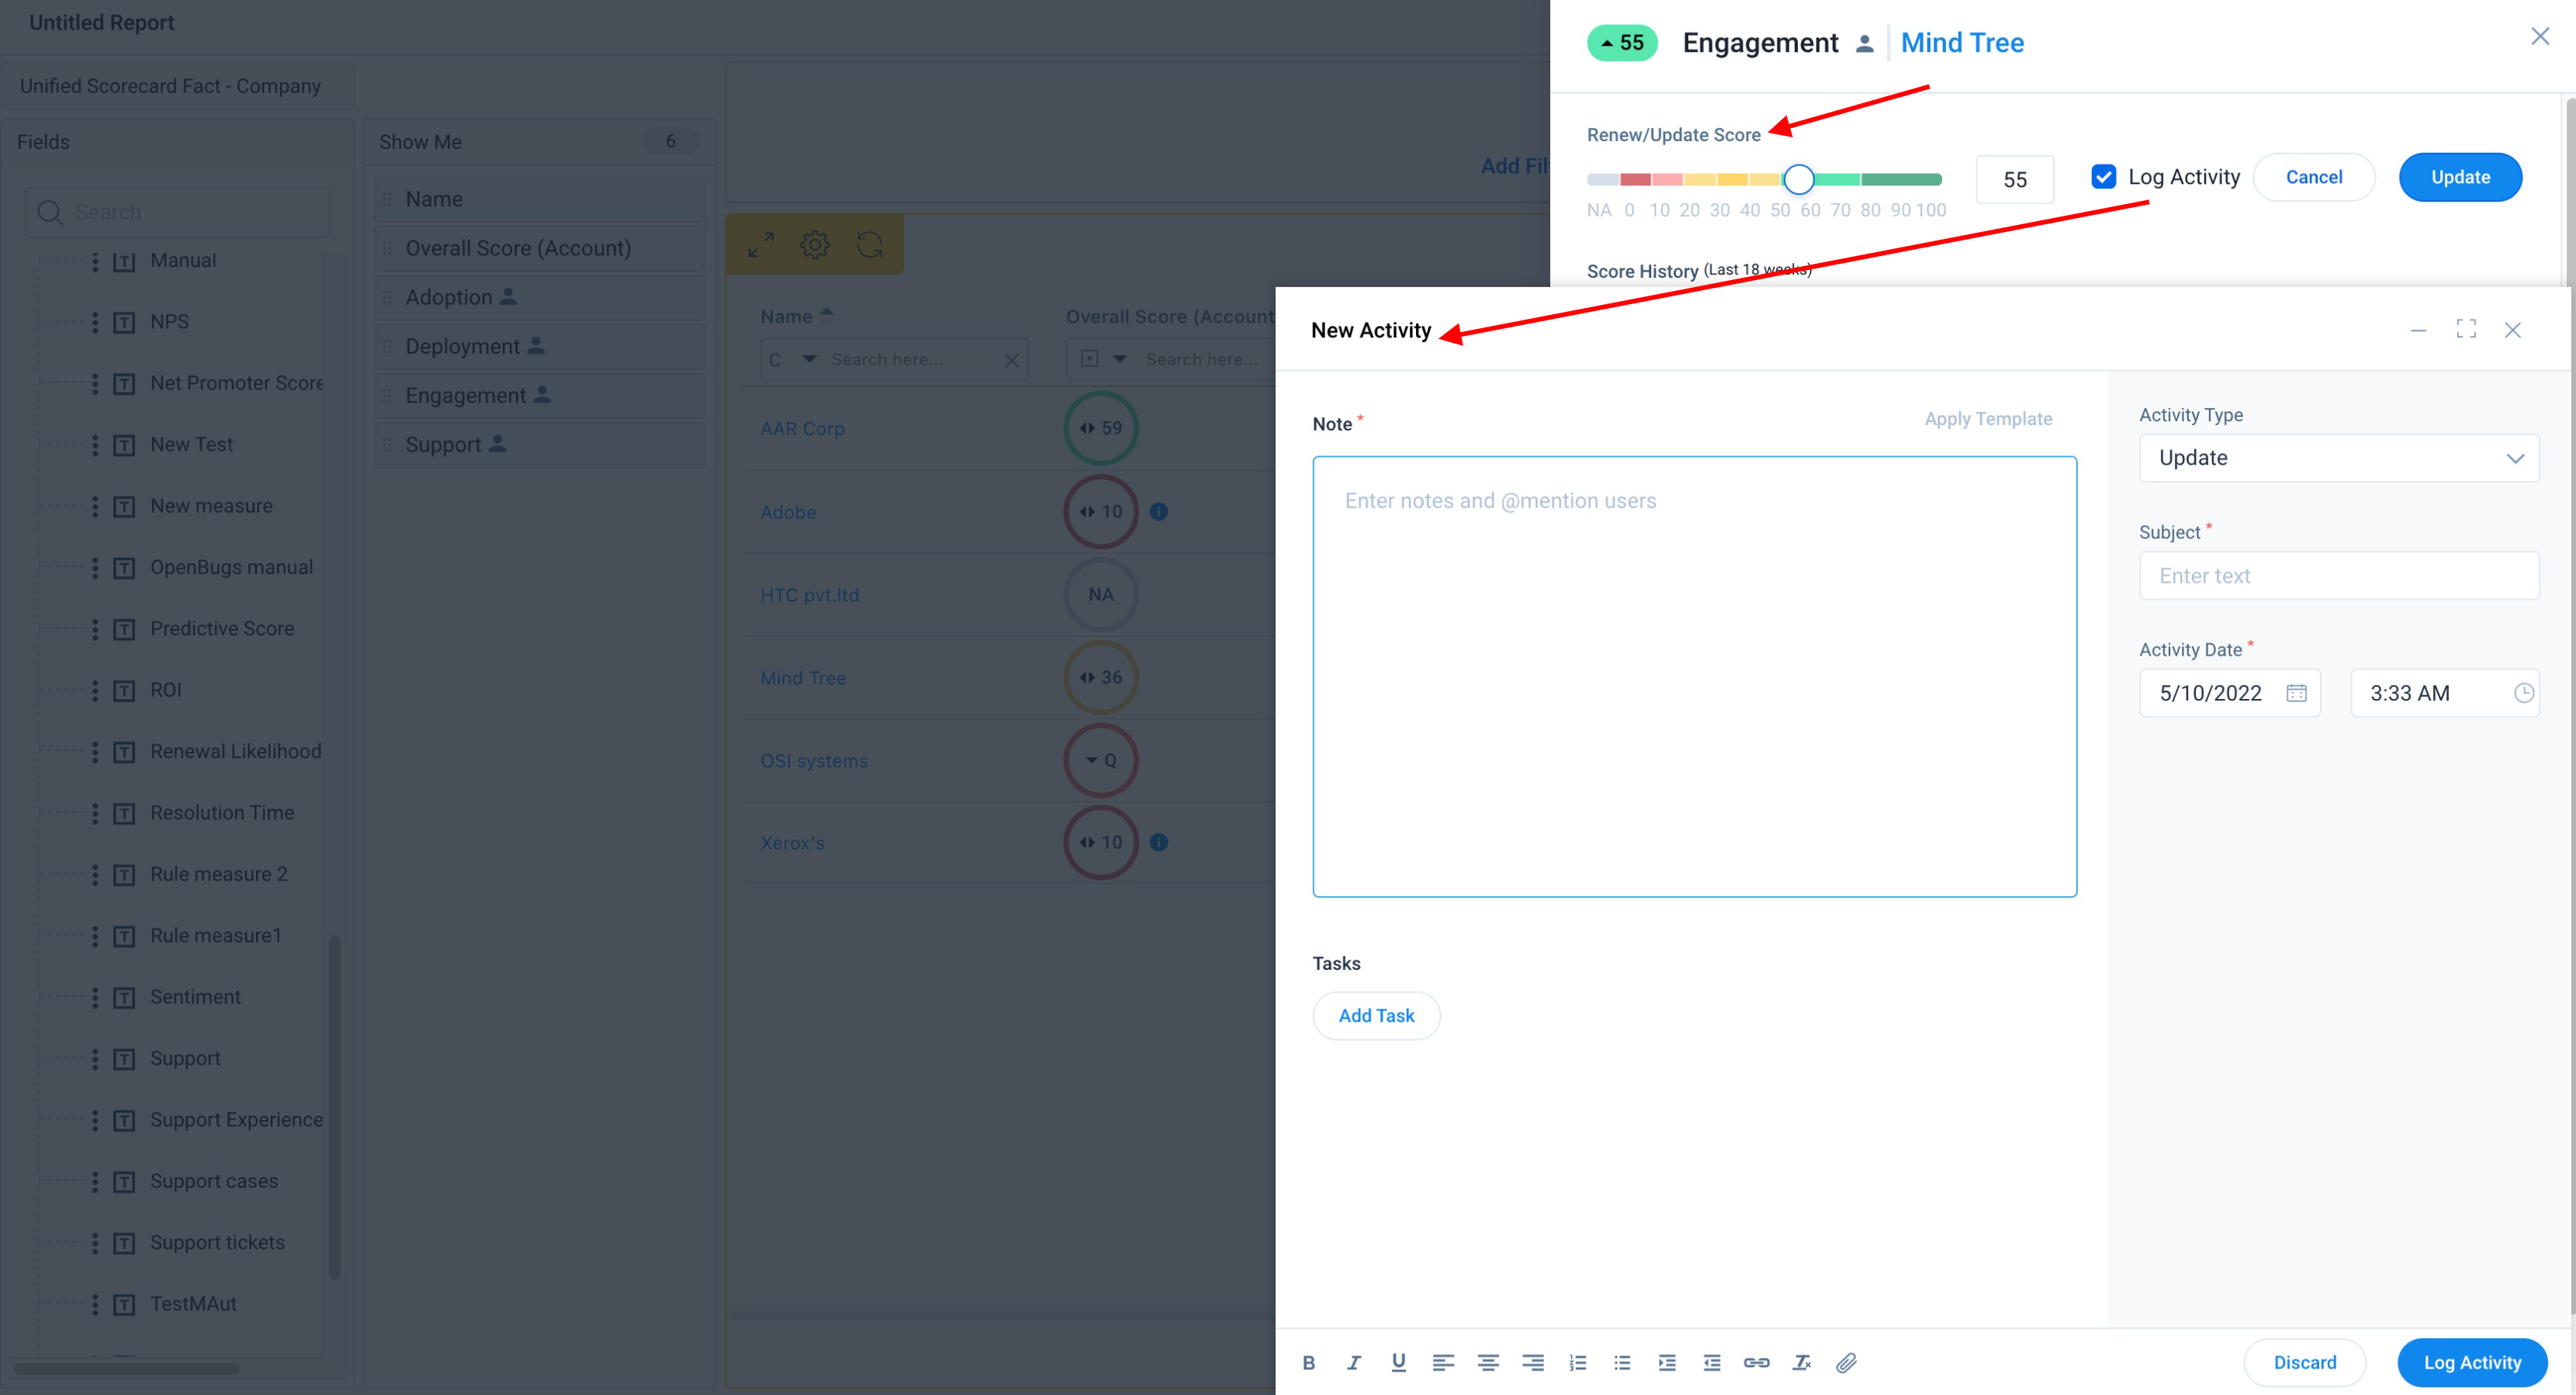
Admins can edit measure scores, and add notes to them, directly within the Mass Edit report. To make these inline revisions, take the following steps:
- Within your Scorecard Mass Edit report, click the measure score you want to revise. A slide out panel will open.
- Click the new value you wish to apply to the score.
- Check the Log Activity box to add a comment to the measure score. This automatically opens a New Activity window after you Update or Renew the score value.
- Click Update to set the new score value, or click Renew if renewing a stale score value. If you checked the Log Activity box, the New Activity window is displayed. For more information on configuring activities, refer to Log an Activity under Additional Resources.
Scorecard Reports in Dashboards
Admins can select scorecard reports to display as widgets in Dashboards alongside other reports. When displayed in a Dashboard, scorecard reports have many of the same visual and filter configuration options that they do in the Scorecard Widgets screen. For more information on how to add scorecard reports as Dashboard widgets, refer to Create and Configure Dashboard under Additional Resources. For more information on configuration options for all Dashboards, refer to Dashboards Overview under Additional Resources.
Mass Edit Reports in Dashboards
Mass Edit Report displayed in Dashboards include the following functionality:
- Visual elements designed to make the displayed data easier to interpret. For information on these elements, refer to Mass Edit Report Features.
- Inline filters designed for scorecard data. For more information on these filters, refer to Inline Filters.
- The ability to edit measure scores and add notes to them. For more information on these actions, refer to Update Scores and Add Notes.
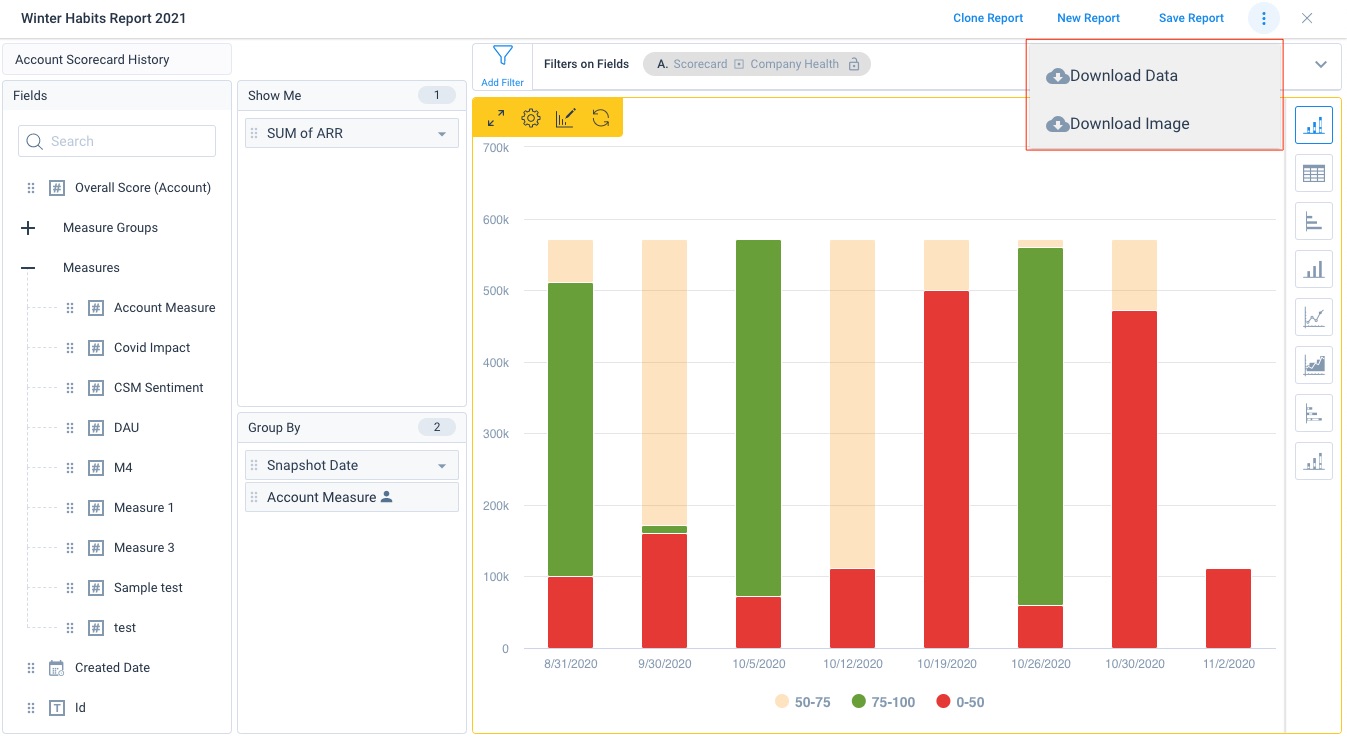
Download Scorecard Reports
Admins can download scorecard report data by clicking the three dot icon at the top of the report and selecting either Download Data or Download Image.
- Download Data: Click this option to download the report data as an Excel file. Depending on the size of the file, this will either download the report directly, or it will send the report file to you via email.
- Download Image: Click to download an image of the report as a .png file.
Note: This option is not available for Mass Edit reports, or Habit reports with the tabular visualization style.