Pivot Task in Data Designer
Gainsight NXT
This article explains admins on how to transform data into a simplified and actionable dataset in Data Designer using the Pivot task.
Pivot Function: Pivot transforms the data available in a table by turning the unique values in one column into multiple columns in the output.
Overview
In a dataset, the Pivot task transforms the data available in a single table column into multiple columns in one go. The Pivot task creates a column for every single data value in the table column. This enhances the data summarization process to get better insights into the data.
To use the Pivot functionality, navigate to the Administration > Data Designer > Open a Dataset > click Options > click Pivot.
The following are the key benefits of using the Pivot task:
- Summarizes data easily
- Makes data analysis easier
- Assists in finding data patterns
- Helps in making decisions faster
Purpose of Pivot Task
The purpose of the Pivot Task is to create a Pivot table that contains the summarization of terabytes (TBs) of raw data into useful information as required by the organization. This helps in making decisions faster.
Consider a scenario where a Customer Success Director (CSD) wants to find patterns on the CTA Types and wants to know which CSMs are interested in which CTA Type.
Using the Pivot task, admins can directly convert the records (values) in the CTA Type Name column (single column) to multiple columns of individual CTA Type Names, grouped by CSM Name.
The following table displays the records of CSM Name and CTA Type Name in two columns. In such scenarios, it is challenging to manually calculate as to which CTA Type Name has the highest number of CTAs, which CSM is more interested in which CTA Type, and so on.
| CSM Name | CTA Type Name |
|---|---|
| Avneesh S | Activity |
| Avneesh S | Expansion |
| Rakesh Kondam | Lifecycle |
| Rakesh Kondam | Objective |
| Sandeep Dugar | Lifecycle |
| Sandeep Dugar | Lifecycle |
| Sandeep Dugar | Expansion |
| Sandeep Dugar | Expansion |
| Sandeep Dugar | Lifecycle |
| Sandeep Dugar | Lifecycle |
The above-mentioned business scenario helps perform the Pivot task that allows Admins to create a column for every CTA Type Name (each data value). In this scenario, the following fields are used:
- CTA Type Name:
- Expansion
- Risk
- Activity
- Lifecycle
- Objective
- CSM Name
Assume that you already have a dataset in Data Designer with two columns namely, CSM Name and CTA Type Name. To accomplish this use case, you must Pivot on a CTA Type Name field and apply Group By clause on the CSM Name field. When you run preview the dataset, the following table is displayed.
| CSM Name | Expansion CTAs | Risk CTAs | Activity CTAs | Lifecycle CTAs | Objective CTAs |
| Avneesh S | 1 | 0 | 1 | 0 | 0 |
| Rakesh Kondam | 0 | 0 | 0 | 1 | 1 |
| Sandeep Dugar | 2 | 0 | 0 | 4 | 0 |
From the above output table, the Customer Success Director can easily understand which CTA Type Name has the highest number of CTAs and which CSM is more interested in which CTA Type.
Pivot Task in Data Designer
This section covers the information on how to create a Pivot task in Data Designer, that transforms data available in a single column to multiple columns.
Create Datasets
To create a Dataset:
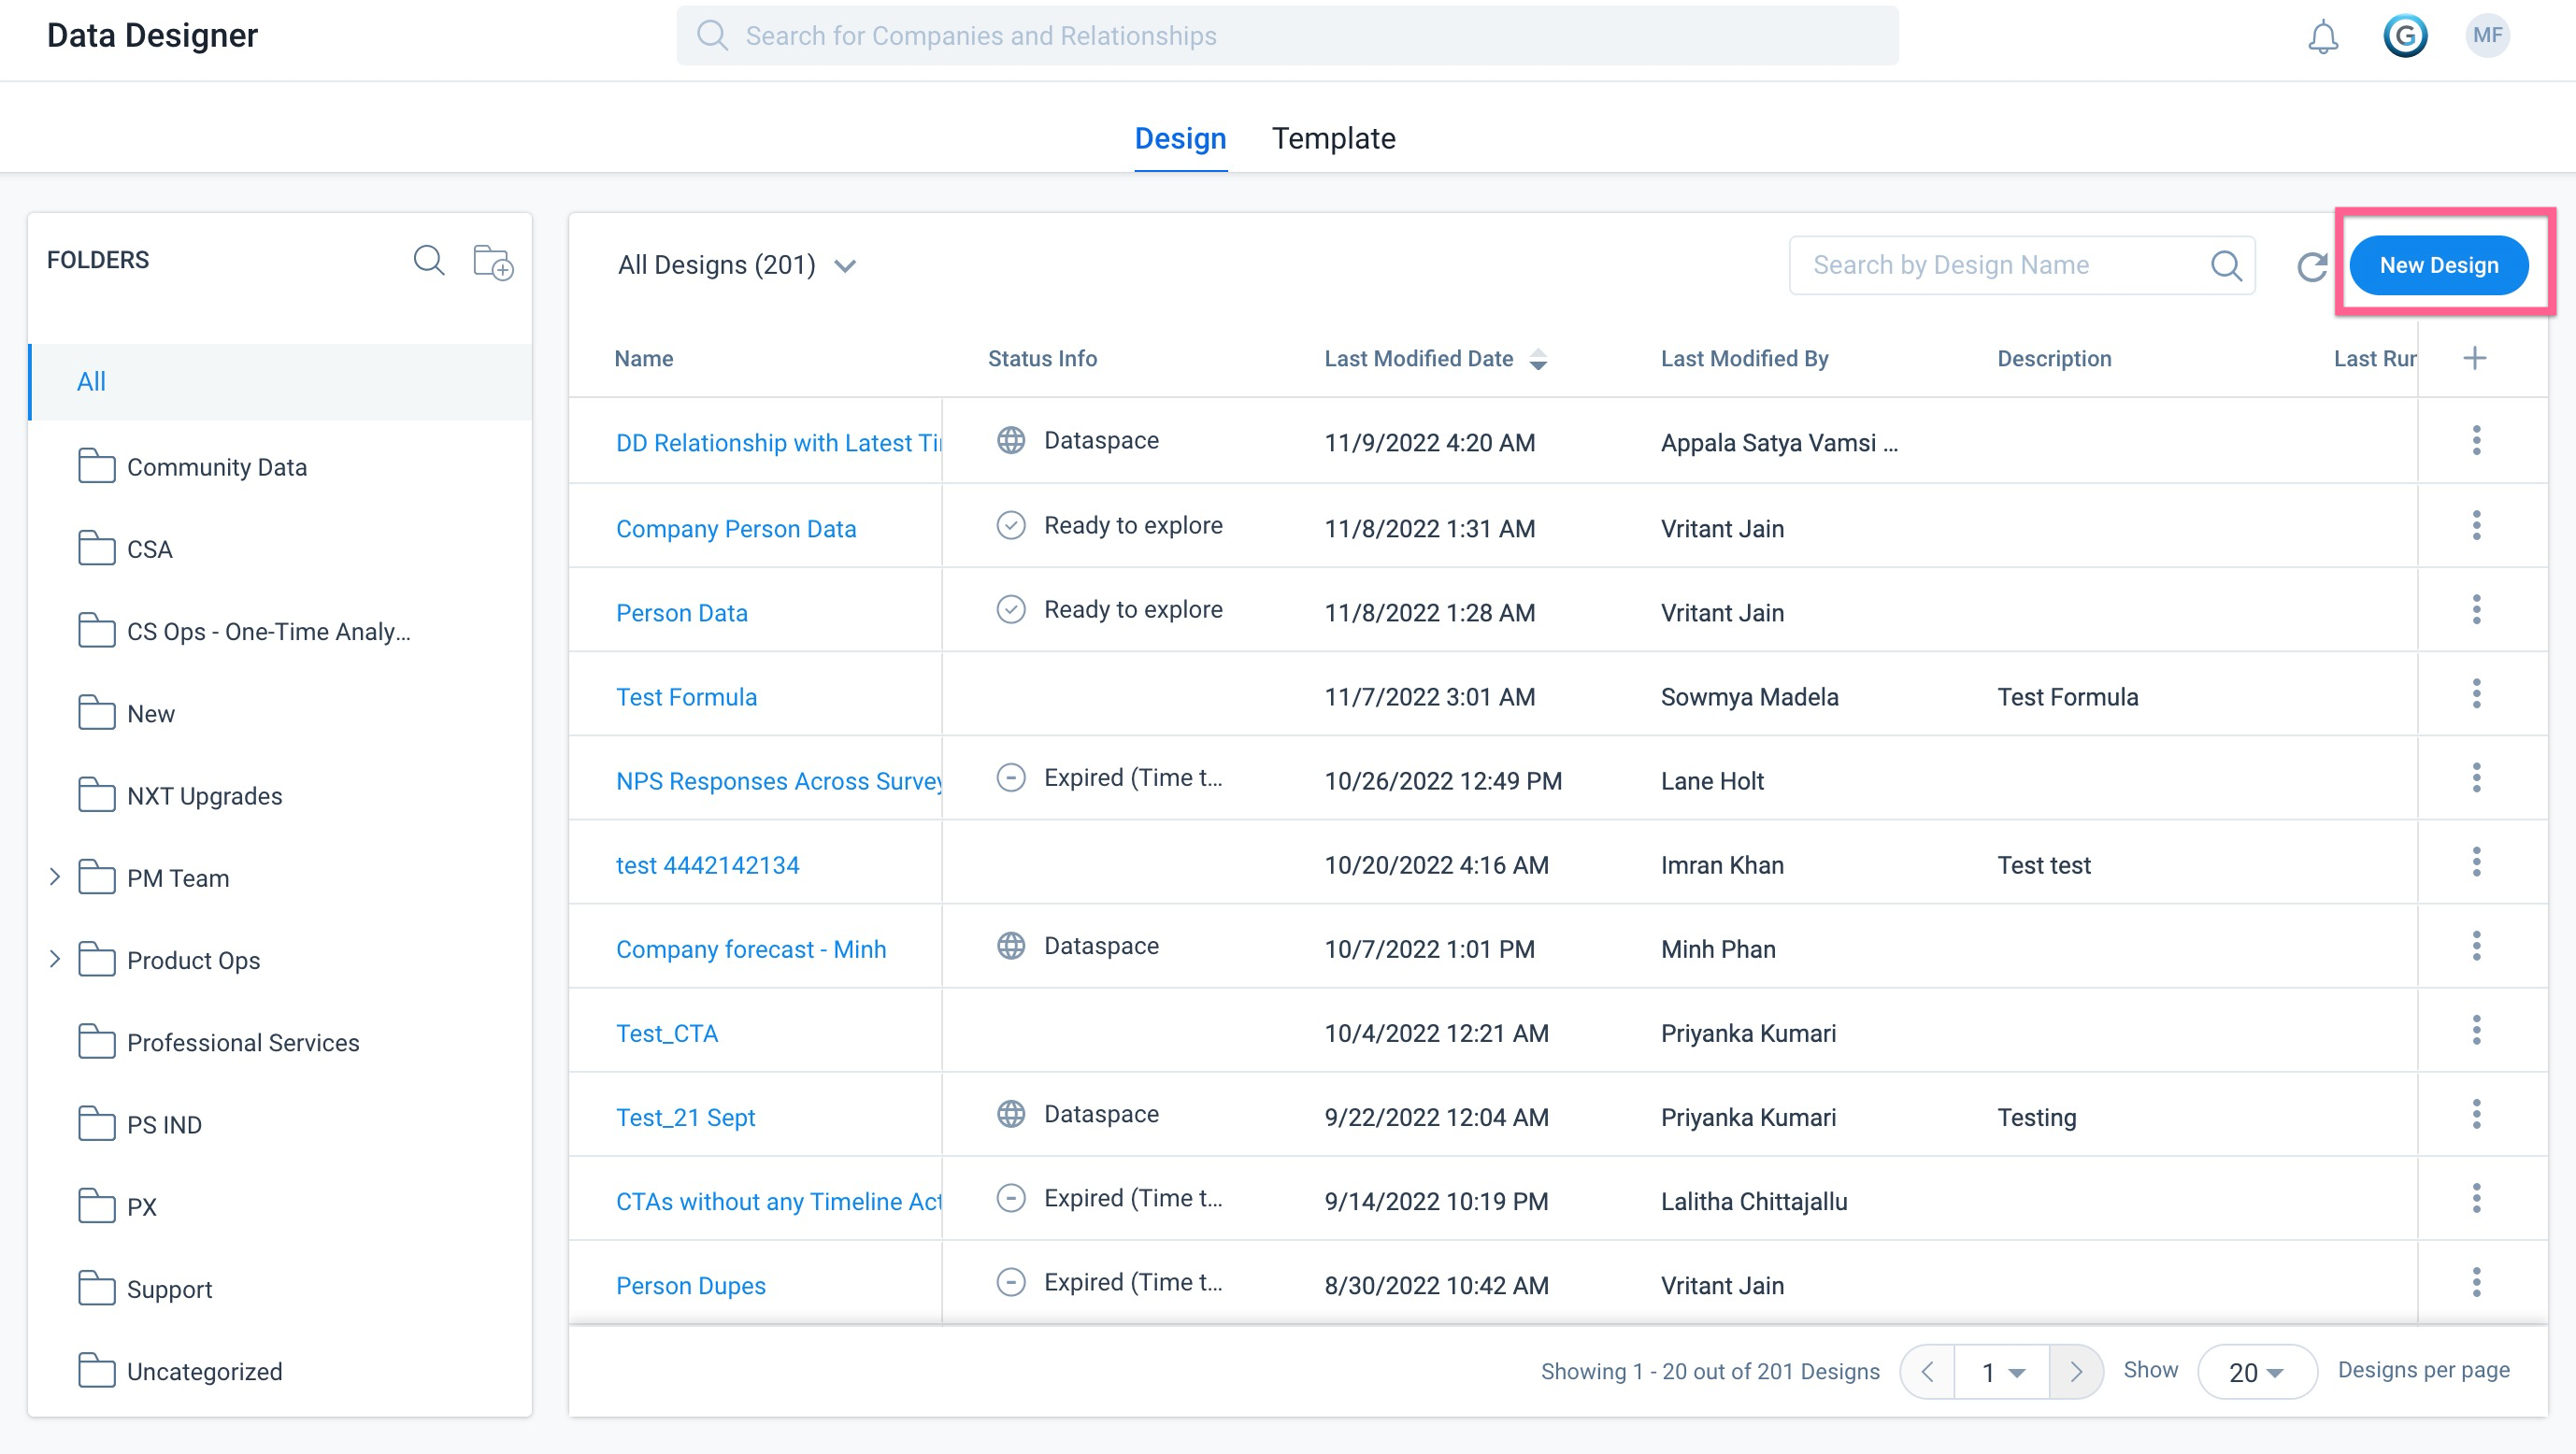
- Navigate to Administration > Data Designer. You can see the existing list of designs.
Note: For more information, refer to the Designs Listing Page and Options article listed in the Additional Resources section.
- Click New Design.

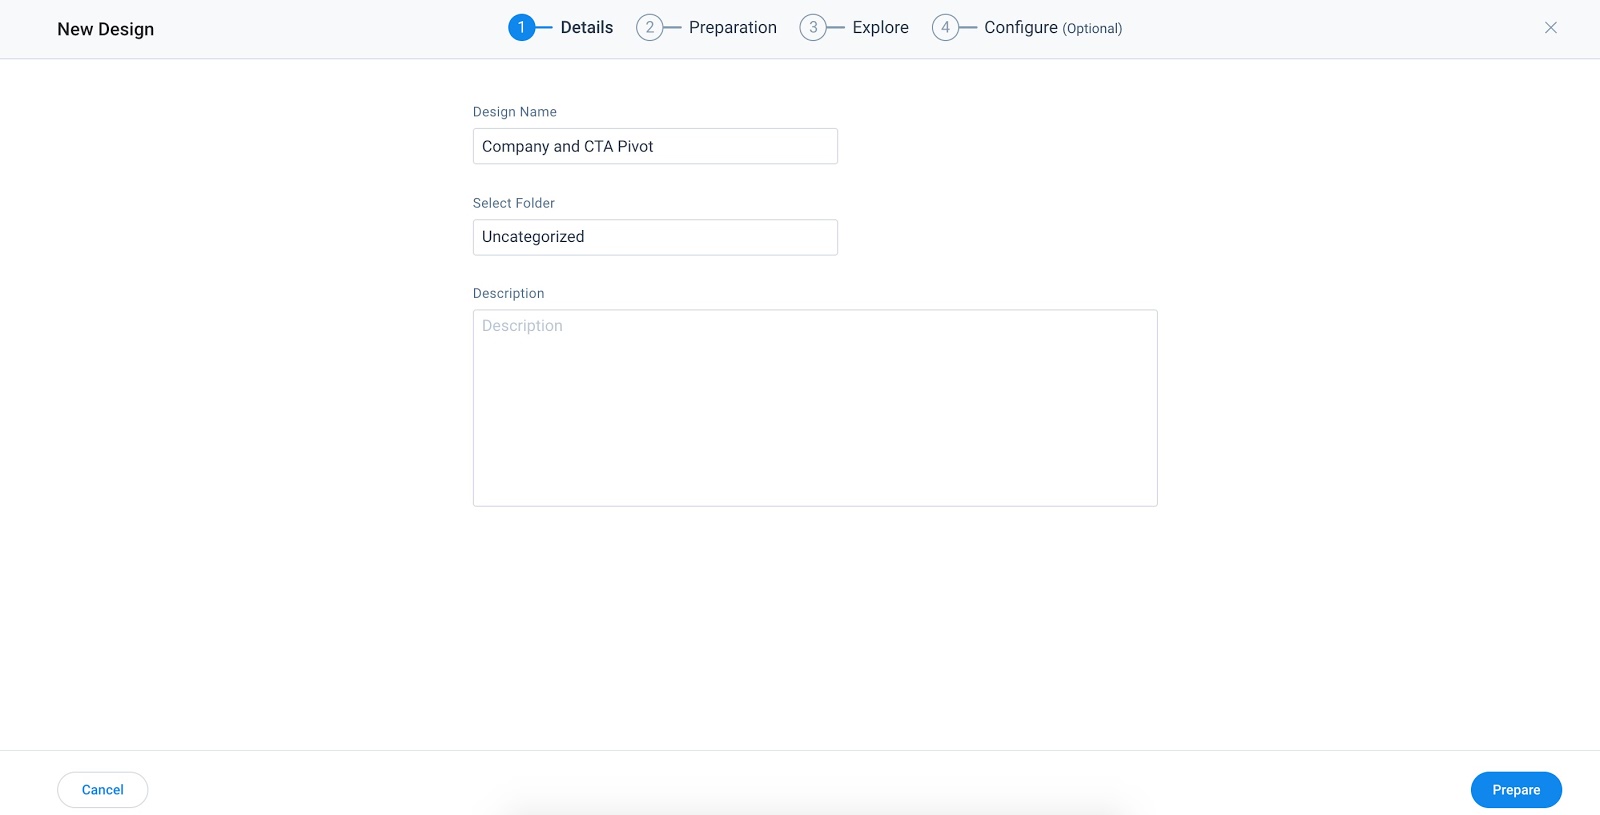
- In the Design Name text box, enter the name of your choice.
- From the Select Folder dropdown list, select the folder in which you want to add this design if you have already created a folder in the Designs Listing page; otherwise, by default, the design will be saved in the Uncategorized folder.
- In the Description textbox, enter the description of your choice [Optional].

- Click Prepare on the bottom right corner of the screen, to save the design and you will be navigated to the Preparation tab.
- From the Data Source dropdown menu, select the Matrix Data source. All the objects under the selected Data Source appear.
- Drag and drop the Company Object from the Objects list to the data preparation screen.
- Select the required fields you want to add to the dataset. In this example, the following fields are added:
- Company Name
- CSM Name
- Click Select.
- Click Save.
Similarly, create another dataset on Salesforce connection data source > Call to Action object with the following fields:
- CTA Type Name
- Account Name
For more information on how to create a dataset, refer to the Create Datasets in Data Designer article listed in the Additional Resources section.
Create Merge Task
Datasets are merged in the following ways:
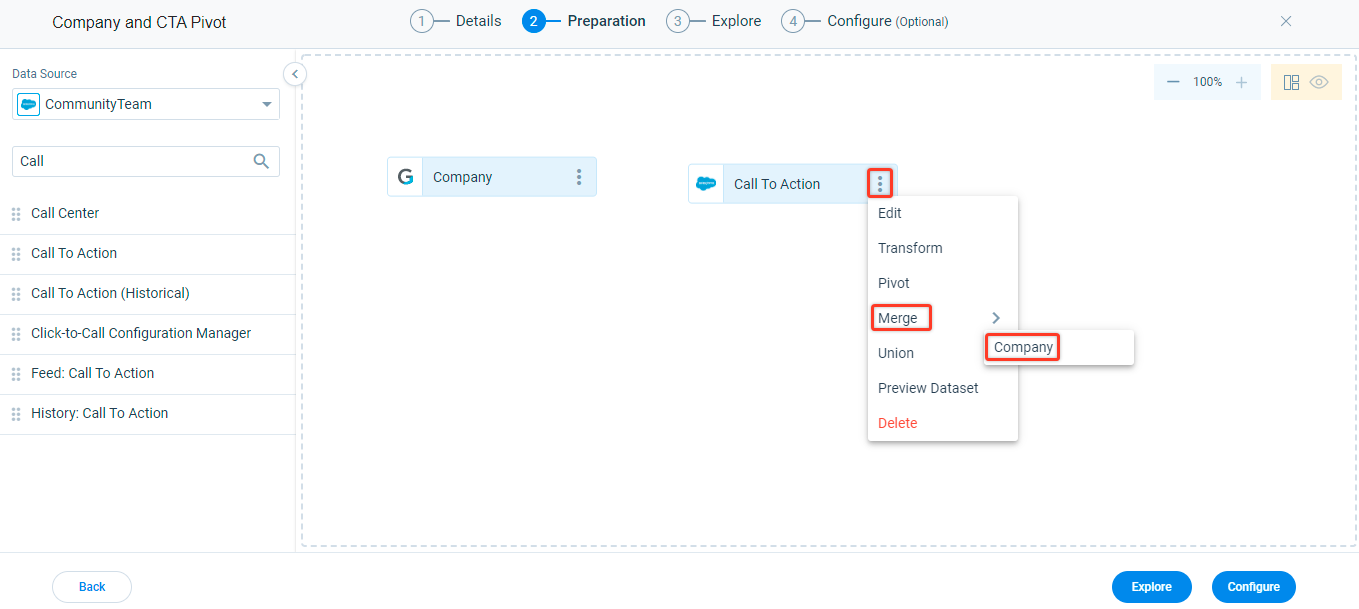
- Click Options on the dataset you want to merge. The Call to Action object is selected here.
- Click Merge.
- Select the required dataset. The Company object is selected here.

After you merge the datasets, a new window with the dataset name ‘Merge’ appears, where you can see Details & Summary, Join, Fields, and Filters tabs.
For more information on how to merge datasets, refer to the Merge section of the Create Datasets in Data Designer article listed in the Additional Resources section.
Create Pivot Task
To create Pivot task:
- Click Options on the dataset you want to pivot, and then click Pivot. A new window with the dataset name Pivot on "Merge" appears, where you can see Details & Summary, Pivot, Fields, and Filters tabs.
Note: Only one pivot can be configured per dataset.
- From the Select a field to pivot on dropdown list, select the CTA Type Name field.
- Click + Add Column and define the pivot field criteria for every single data value. In this example, set the operator as Equals and enter a CTA Type Name.
- In the Output Column Label text box, enter the name of your choice.
Perform steps three and four for every record of CTA Type Name.
- Navigate to the Fields tab.
- Select the required field on which you want to Group By. In this example, select the CSM Name field checkbox and Group By checkbox.
- Click Save.
- Click Preview.
So, in this example, a Pivot table is created which summarizes all the CTA Type Names based on the CSM Name. A Customer Success Director can easily understand which CTA Type Name has the highest number of CTAs and which CSM is more interested in which CTA Type.
The arrangement of the columns can vary in the output. To rearrange the columns, drag the column name and drop it at the required position.
Additional Resources
- For information on the Designs Listing page and Options, refer to the Designs Listing Page and Options article.
- For information on how to create datasets, refer to the Create Datasets in Data Designer article.
- For information on the Functionality Details in Preparation tab, refer to the Preparation Details in Data Designer article.
- For information on the Functionality Details in Explore tab, refer to the Explore Details in Data Designer article.
- For information on the most frequently asked questions on Data Designer, refer to the Data Designer FAQs article.