Create Datasets in Data Designer
Gainsight NXT
Overview
Data Designer helps admins build Datasets from disparate data sources. Using these datasets, you can explore and analyze the data to see if it’s valuable or not, and then make it permanent across Gainsight. This article will walk you through the configuration process of how to Prepare, Explore, and Configure (schedule) a Dataset in Data Designer.
Before you get started with the Dataset creation process, Gainsight recommends you to refer to the Data Designer Overview article.
In this configuration article, we used the below mentioned use case to demonstrate the process of creating a dataset.
Use Case:
For instance, you might want to know if the customers who are raising support tickets are actually using the product correctly or not, and you might also want to know if those customers have good health scores when compared to other customers who are not raising support tickets. Assume that you have Case Data (Support Data) in a Salesforce Object, and you have other data sources in multiple Gainsight objects such as Usage and Company. With Data Designer, you can merge and transform the data from these data sources, to correlate and derive real and powerful insights.
Limitations
- The Correlation formula in a Data Preparation preview doesn’t work the same as the Correlation formula on the Explore Preview. The numbers might slightly differ. The Correlation formula in Data Preparation preview works precisely.
- The Median value you see in the Explore page is approximate, and therefore the value you see in Explore preview is different from the Data Preparation preview.
- Assume, you have built a report on the Dataspace 2.0 and added it to the Dashboard. And later, if you remove any fields from the Dataset and run it, the report in the dashboard stops working and throws an error.
- The Datetime data in the Data Preparation preview is shown in Org Timezone, the Datetime data in the Explore page is shown in the User Timezone, and the Datetime data in the Execution Logs is shown in the UTC Timezone.
- WHOID and WHATID type fields in a dataset display IDs.
- Assets of the Data Designer cannot be migrated using X-org Migration Tool.
Create New Design
To create a new Design:
-
Navigate to Administration > Data Designer. You can see the existing list of designs. For more information on Data Design lists, refer to the Designs Listing Page and Options article.
-
Click New Design. The New Design page appears, where you can see four tabs, namely:
- Details
- Preparation
- Explore
- Configure
Details
Enter the following information in the Details tab. In this use case, the following information is used:
- Design Name: Case, Company and Usage Data.
- Select Folder: Select the folder in which you want to add this design, if you have already created a folder in the Designs Listing page (or) By default, the design will be saved in the Uncategorized folder.
- Description: [Optional] Merge Case, Company and Usage Data to derive real insights.
- Click Prepare on the bottom right corner of the screen, to save the design and you will be navigated to the Preparation tab.
Preparation of Dataset
Data Designer enables admins to prepare data with confidence. For instance, if you are looking for insights like Correlation in the prepared data, and if you think this insight is not available in the prepared data, you can discard the dataset and create a new one.
In the preparation step, you can merge two different objects and create a Dataset. If required, you can Transform a dataset to apply Filters, Formulas, Case Expressions, etc.
For more information on the Functionality Details in Preparation tab, refer to the Preparation Details in Data Designer article.
Create Dataset 1 (Case Data)
To create the first Dataset:
- Select the required source from the Data Source dropdown. Once you select the Data Source, you can see all the objects under the selected Data Source. Here, the data source is Salesforce Hybrid Connection.
IMPORTANT: If the data you want to analyze is not from Gainsight, you can make use of custom objects in Gainsight to load your data from external sources or if your data is available in Amazon S3 buckets (Gainsight managed or Custom buckets), you can create datasets using this data.
For more information on how to use data from S3 in Data Designer, refer to the Use S3 Data in Data Designer article.
- Drag and drop the required Object from the Objects list to the Canvas screen. Here, the object is Case_Demo.
- Select the required fields you want to add to the dataset. In this use case, select the following fields:
- CaseID
- Company Name
- Priority
- Case Subject
- Click Select.
- Click Save.
Hover to the dataset created, and click the Preview/Eye icon to view the data. In Preview, you can view the sample data and might not contain the entire data.
Click Refresh on the Preview tab to refresh the sample data, if you have added/deleted the fields etc.
Create Dataset 2 (Company Data)
To create the second Dataset:
- Select the required source from the Data Source dropdown. Here, the data source is Matrix Data.
- Drag and drop the required Object from the Object list to the Canvas screen. Here, the object is Company_Demo.
- Select the required fields you want to add to the dataset. In this use case, select the following fields:
- Name
- Real Score
- True NPS®
- Score Label
- Click Select.
- Click Save.
Note: For Numeric type fields, you can change the number of decimal places by clicking the Settings/Gear icon in the Fields tab.
Merge First and Second Datasets
To merge the first and second datasets, to correlate the Case and Company data:
- Click Options on the dataset you want to merge, and then click Merge and select the required dataset. Dataset Details window appears.
Note: You can view all the datasets available in the selected design. - [Optional] Rename the Dataset Name as required. Here, the dataset is renamed as Case and Company Data.
- Select the required join condition in the Join tab. Here, for this use case, select the Inner join condition. For more information on Joins, refer to the Joins section in Preparation Details article.
- Select a field from each dataset to set the criteria. For instance, the Company Name in Company_Demo dataset is Name, and Company Name in Case_Demo dataset is Company Name.
- Click + to add multiple join conditions, if required. This helps filter the records based on your business requirements.
- In the Fields tab, you can select/deselect the fields as required. For this use case, deselect the Name field to avoid multiple records, as you have Name and Company Name fields from both datasets.
- Click Save.
-
Click Preview, and see if the data is valuable or not. If you think that the data is not valuable, you can edit the dataset.
Create Dataset 3 (Usage Data)
To create the third Dataset:
- Select a source from the Data Source dropdown. Here, the data source is Matrix Data.
- Drag and drop the required Object from the Object list to the Canvas screen. Here, the object is Usage_Demo.
- Select the required fields you want to add to the dataset. In this use case, select the following fields:
- Name
- Page Views
- Click Select.
- Click Save.
Transform Dataset 3
To transform the third Dataset:
- Click Options on the dataset (Usage_Demo), and click Transform. Dataset Details window appears.
- In the Fields tab deselect the Date field to avoid the multiple records in the same month.
- Select Group By for the Company Name field, and set the Aggregation of the Page Views field to Sum, to achieve Sum of Page Views by Company Name.
Note: In the Transformation task, you can also apply Formula Fields and Case Fields on the fields added to the dataset. For more information on how to create Formula Fields and Case Fields, refer to Formula Fields and Case Fields section in the Preparation details article. - Click Save.
Merge ‘Case & Company’ and Transformed ‘Usage’ Datasets
Perform Merge on Case, Company and Transformed Usage datasets to create an output dataset.
- Drag and drop Case and Company dataset over the Transformed Usage dataset to merge.
- [Optional] Rename the Dataset Name as required. Here, the dataset is renamed as Case Company and Usage.
- Select the required join condition in the Join tab. Here, select the Inner join condition.
- Select a field from each dataset to set the criteria.
- Click + to add multiple join conditions, if required. This helps filter the records based on your business requirements.
- In the Fields tab, you can select/deselect the fields as required. Here, deselect the Name field to avoid multiple records, as you have Name and Company Name fields from both datasets.
- Click Save.
-
Click Preview to view the sample merge data of the datasets.
Save Dataset as Design Template
Once the dataset is created, users can save this design as Design Template, that can be used as a base design for creating similar dataset with variations.
To save a dataset as Design Template:
- Click Save As. The Save As Design Template dialog is displayed.
- From Save as Design Template dialog, select one of the following options:
- Save as New to save a new Design Template.
- Select Update Existing, to update an already existing template.
- Click Save Template.
For more information on how to use the Design Template, refer to the Design Templates in Data Designer article.
Explore Dataset
In the Explore tab, you can report and analyze the output dataset created during preparation, and see if the data is valuable or not. During your analysis, if required, you can apply Filters, Formulas, modify aggregations, change visualizations, etc. For more information on Functionalities in the Explore tab, refer to the Explore Details in Data Designer article.
To Explore the output Dataset:
- Click Explore on the bottom right corner of the preparation screen.
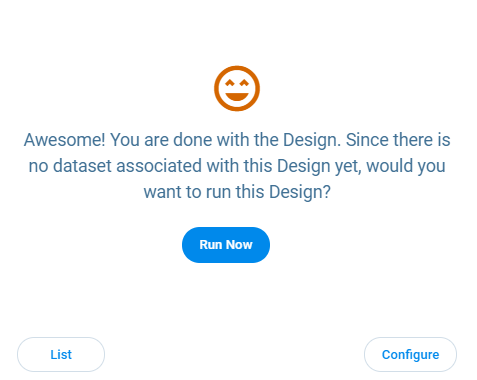
- Once you navigate to the Explore tab, you can see the following image. Click Run Now to associate a dataset with the design, and you can see that the Dataset is being prepared for analysis.
Note: Dataset Preparation for Explore may take several minutes, if required you can navigate to the Designs List page or Configure page by clicking List and Configure respectively.

Once the Refresh is completed, you will receive an execution status email. And, the dataset is now ready for your analysis and you can see the fields from the output dataset under Fields section.
Note: If you modify the already saved datasets, and then navigate to the Explore tab, you can see a message at the top of the Explore tab that you can either Refresh Dataset for the latest data or Dismiss it to continue analyzing the existing dataset.
Build Reports to Explore Data
To explore and analyze the data, you can build reports in the Explore tab.
Create Report 1: To see if the customers who are raising the tickets are actually using the product or not.
- Drag and drop the Case ID and Page Views fields to the Show Me section.
- Drag and drop the Company Name field to the Group By section.
- Click Explore. You can now see the records being displayed in a tabular report.
- Hover to the right of the screen and select the required visualization type.
- Click Save Report. Save Report window appears.
- Enter the Report Name in the Report Name textbox.
- Click SAVE. Click the Hamburger button to see all the saved reports.
Create Report 2: To see if the customers who are raising the tickets are Healthy or not.
- Drag and drop the Case ID field to the Show Me section.
- Drag and drop the Score Label field to the Group By section.
- Click Explore. You can now see the records being displayed in a tabular report.
- Hover to the right of the screen and select the required visualization type.
- Click Save Report. Save Report window appears.
- Enter the Report Name in the Report Name textbox.
- Click SAVE.
You can also publish these reports to Report Builder repository. For more information on how to publish reports, refer to the Explore Details in Data Designer article.
Configure
After your analysis, if you think that the dataset has some real value, then you can make it permanent and universal. Once a dataset is permanent, it is saved as a Dataspace under MDA, and you can use it in other functionalities of Gainsight like, Reporting, Rules, and Journey Orchestrator (JO).
To configure the Dataset:
- Navigate to the Configure tab (or) click Configure on the bottom right corner of the Explore screen.
Note: The dataset you prepared is temporary and will expire in 15 days. You can see the notification message on the top of the Configure tab. - Enable the Dataspace toggle to make the dataset permanent and universal.
Note: Once the Design is permanent, it is called a Dataspace and is available across the Gainsight and you can view the schedule options to refresh the dataspace. - Schedule: Enable Do you want to refresh this Dataspace at regular interval? toggle button.
- From the Schedule Type dropdown list, select either Basic or Advance, based on your requirement.
- Basic Schedule: You can schedule the refresh either Daily or Weekly or Monthly.
Daily: You can refresh the data space either Every Weekday (Mon - Fri) or Everyday.
Weekly: You can select the preferred day in a week to refresh the data space on a weekly basis.
Monthly: You can either select a preferable Date or Day in a month to schedule a refresh on a monthly basis.
To schedule a Refresh:
- Select either Daily or Weekly or Monthly.
- Select the Start Date and End Date.
- Set the time in the Select Time text box. This option is available only when you select Schedule Refresh as Once.
- To schedule multiple runs on Every Weekday/Every Day, select Repeat. Set the From time, To time and select the schedule interval time.
Note: You can schedule a dataset run for every 2 hours/3 hours/4 hours/6 hours, based on your requirement. - Set the required Time Zone from the Select Time Zone dropdown list.
-
Advance Schedule: Advanced Scheduler in Data Designer uses Cron Expressions to refresh the Data Space. This enables you to refresh the data more frequently, compared to the Basic scheduler. And, Advanced Scheduler also addresses some of the advanced use cases including refreshing the Data Spaces as frequently as every two hours, or on a less frequent basis to match business processes, such as on the 1st and 15th of the month.
Cron Expression: This is a string comprising 6 or 7 fields that are separated by spaces and defines the details of a schedule. Each field represents a sub-expression and allows only specific values. These values combined with special characters define the schedule.
Note: The minimum time period between data space runs is two hours.- Input the cron expression in the Enter Cron Expression text box. For information on how to input the cron expression, refer to the Cron Expression for Advanced Scheduler in Data Designer article.
- Select the Start Date and End Date.
- Set the required Time Zone from the Select Time Zone dropdown list.
-
Notification Preferences: Once you enable the Notification Preferences toggle, the logged-in user receives an Email Notification of the Execution Summary of that particular Data Design on every run (as configured in Schedule section).
Note: The Data Design created user receives an Email Notification of the Execution Summary even in an inactive state.
If required, you can also include additional email addresses as mentioned below:- Enter the email addresses in the Mention Emails For Failure textbox, to send failure notifications to those emails.
- Enter the email addresses in the Mention Emails For Success textbox, to send success notifications to those emails.
-
Click Done.
Once the configuration is set, the dataspace first run happens immediately and the next runs happen as per the defined schedule. If required, you can also run the dataspace manually from the Design listing page.
Consumption of Dataspace
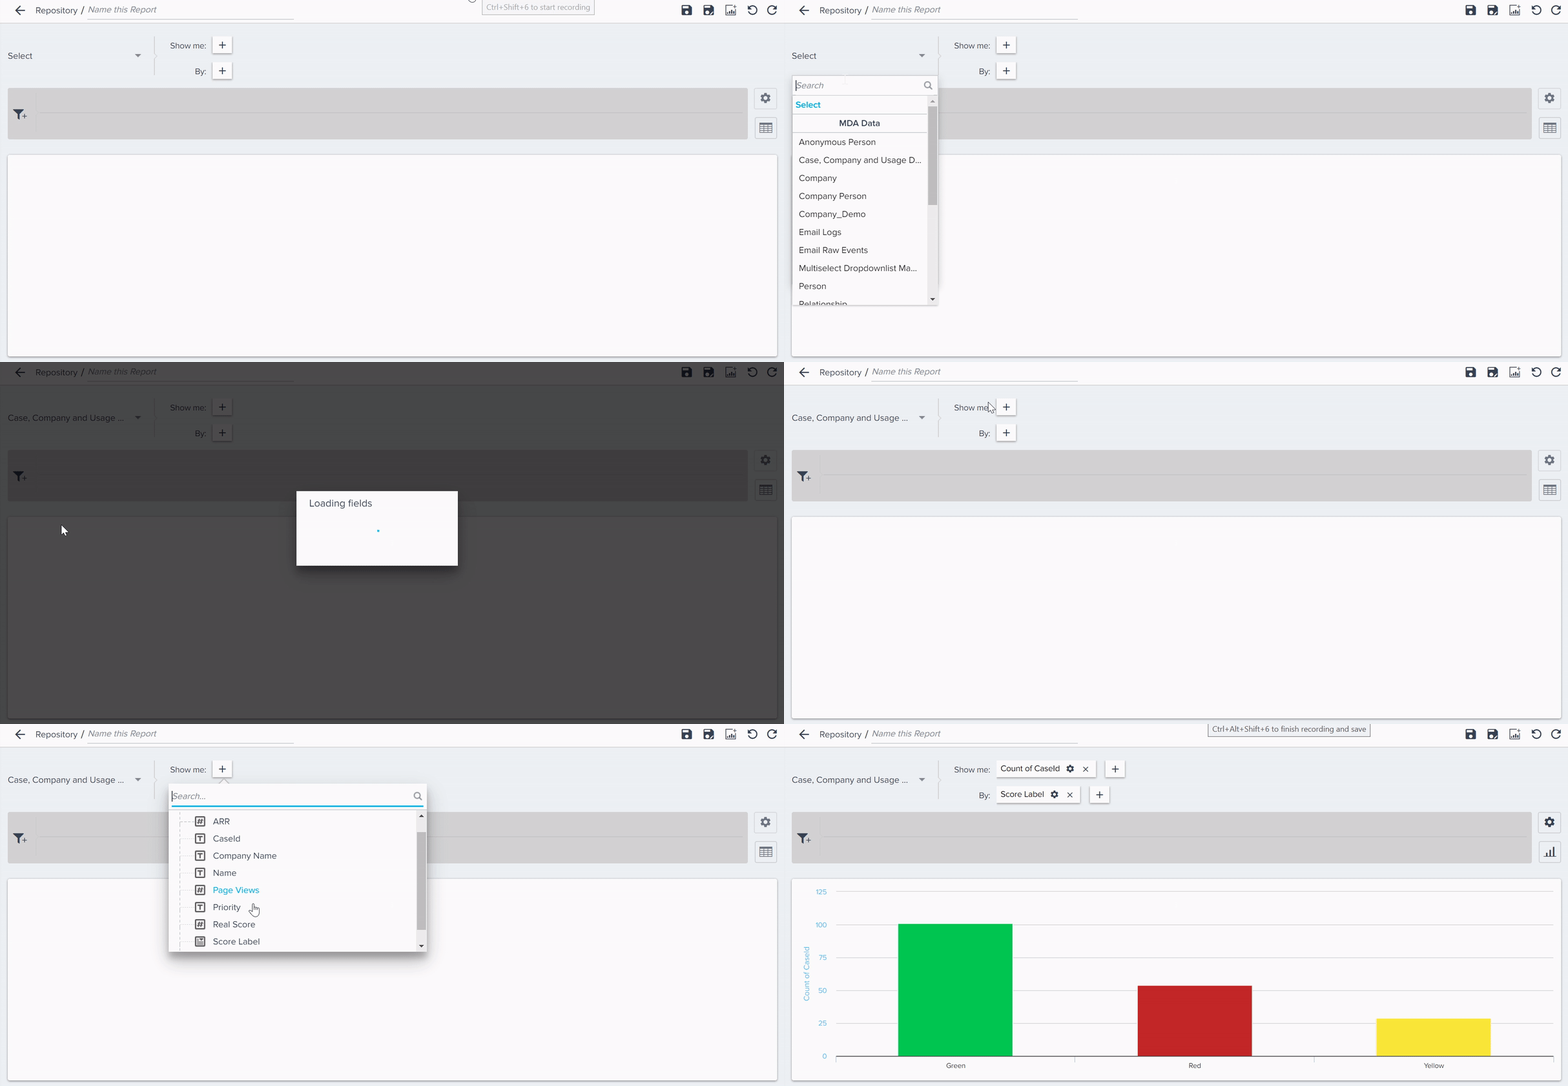
You can consume the Data Space in Report Builder, to create reports and then add it to the GS Home Dashboards.
To create Reports from Report Builder:
- Navigate to Administration > Report Builder.
- Select the Data Space from the MDA Data Source.
- Add the required fields to Show Me and By.
- Click RUN, and Save the report.

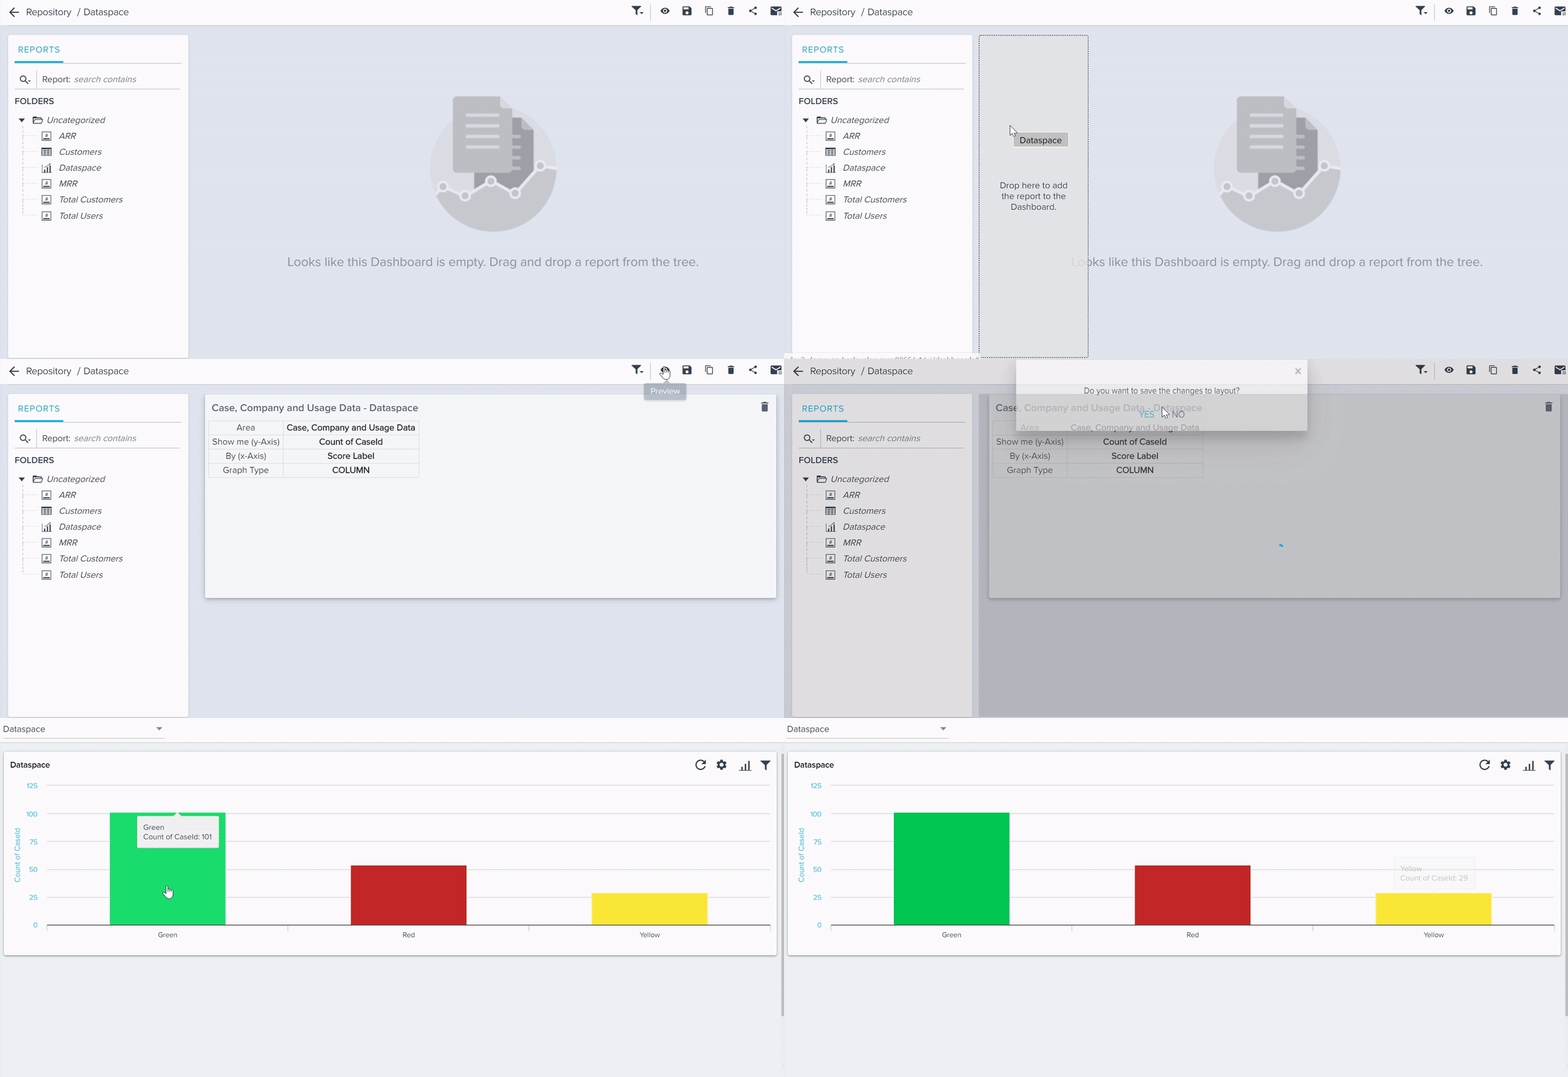
You can now add the saved report to a dashboard, for your CSMs to view on GS Home.

Additional Resources
- For more information on the Data Designer Overview, refer to the Data Designer Overview article.
- For more information on the Designs Listing page and options, refer to the Designs Listing Page Options article.
- For more information on the Functionality Details in the Preparation tab, refer to the Preparation Details in Data Designer article.
- For more information on the Functionality Details in the Explore tab, refer to the Explore Details in Data Designer article.
- For more information on how to use data from S3 in Data Designer, refer to the Use S3 Data in Data Designer article.
- For more information on the most frequently asked questions on Data Designer, refer to the Data Designer FAQs article.
| NPS, Net Promoter, and Net Promoter Score are registered trademarks of Satmetrix Systems, Inc., Bain & Company and Fred Reichheld. |