Tracking Server Side Usage Data
Currently the tracking SDK automatically tracks every user event but over time usage tracking goes beyond ui user interaction. Products very often build and expose APIs and integration modules. Tracking the usage of these capabilities which are also considered 'sticky' features can indicate adoption like any other ui based features. Collecting data should normally be either in real-time and event based or periodically via a data collector that can also collect internal production data that may be used for engagement by Gainsight PX.
Tracking Backend Aggregated Data
Any data outside the UI can be pushed into Gainsight PX via secured REST API. There are couple of options to store these metrics into Gainsight PX:
Tracking daily aggregated backend events
Usage trends over time can be tracked using custom events via the REST API and passing the metric name and the aggregated values as part of the payload.
// Track an aggregated metric
aptrinsic('track', 'dailyApiCalls',
    {
    "timestamp":1658965172096,
    "apiCalls":10512,
    "apiType":"RESTful",
    "Category":"Machine Learning",
    "subscriptionName":"GCP"
    }
);
Populating the aggregated value under the User and account attributes
Gaining visibility to the most recent values and allowing you to trigger in-app engagement
- Using the Gainsight PX Rest API (old API docs)
- Using the Java SDK
- Using the data loader
There are many useful data-collectors that can be used or tools like Mulesoft, Boomi, Zapier that can be used as well.
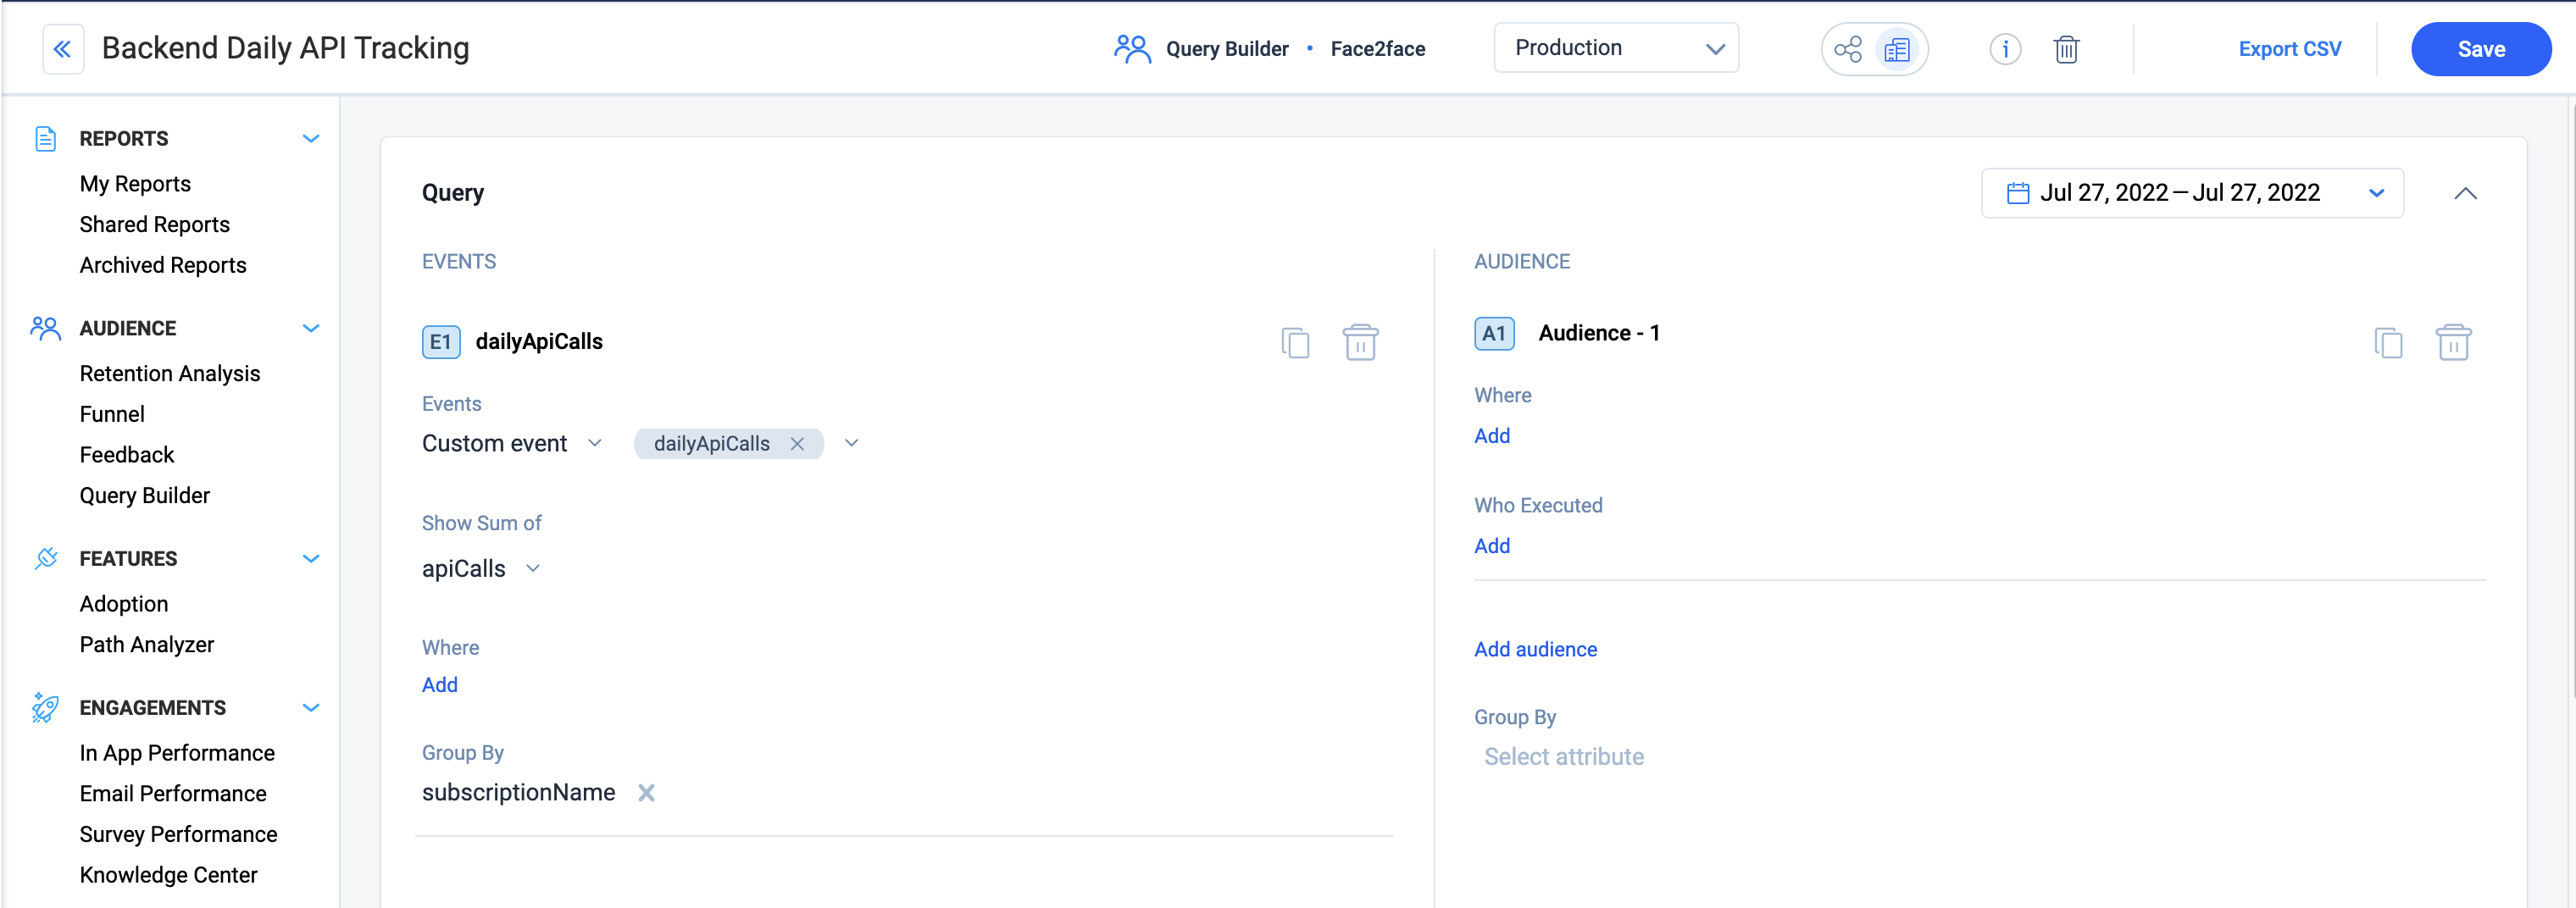
Analyze the Data
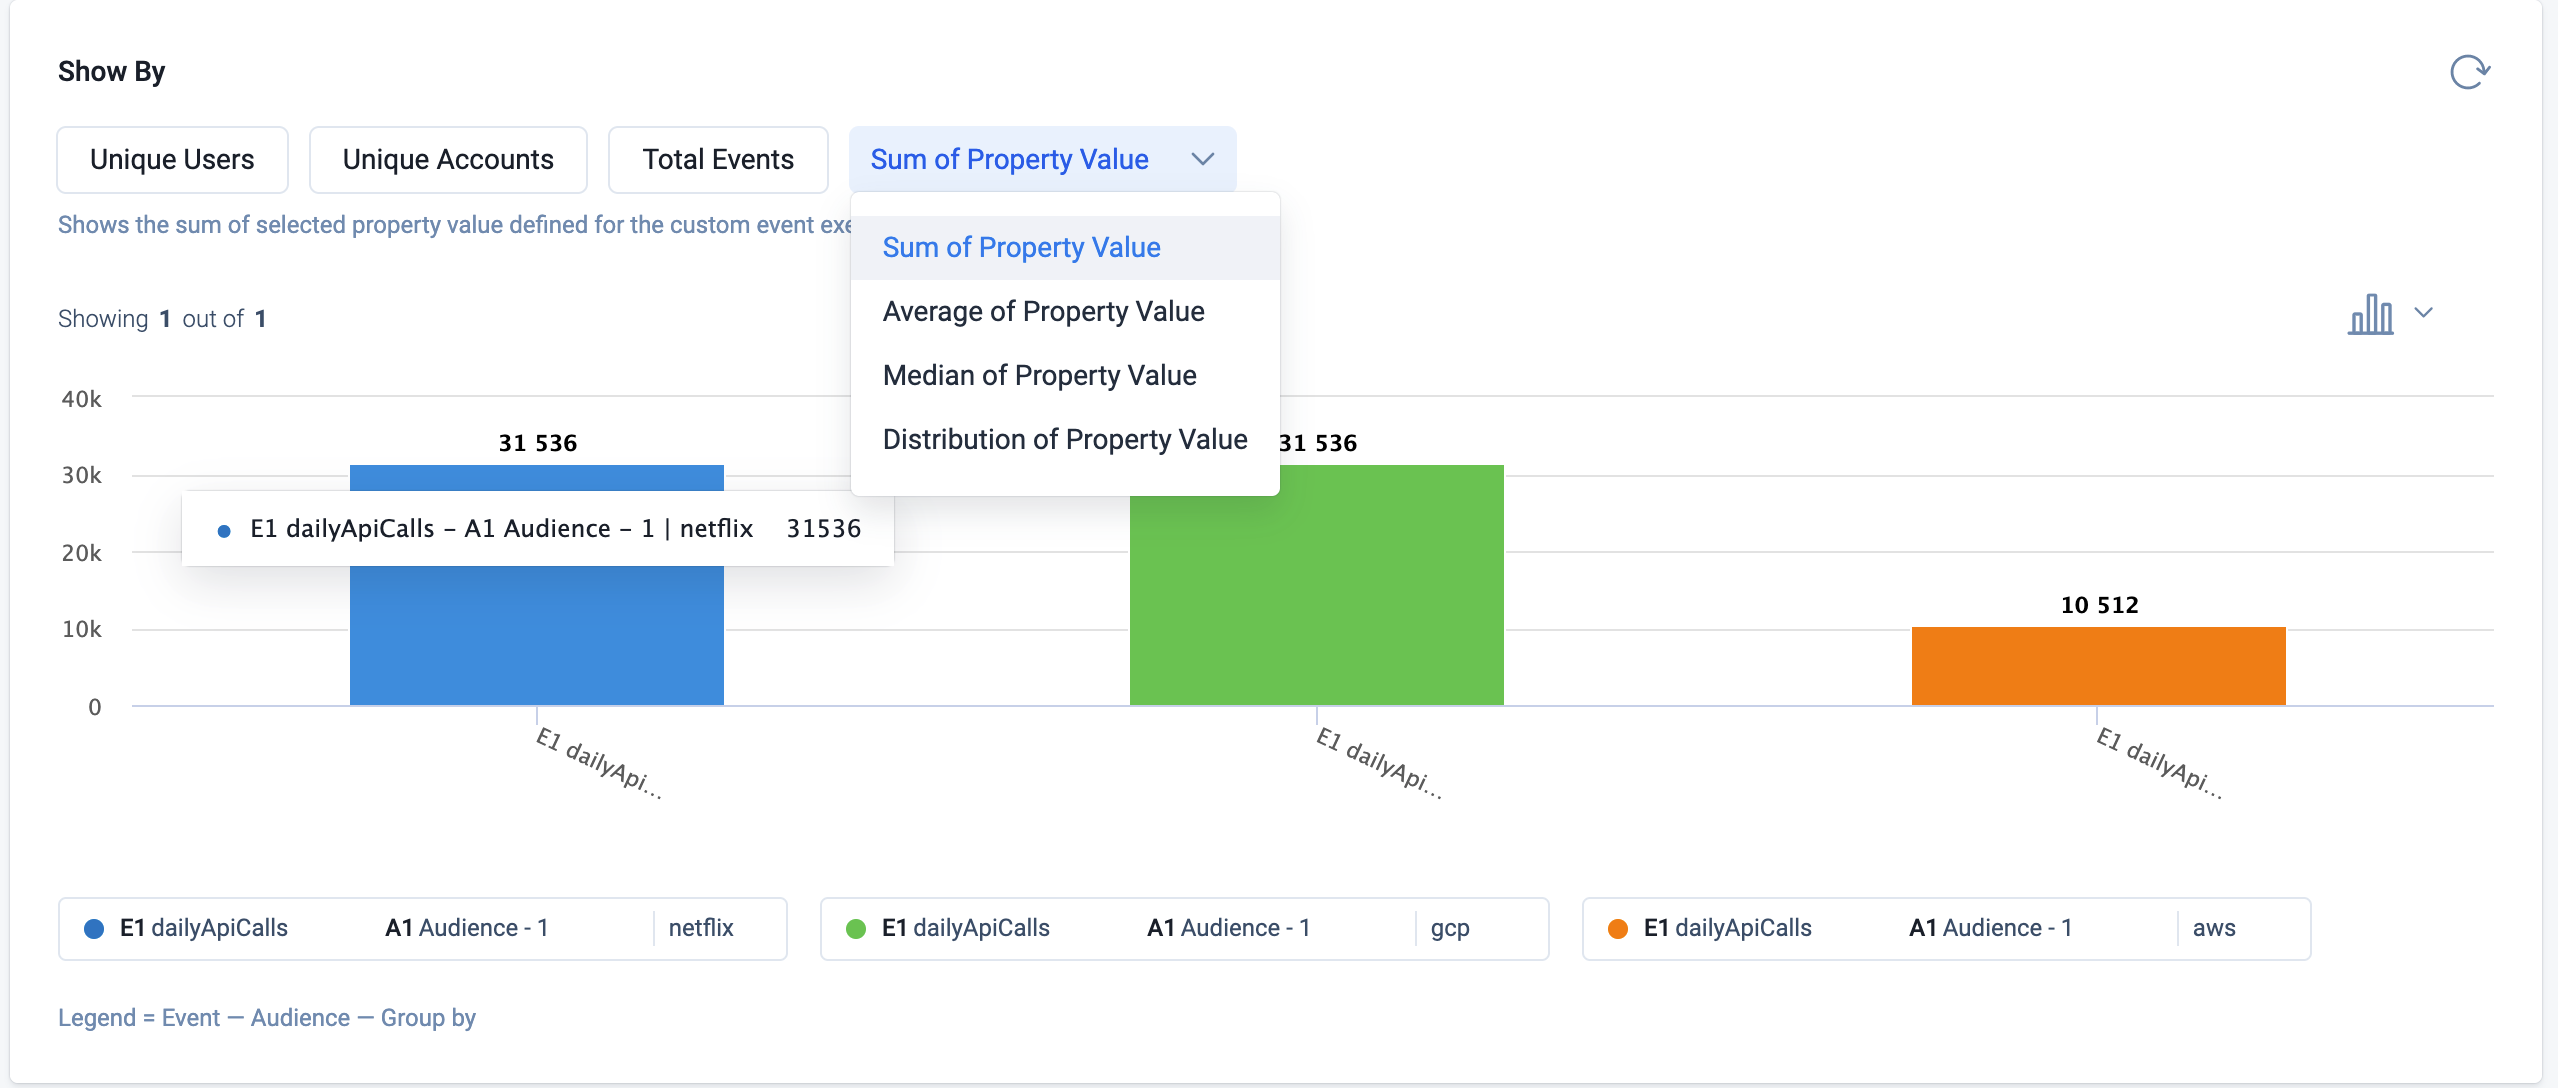
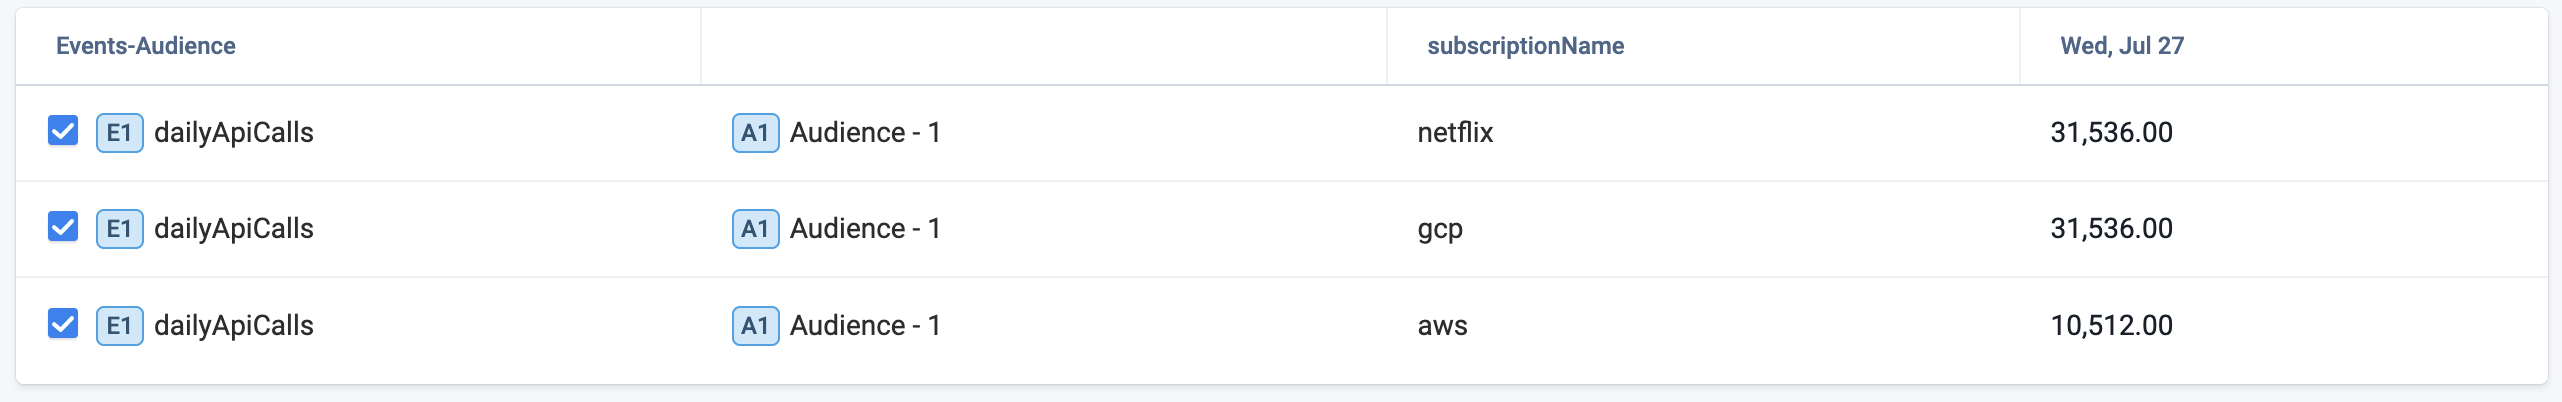
Analyzing backend data can be done via QueryBuilder using its event property Sum and Average functionality
How to measure daily aggregated metric
- Use Sum or Average functionality when selecting a date range with a Daily scope
- Use Average when using Weekly or Monthly scopes. Sum should not be used as it will aggregate daily into a week or month period which will present a 7X or 30X multiple of the daily metric.
To learn about all frequently asked questions, refer Analytics FAQs article from the Additional Resources section.