Understand Engagement Analytics
This article provides an overview of Engagement performance reports available in Gainsight PX.
Overview
The Analytics section in PX gives you a comprehensive analysis of the performance of your engagements. You can see the number of views of the engagement, completion rate, launched environment, and more.
Gainsight PX supports the following types of engagement analytics reports:
- In App Performance
- Email Performance
- Survey Performance
- Knowledge Center
In App Performance
The In App Performance reports displays all the analytics data for dialog, slider, and guide engagements, including their views. A comprehensive summary widget is available in the top section of the report. This widget helps to view the different metrics such as engagement Views, Unique Views, CTA, number of Completed engagements, Completion Rate, and CTA/Unique Views. You can also filter and group the details to slice and dice the data for better insights.
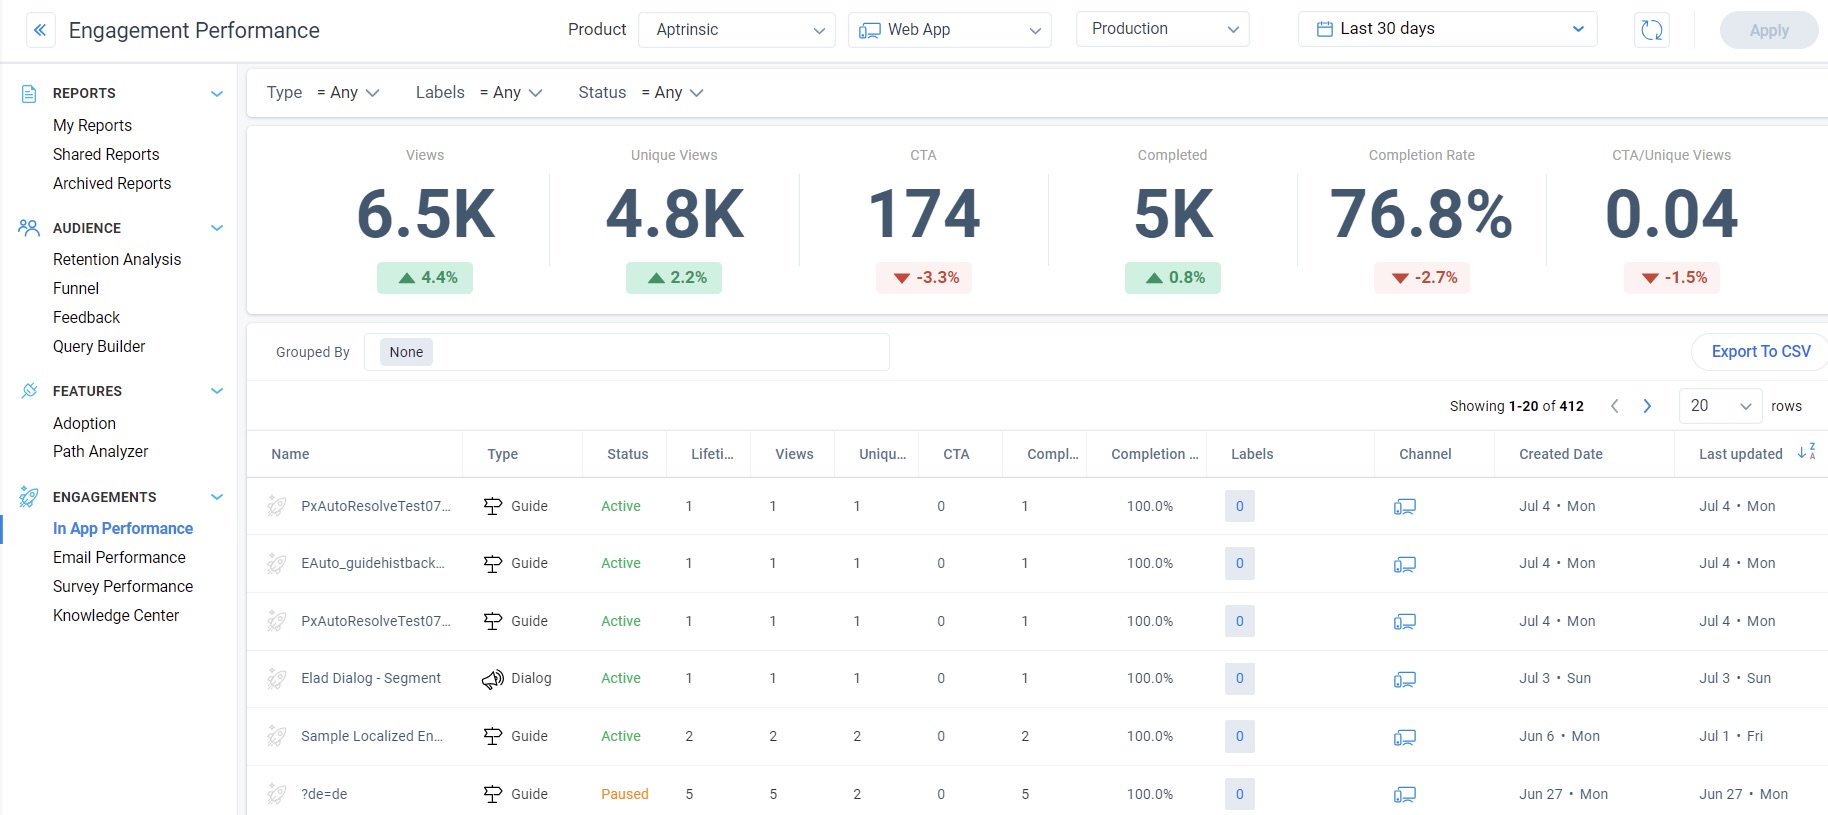
To view detained analysis of a specific engagement, click the name of the engagement. The analysis of an engagement is available in the following two tabs:
- Engagement Summary
- CTA Analytics
Engagement Summary
For an engagement, you can click the engagement, to display views of the engagement on a weekly basis (you can change this to a different frequency), in graphical format. You can also view the details of the users and the number of views for each user, and view a breakdown of users who viewed each of the slides or steps in case of slider and guide engagements.
To download the engagement information, click Export CSV to export the engagement analytics data as a CSV file for deeper analysis.For more information about various columns and widgets, refer to the Engagement Analytics section of the Analytics Data Dictionary article.
You can click an engagement to view the details in graphical format and also the list of users who viewed the engagement. The In App Performance report provides analytics for the following types of engagements:
Guide Engagement Analytics
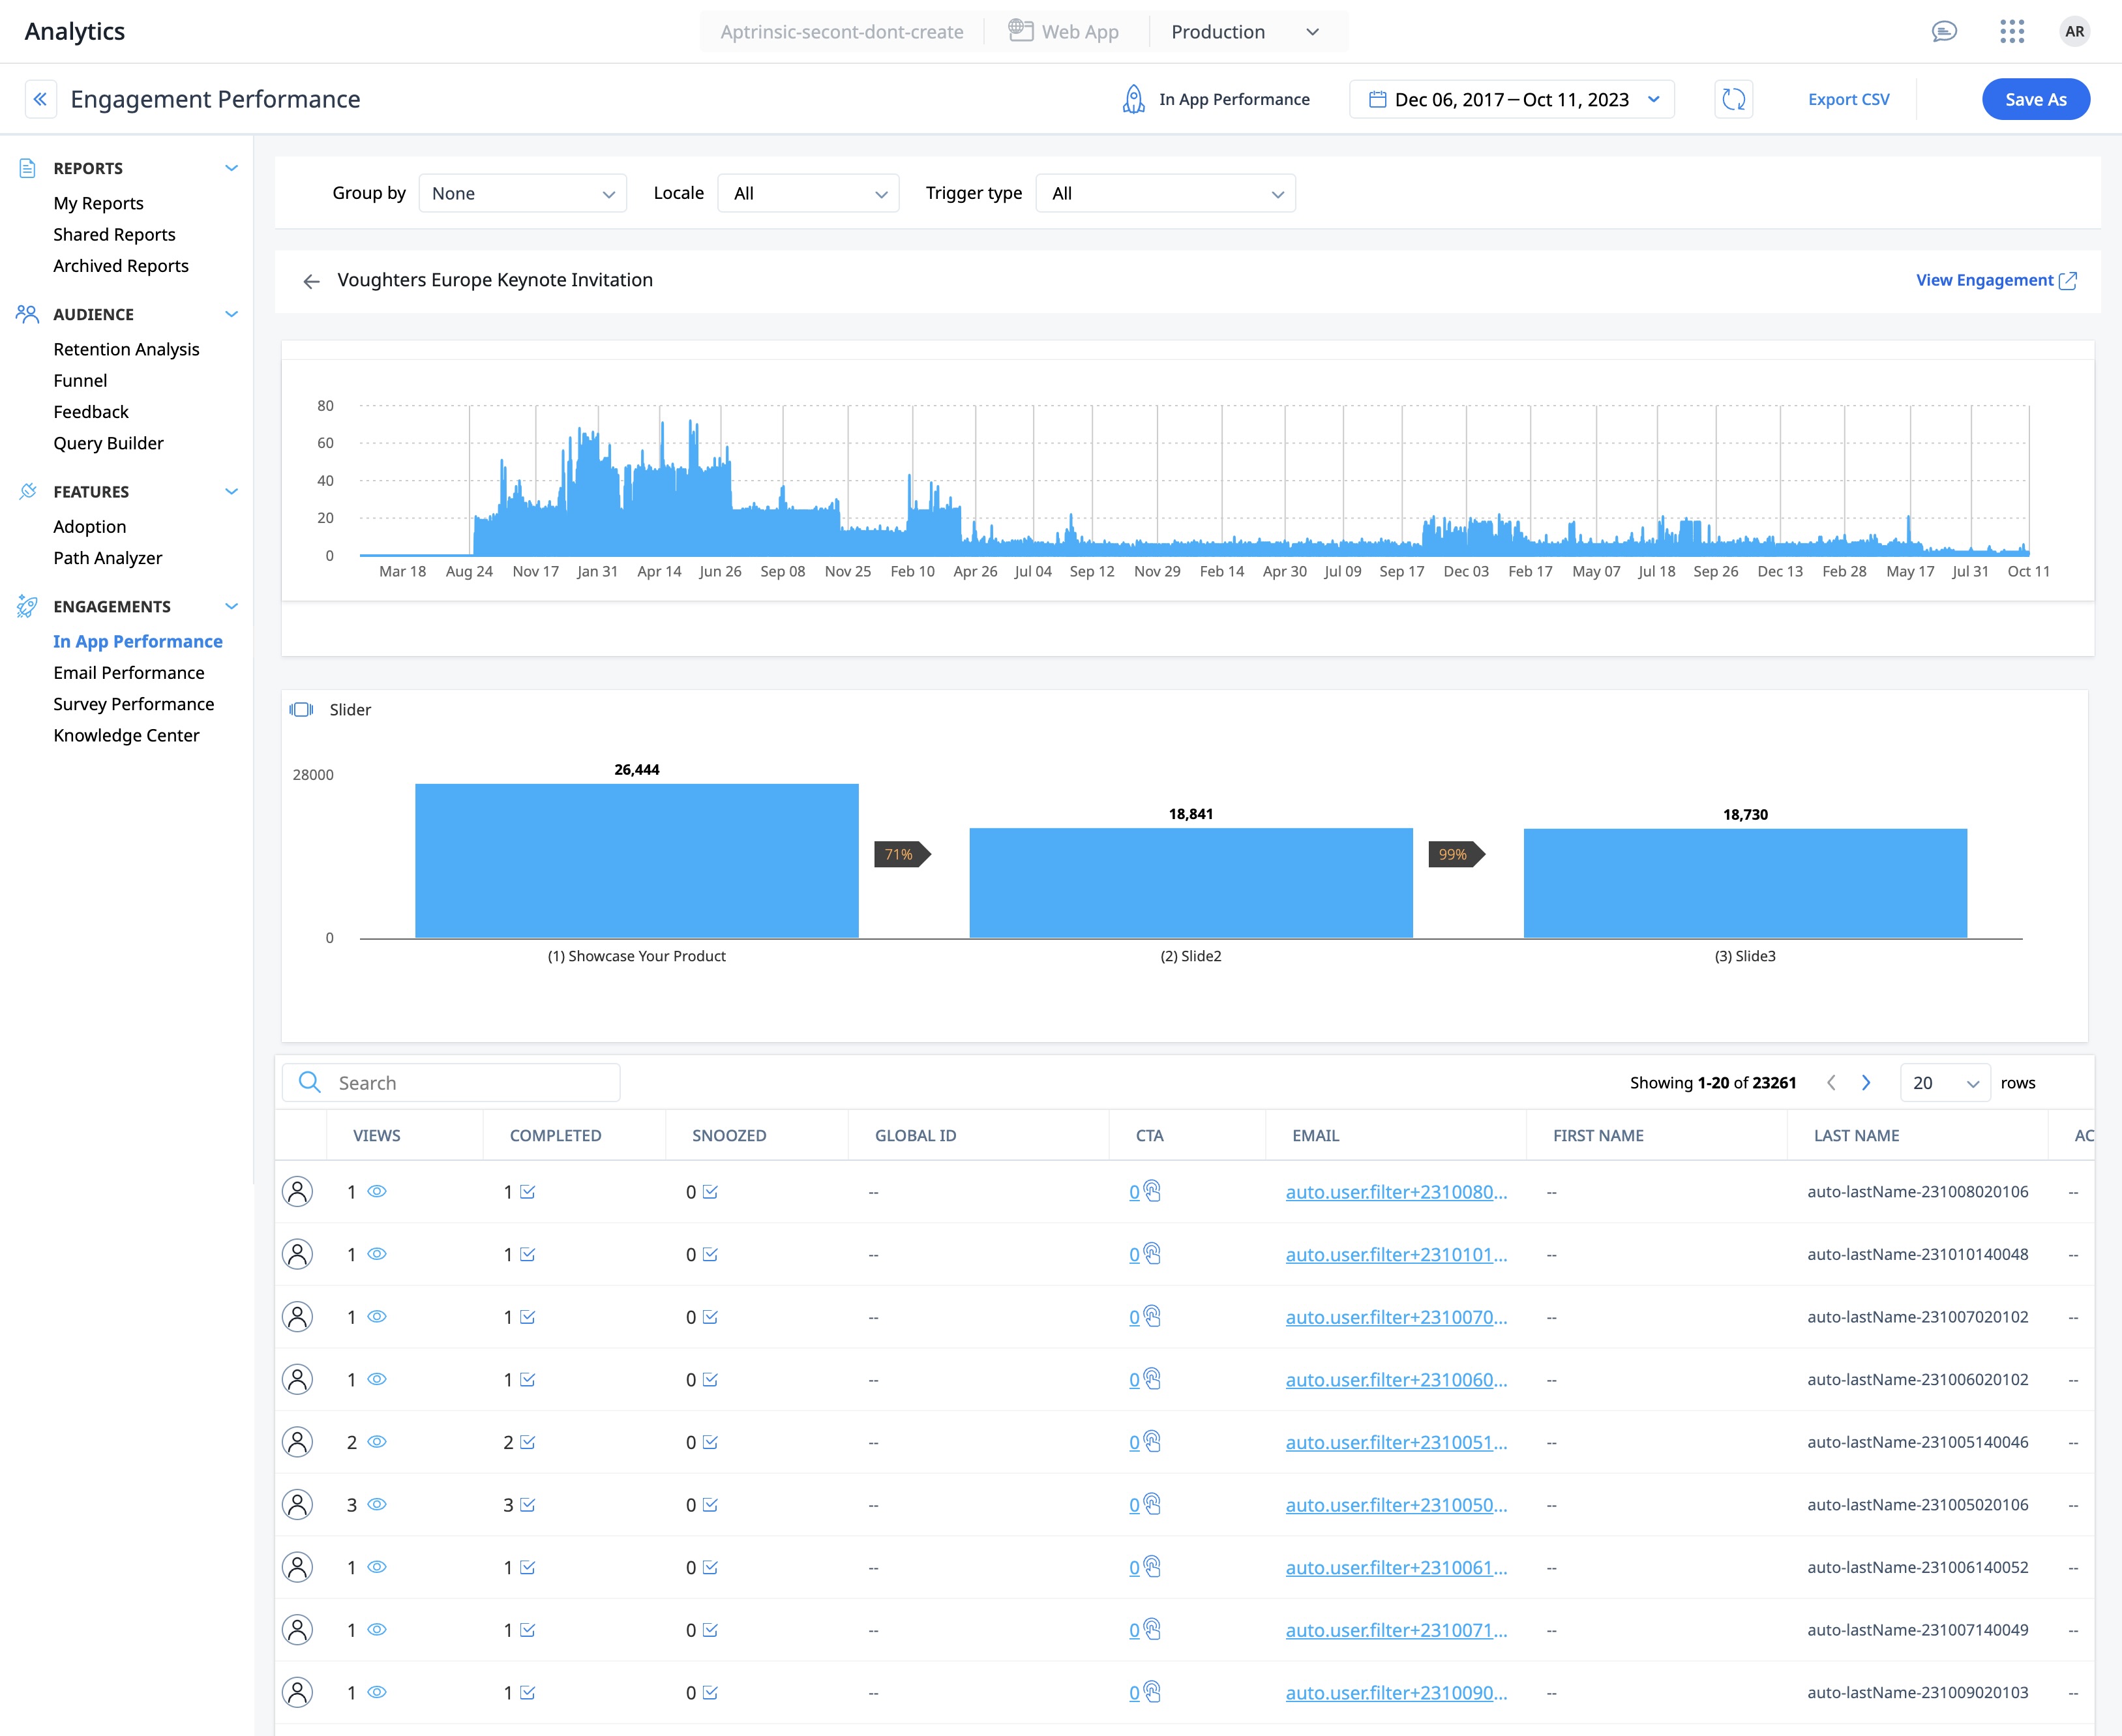
The In App Performance section provides you with detailed analytics representing how users are responding to guide engagements in your subscription.
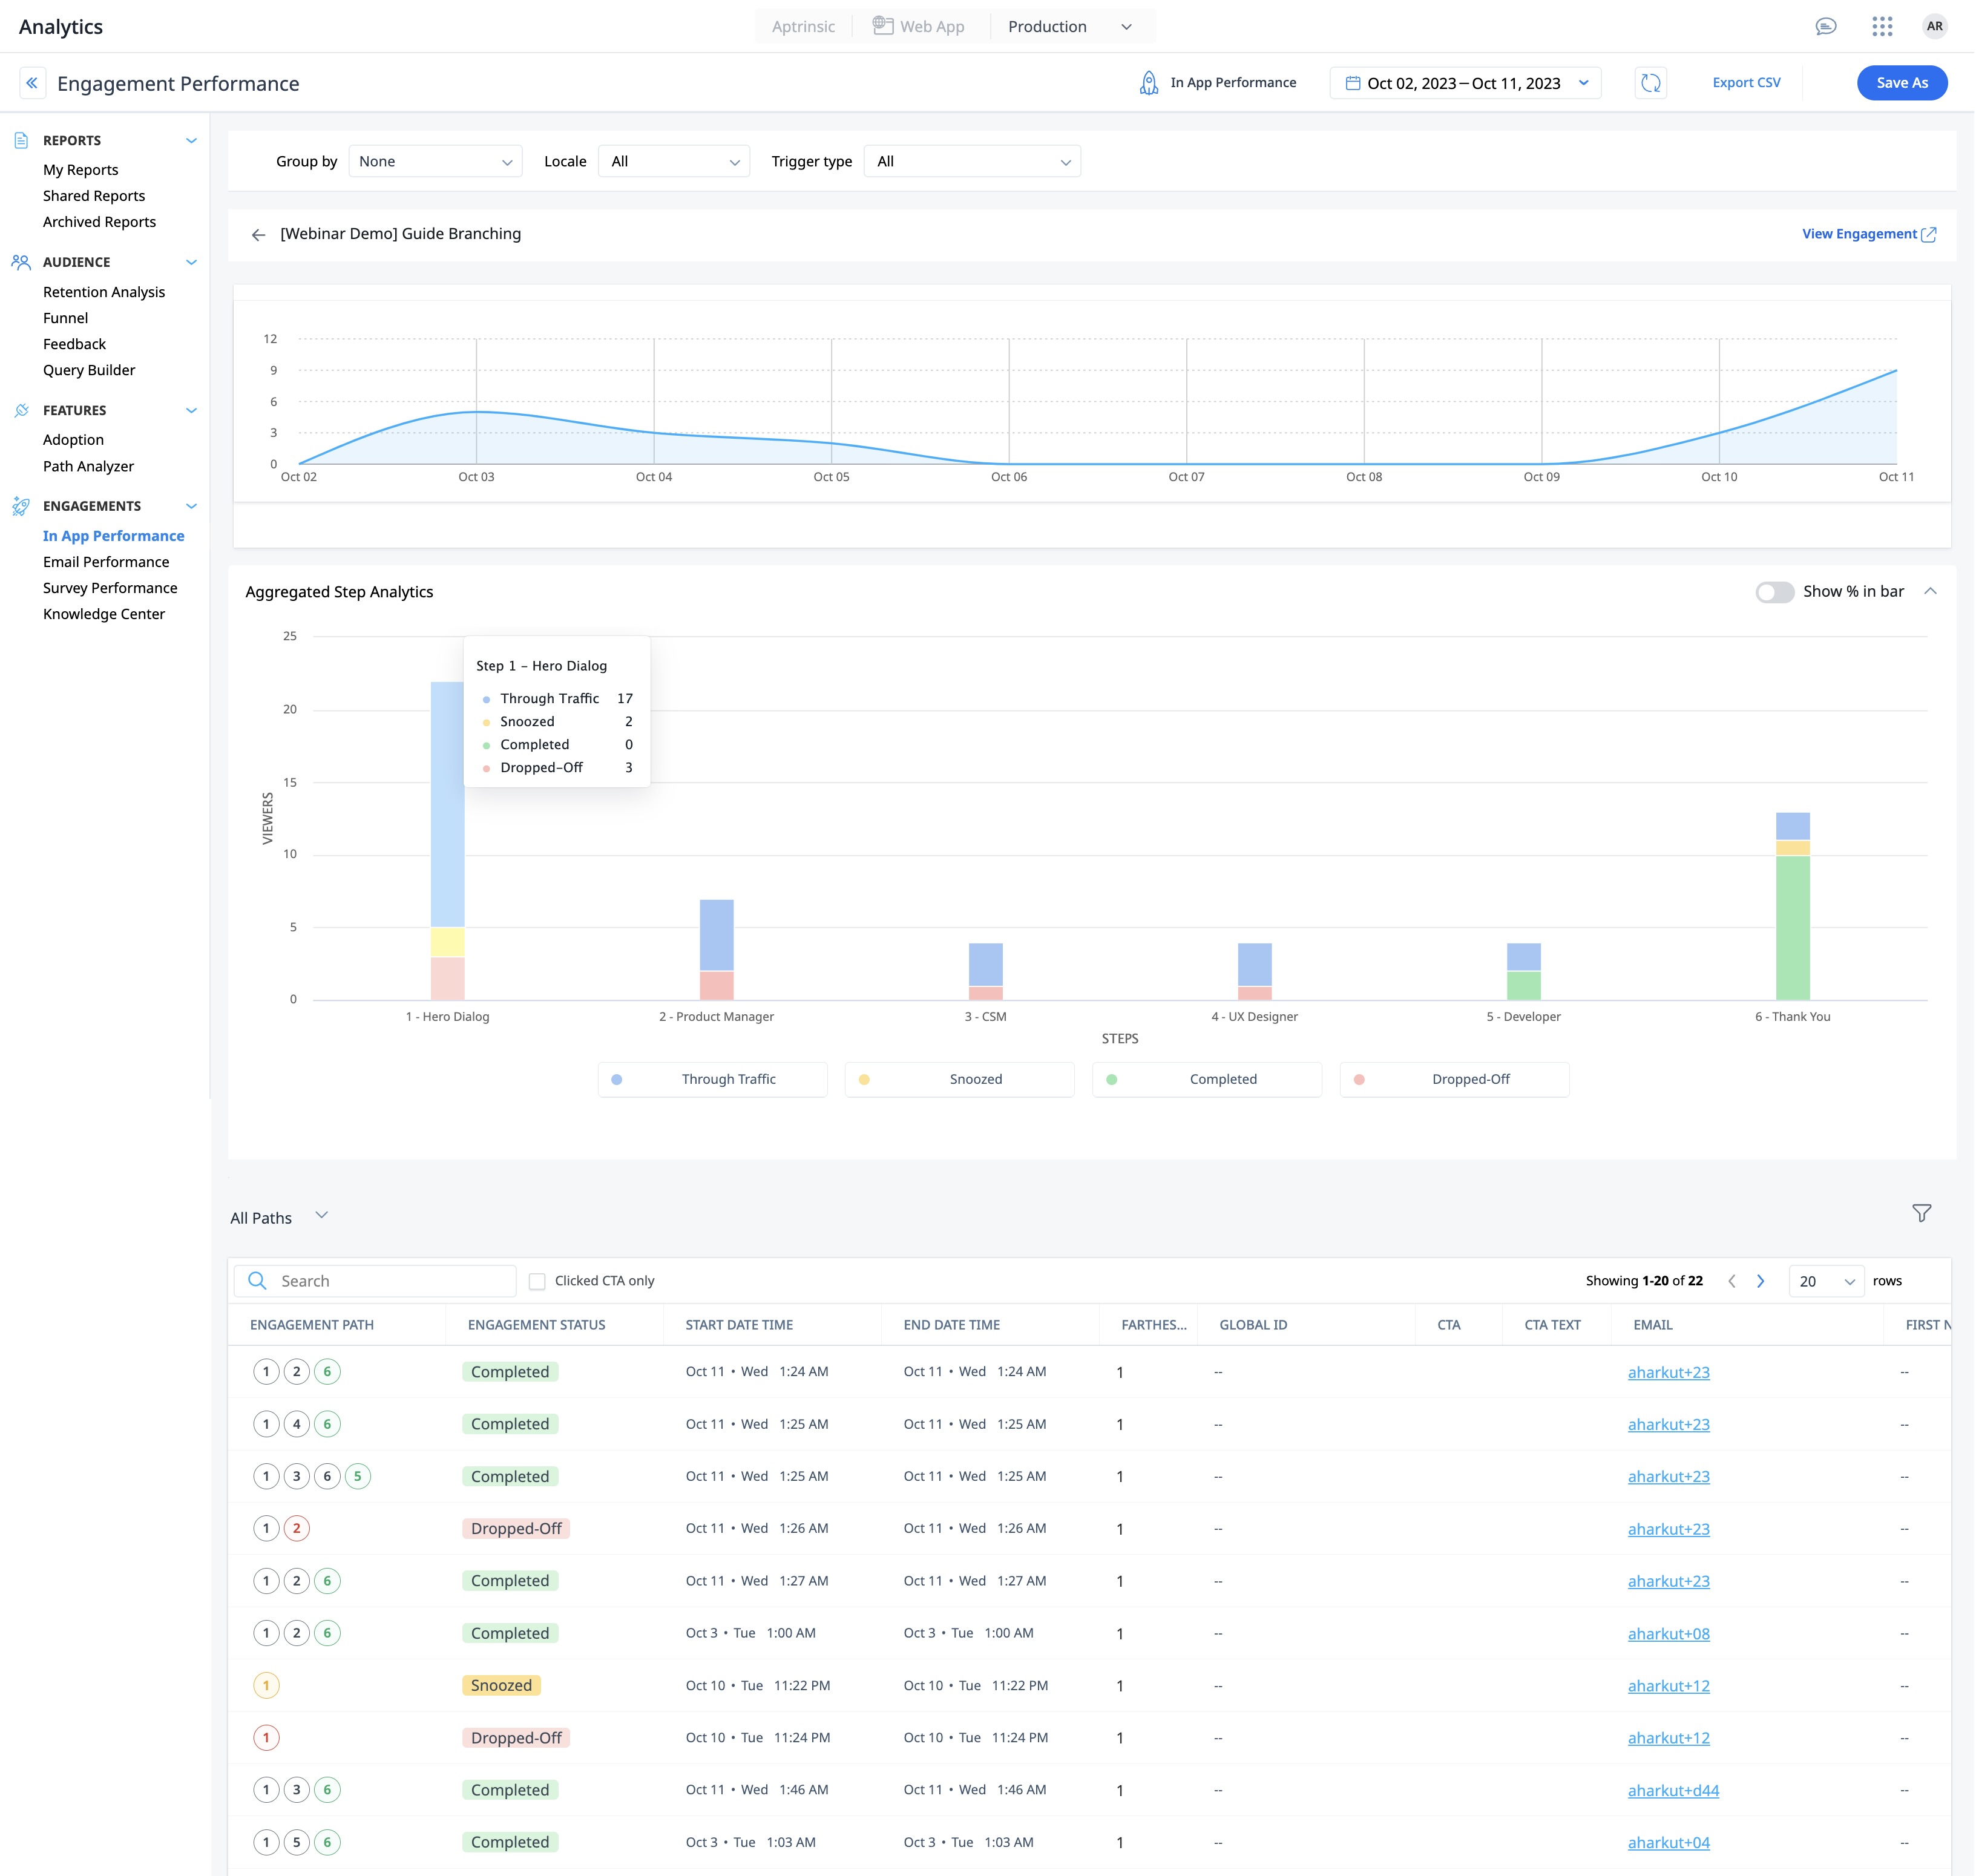
The analytics for guide engagements has the following sections:
- Engagement view summary: Line chart representing the number of users who have viewed the engagement, over the selected time period.
- Aggregated Step Analytics: Bar chart representing detailed user activity (pass-through, snoozed, completed, dropped-off) on each step of the guide engagement as follows:
- Through Traffic: Users who navigated or moved on to the next step in the engagement.
- Snoozed: Users who clicked the configured snooze button to view the engagement later.
- Completed: Users who performed an action that triggered the engagement completion. This could either be clicking a button that closes the engagement, or viewing the last step of the guide.
Note: In a single step guide, Completed means the user actively engaged with the guide, either by clicking a button to close it (such as x or Got It) or by interacting with any navigational buttons presented in the guide, signifying they have finished the engagement. - Dropped-Off: Users who left the engagement on that step.
Note: In a single-step guide, Dropped-Off refers to users who did not engage with the guide at all. This can happen if the user navigates to another page in the application, refreshes the current page, or closes the browser window without interacting with the guide.
- Path and user information: A list of users categorized by:
- Paths: List of users and their detailed information, primarily categorized by the sequence of steps they interacted with.
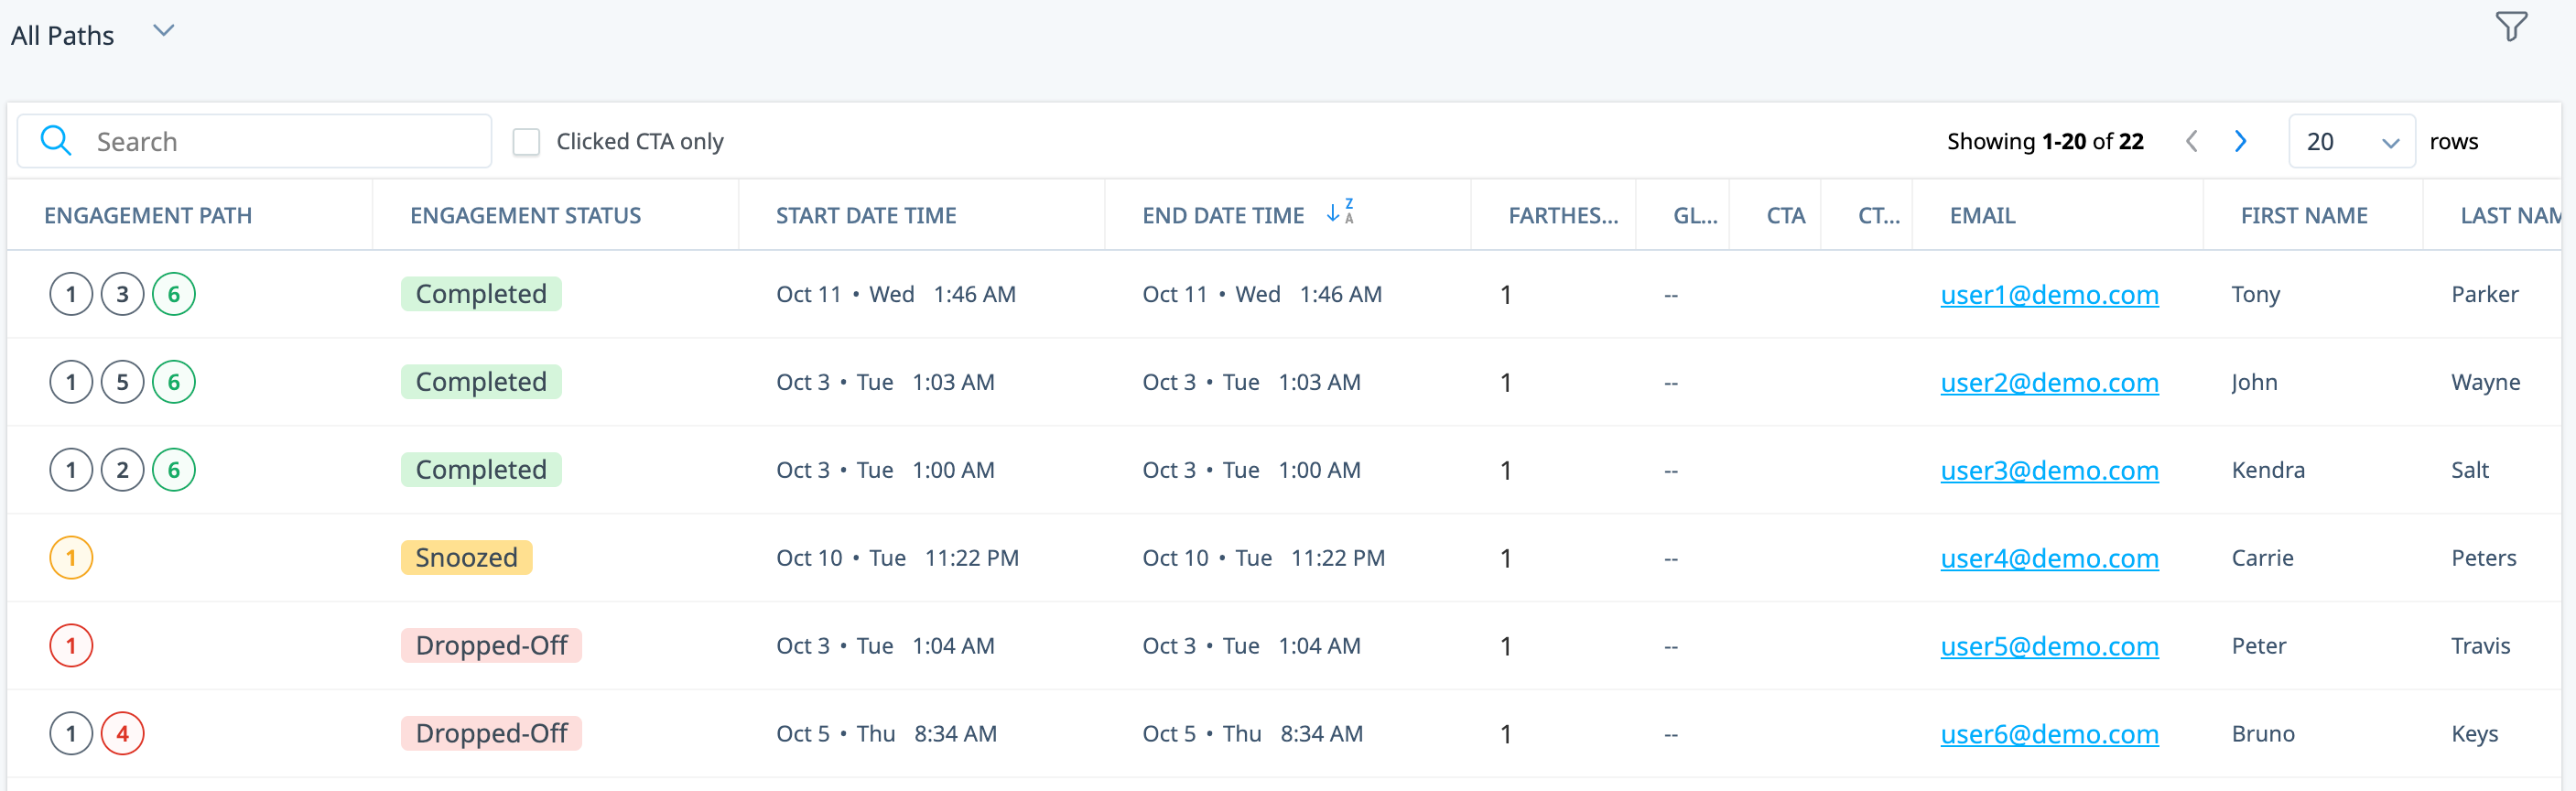
In the above example, the first three users completed the guide engagement, each following a different sequence of steps. The fourth user snoozed the engagement at the first step, whereas the last users quit the engagement at different places in the flow.
- Consider a scenario where a user restarted the engagement (for instance, using the Start Over button), or revisits a previous step in the engagement. In such instances, PX consolidates the distinct steps the user has interacted with into one path, instead of generating separate paths for each sequence the user has engaged with.
- In case a step is removed from the engagement, that step would be replaced by a dash, and the rest of the steps numbers updated accordingly.
- In case the order of the steps in the engagement are changed, the step numbers are automatically updated in Analytics.
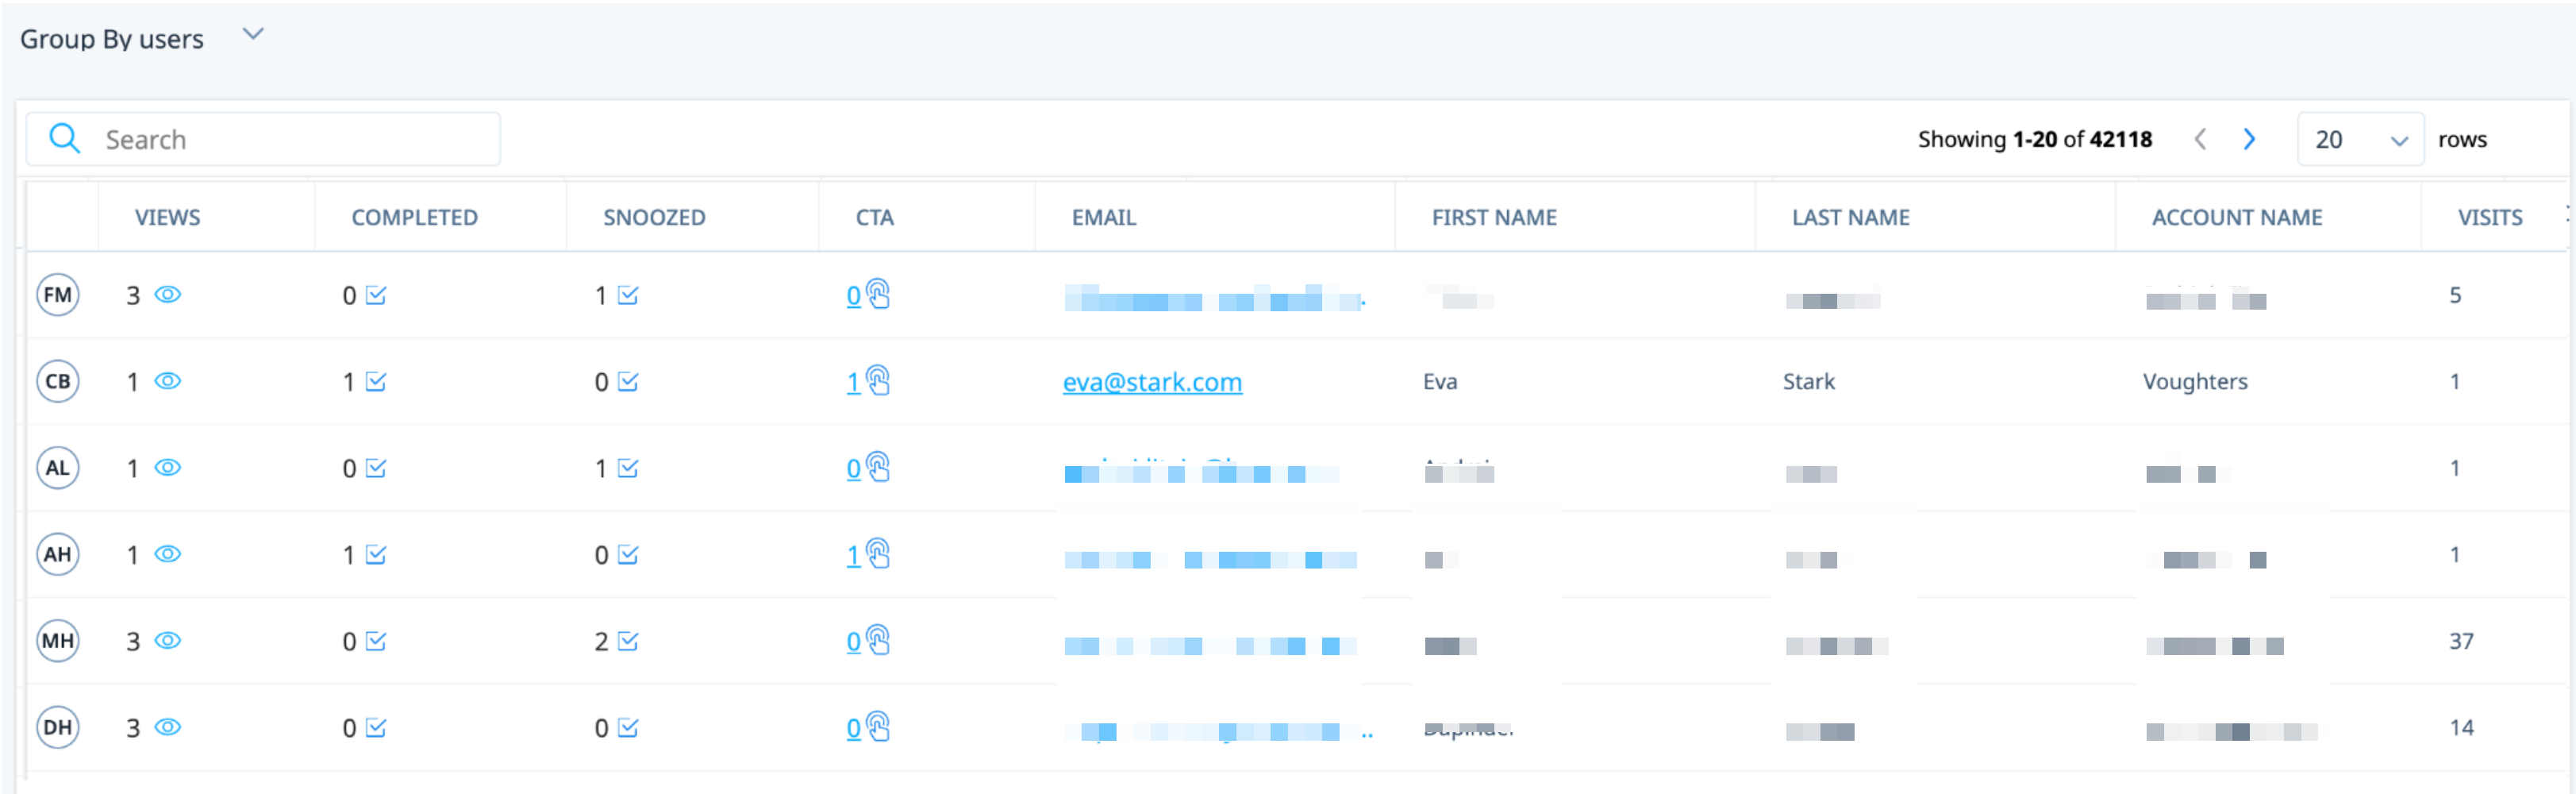
- Users: List of users who interacted with the engagement, along with their detailed information.
Slider Engagement Analytics
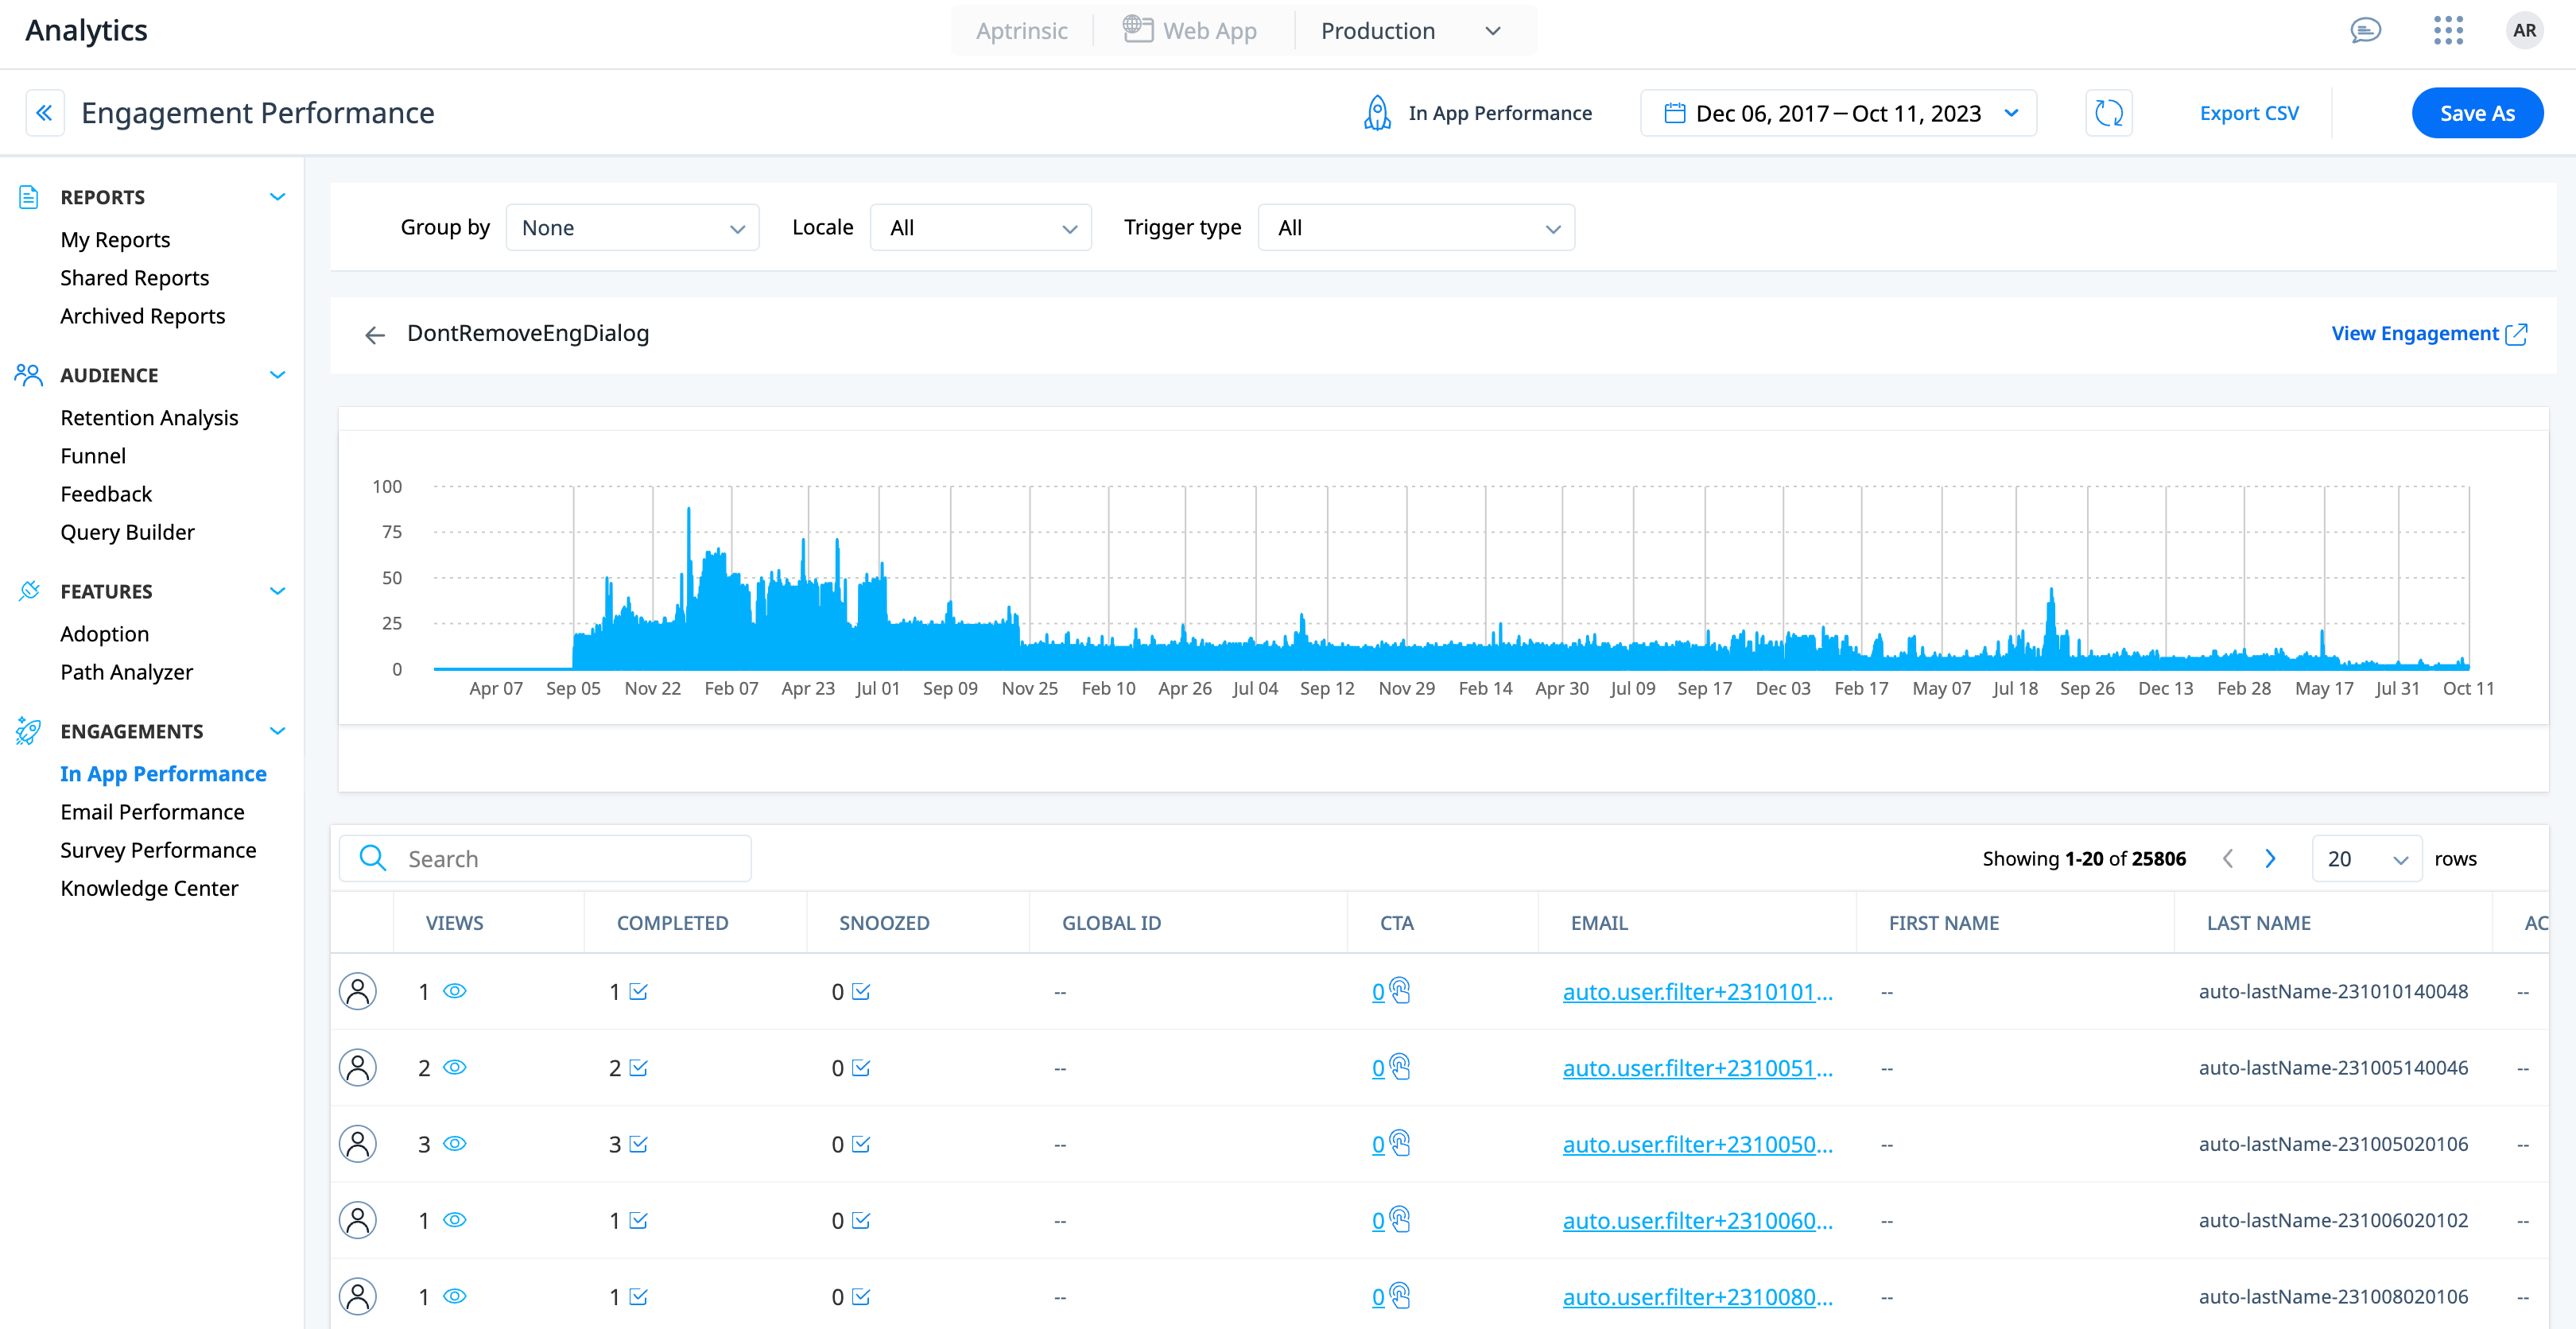
The In App Performance section provides you with detailed analytics representing how users are responding to slider engagements in your subscription.
The analytics for slider engagements has the following sections:
- Engagement view summary: Line chart representing the number of users who have viewed the engagement, over the selected time period.
- Slider step analytics: Bar chart representing each slide of the engagement, with the number of users that interacted with the steps.
- User information: List of users who interacted with the engagement, along with their detailed information.
The slider engagement in the above image has a total of 3 steps. A total of 26,444 users viewed the guide. Of those 26,444 users, 18,841 users (71%) moved to the next step. Of the total users, 18,730 users moved to the third step. You can easily analyze where your users are dropping off and take appropriate actions.
Dialog Engagement Analytics
The In App Performance section provides you with detailed analytics representing how users are responding to dialog engagements in your subscription.
The analytics for dialog engagements has the following sections:
- Engagement view summary: Line chart representing the number of users who have viewed the engagement, over the selected time period.
- User information: List of users who interacted with the engagement, along with their detailed information.
Engagement CTA Analytics
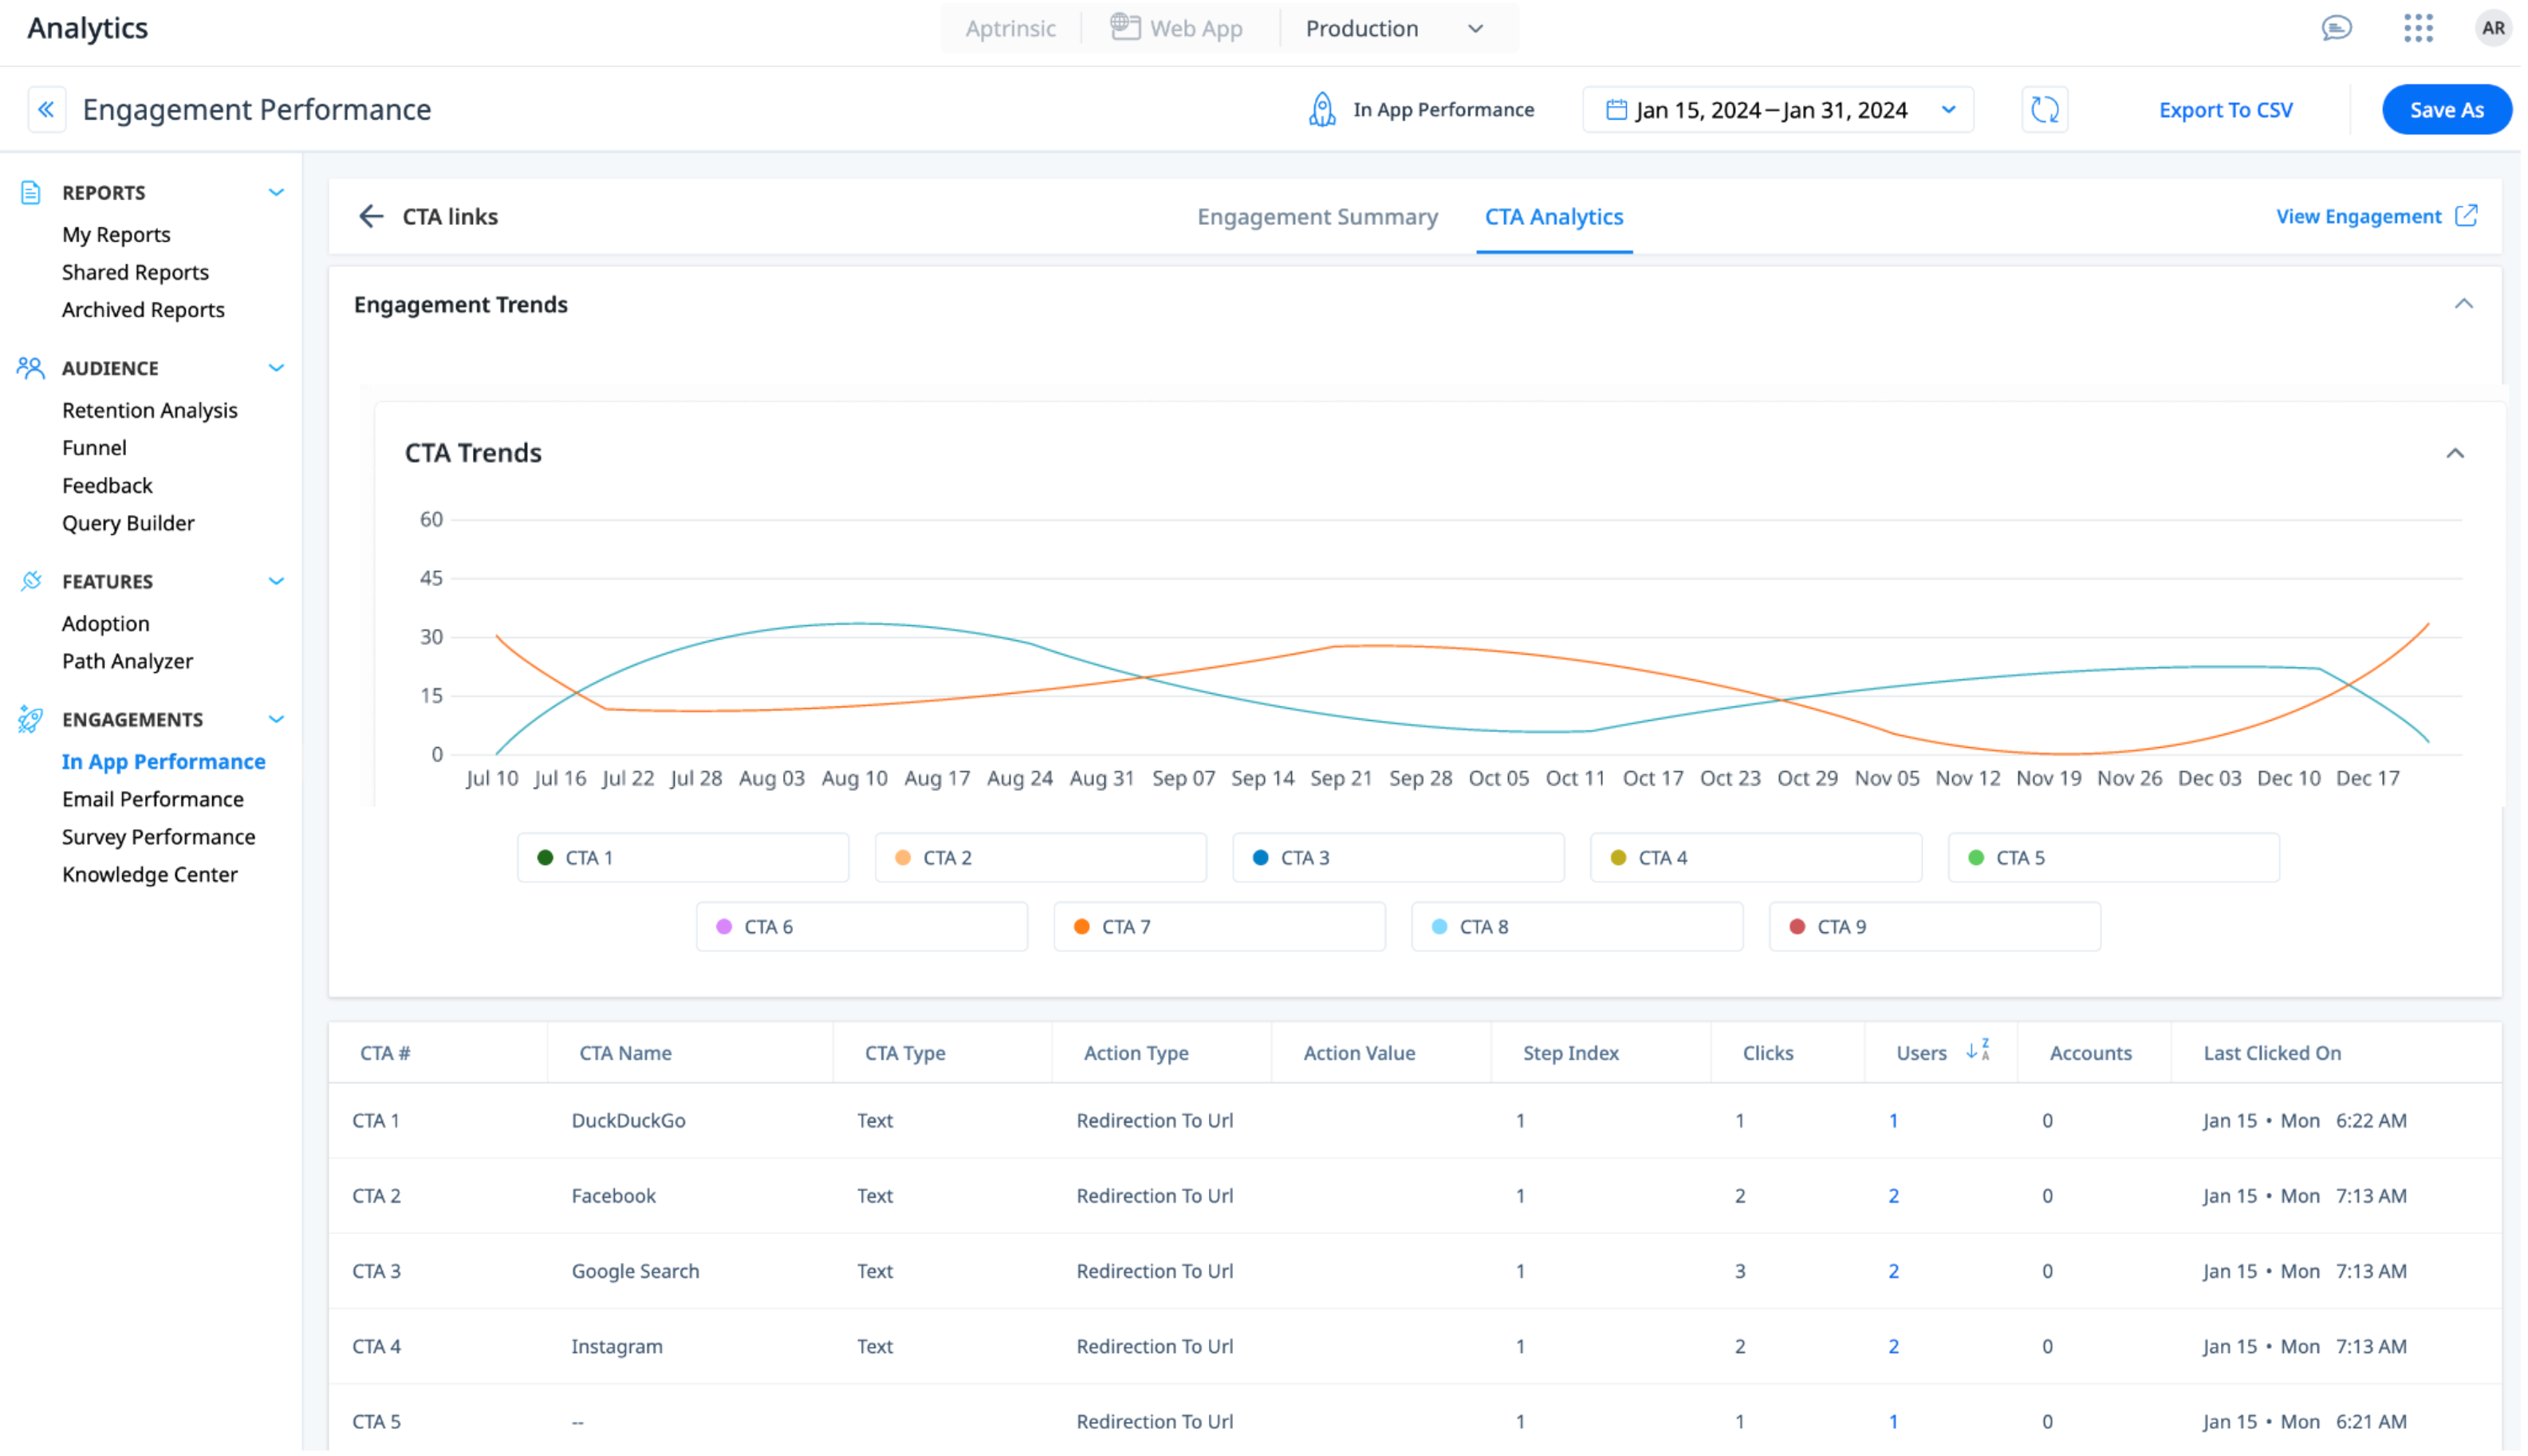
The CTA Analytics tab in In App Performance is designed to provide deeper insights into each Call to Actions (CTAs) of an engagement. For each CTA in a guide, slider, or dialog engagement, you can view the following information:
- Name of the CTA
- Type of CTA (for instance, text, button, or image) - Only for V2 Guides
- The action value of the CTA (for example: Redirect URL on clicking a button CTA)
- Count of clicks
- Information of the user who clicked the CTA
- Account information of the user who clicked the CTA
- Timestamp details of when the CTA was last clicked
- Status change of CTA, if any, indicated by D (deleted) or C (modified) tags.
You can drill-down on the CTAs with which a user has interacted, allowing you to identify the CTAs that are resonating with your users. Additionally, a summary of user-interacted CTAs is available to provide a comprehensive overview of user engagement across all CTAs.
In-App CTA Analytics is not available for Slider engagements on Desktop.
For more information on frequently asked questions on CTA Analytics, refer to the In-App CTA Analytics section of the Analytics FAQ article.
Engagement Goals Analytics
The Goals tab in In-App Performance helps you measure whether your engagement is driving the intended user actions. It provides visibility into goal performance, conversion, and user-level outcomes based on the defined goal.
For more information on how to define goals for an engagement, refer to the Anatomy of Engagements article.

For each goal configured in an engagement, you can view the following information:
- Goal definition (feature or custom event being tracked)
- Engagement state (Viewed or Completed) used to start tracking the goal
- Time window within which the goal must be achieved
The Goal Metrics section provides a summary of overall goal performance:
- Goal Completion Rate: Percentage of users who achieved the goal after interacting with the engagement
- Total Exposed Users: Number of users who viewed or completed the engagement and are eligible for goal tracking
- Total Converted Users: Number of users who achieved the goal within the defined time window
- Time-to-Conversion (TTC): Time taken by users to achieve the goal after interacting with the engagement
The List of Users section provides detailed insights at the user level. You can filter users based on goal status and create segments for follow-up actions. For each user, you can view:
- Views: Total number of times the user viewed the engagement.
- Completed: Total number of times the user completed the engagement.
- Snoozed: Total number of times the user snoozed the engagement.
- Last Viewed: Timestamp of the most recent time the user viewed the engagement.
- Last Completed: Timestamp of the most recent time the user completed the engagement.
- Goal Achieved On: Timestamp when the user achieved the goal. Displays a hyphen (-) if the goal is not achieved.
- Goal Status: Current goal state for the user:
- Active: User has interacted with the engagement, and the goal is still within the defined time window, meaning it has not yet expired and is still being measured.
- Achieved: User completed the goal within the defined time window after interacting with the engagement
- Not Achieved: User did not complete the goal within the defined time window after interacting with the engagement
- User ID: Unique identifier for the user.
- Account ID: Unique identifier for the account associated with the user.
- Engagement Status: Latest interaction state of the user with the engagement (for example, Viewed, Completed, Snoozed, Skipped).
- Time to Completion: Time taken by the user to achieve the goal after interacting with the engagement.
Email Performance
The Email Performance report provides analytics for email engagements. Click the Email Performance report to view a comprehensive summary of all your email engagements.
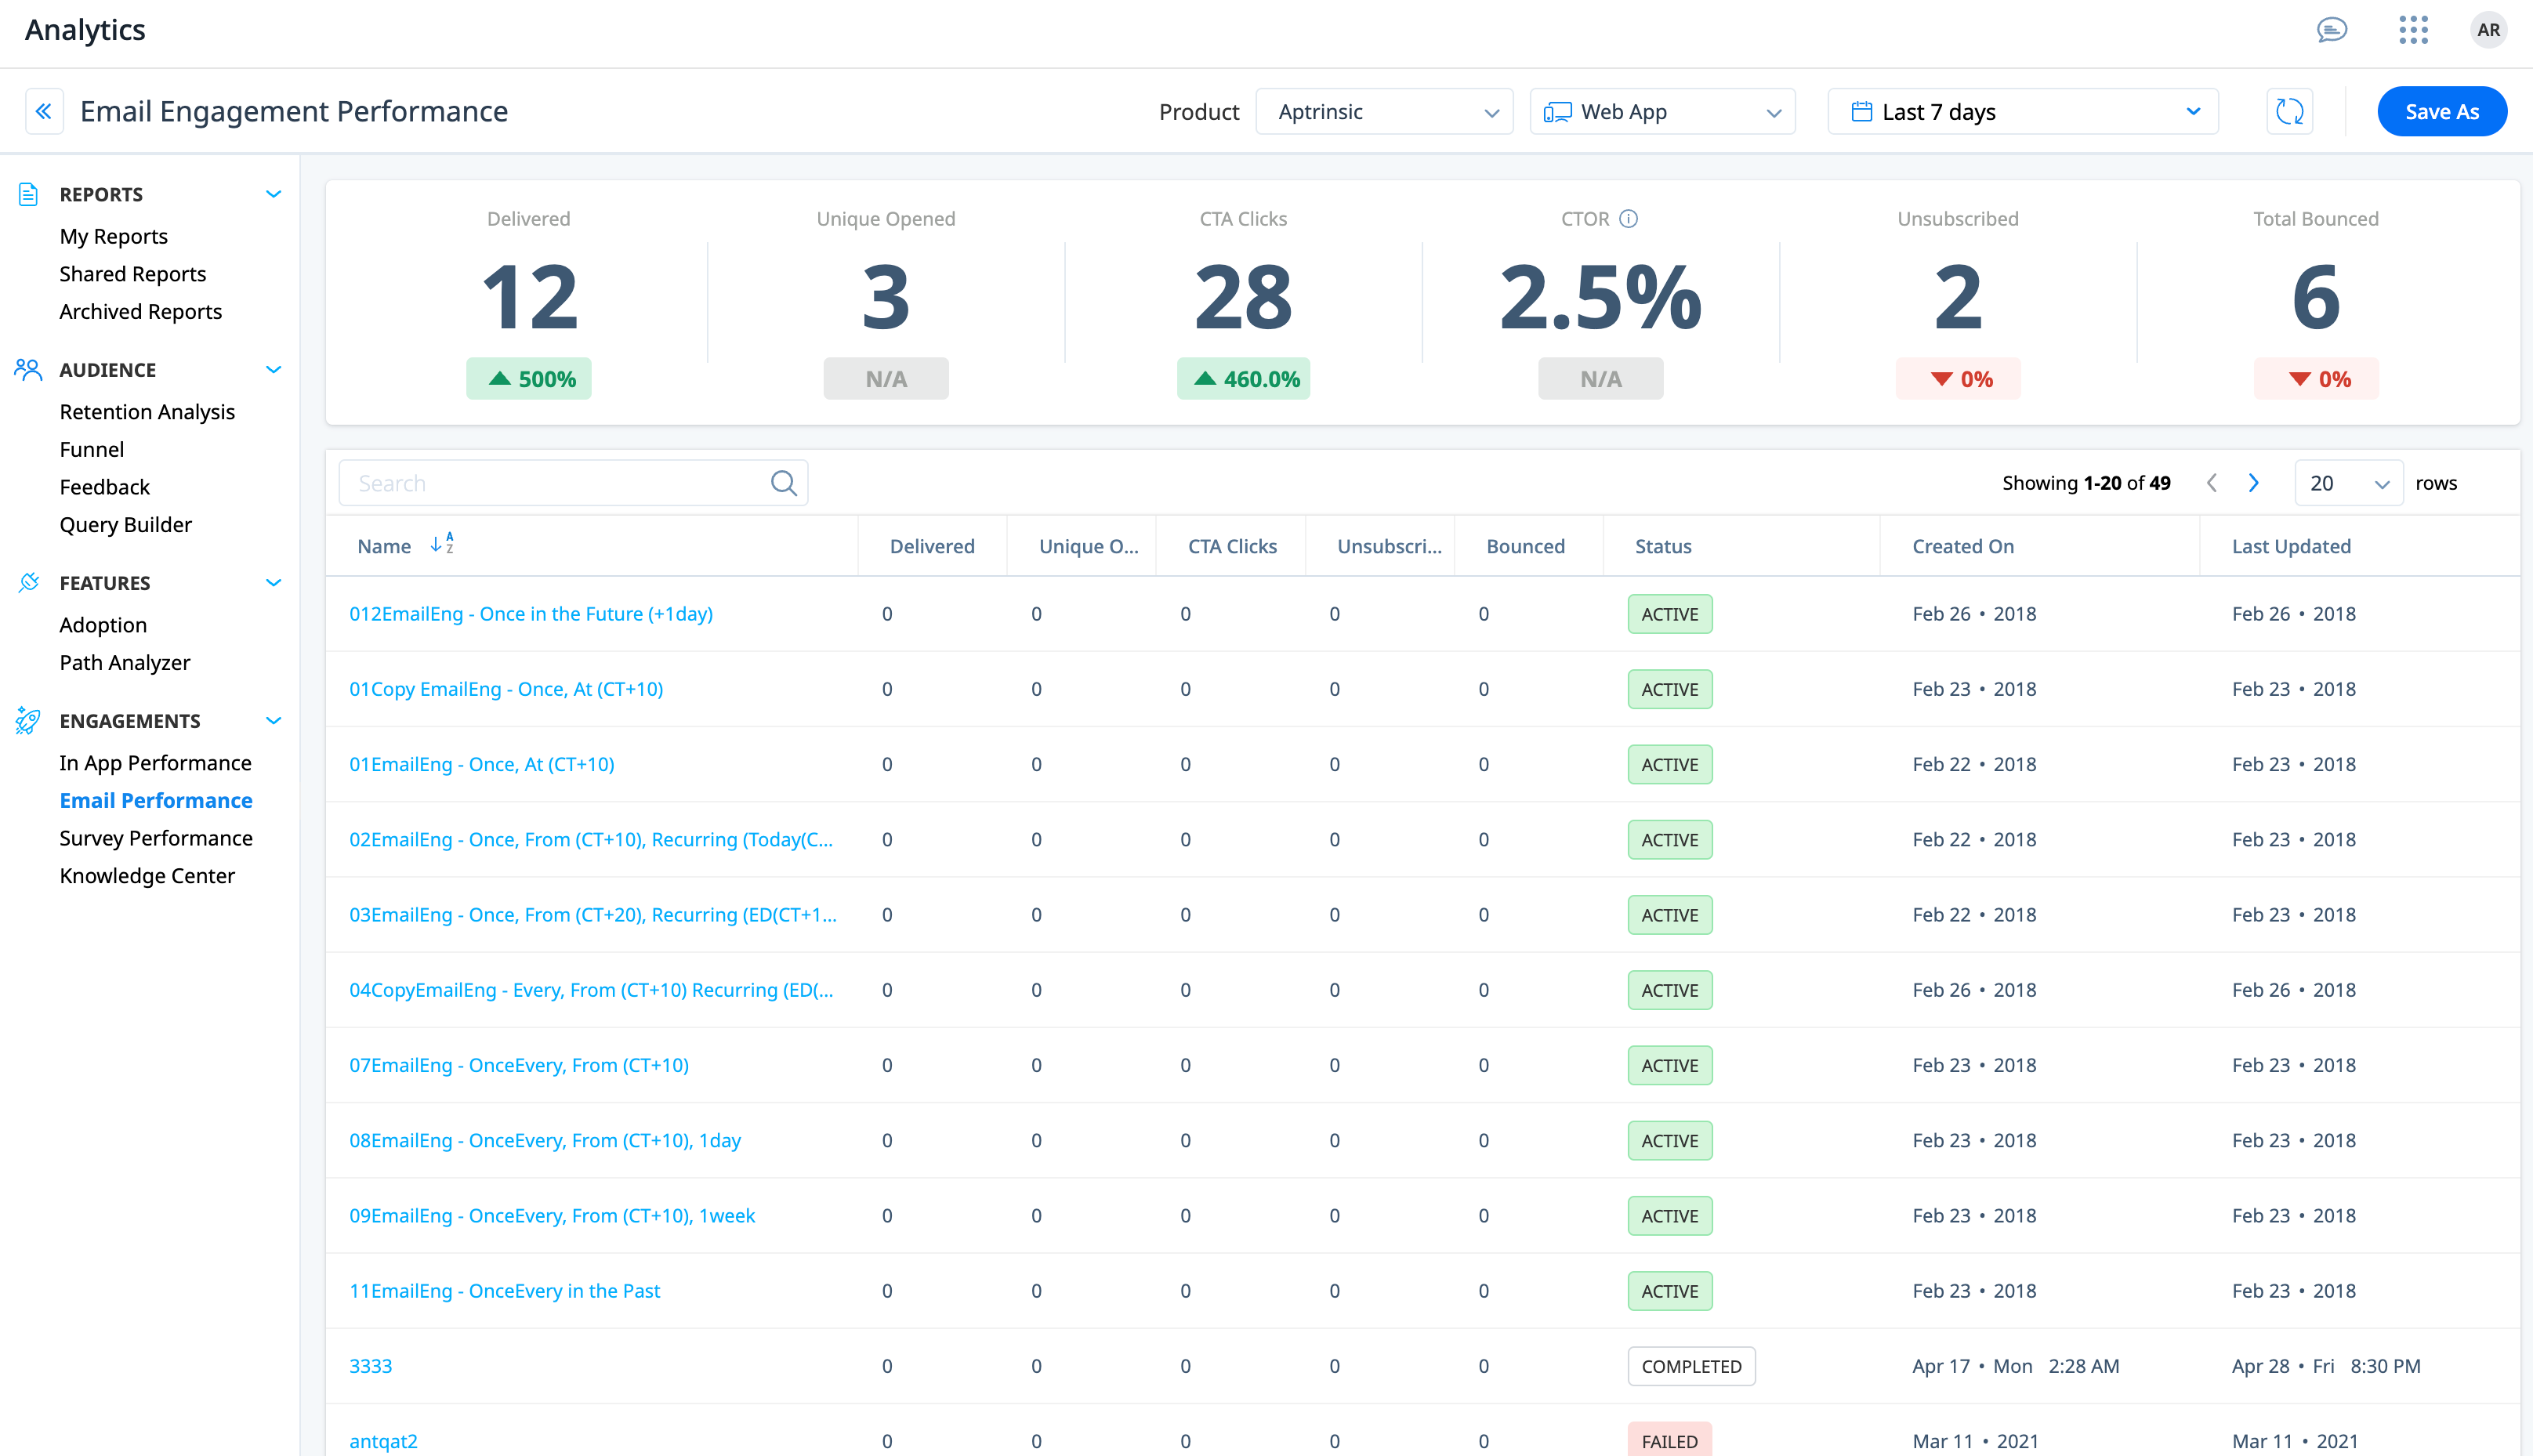
The Email Engagement Performance page provides a summary of key metrics such as Delivered, Unique Opened, CTA Clicks, CTOR (Click-to-Open Rate), Unsubscribed, and Total Bounced across your email engagements, for a maximum of 180 days.
Click an email engagement to view the details in graphical format and also the list of users who viewed the engagement.
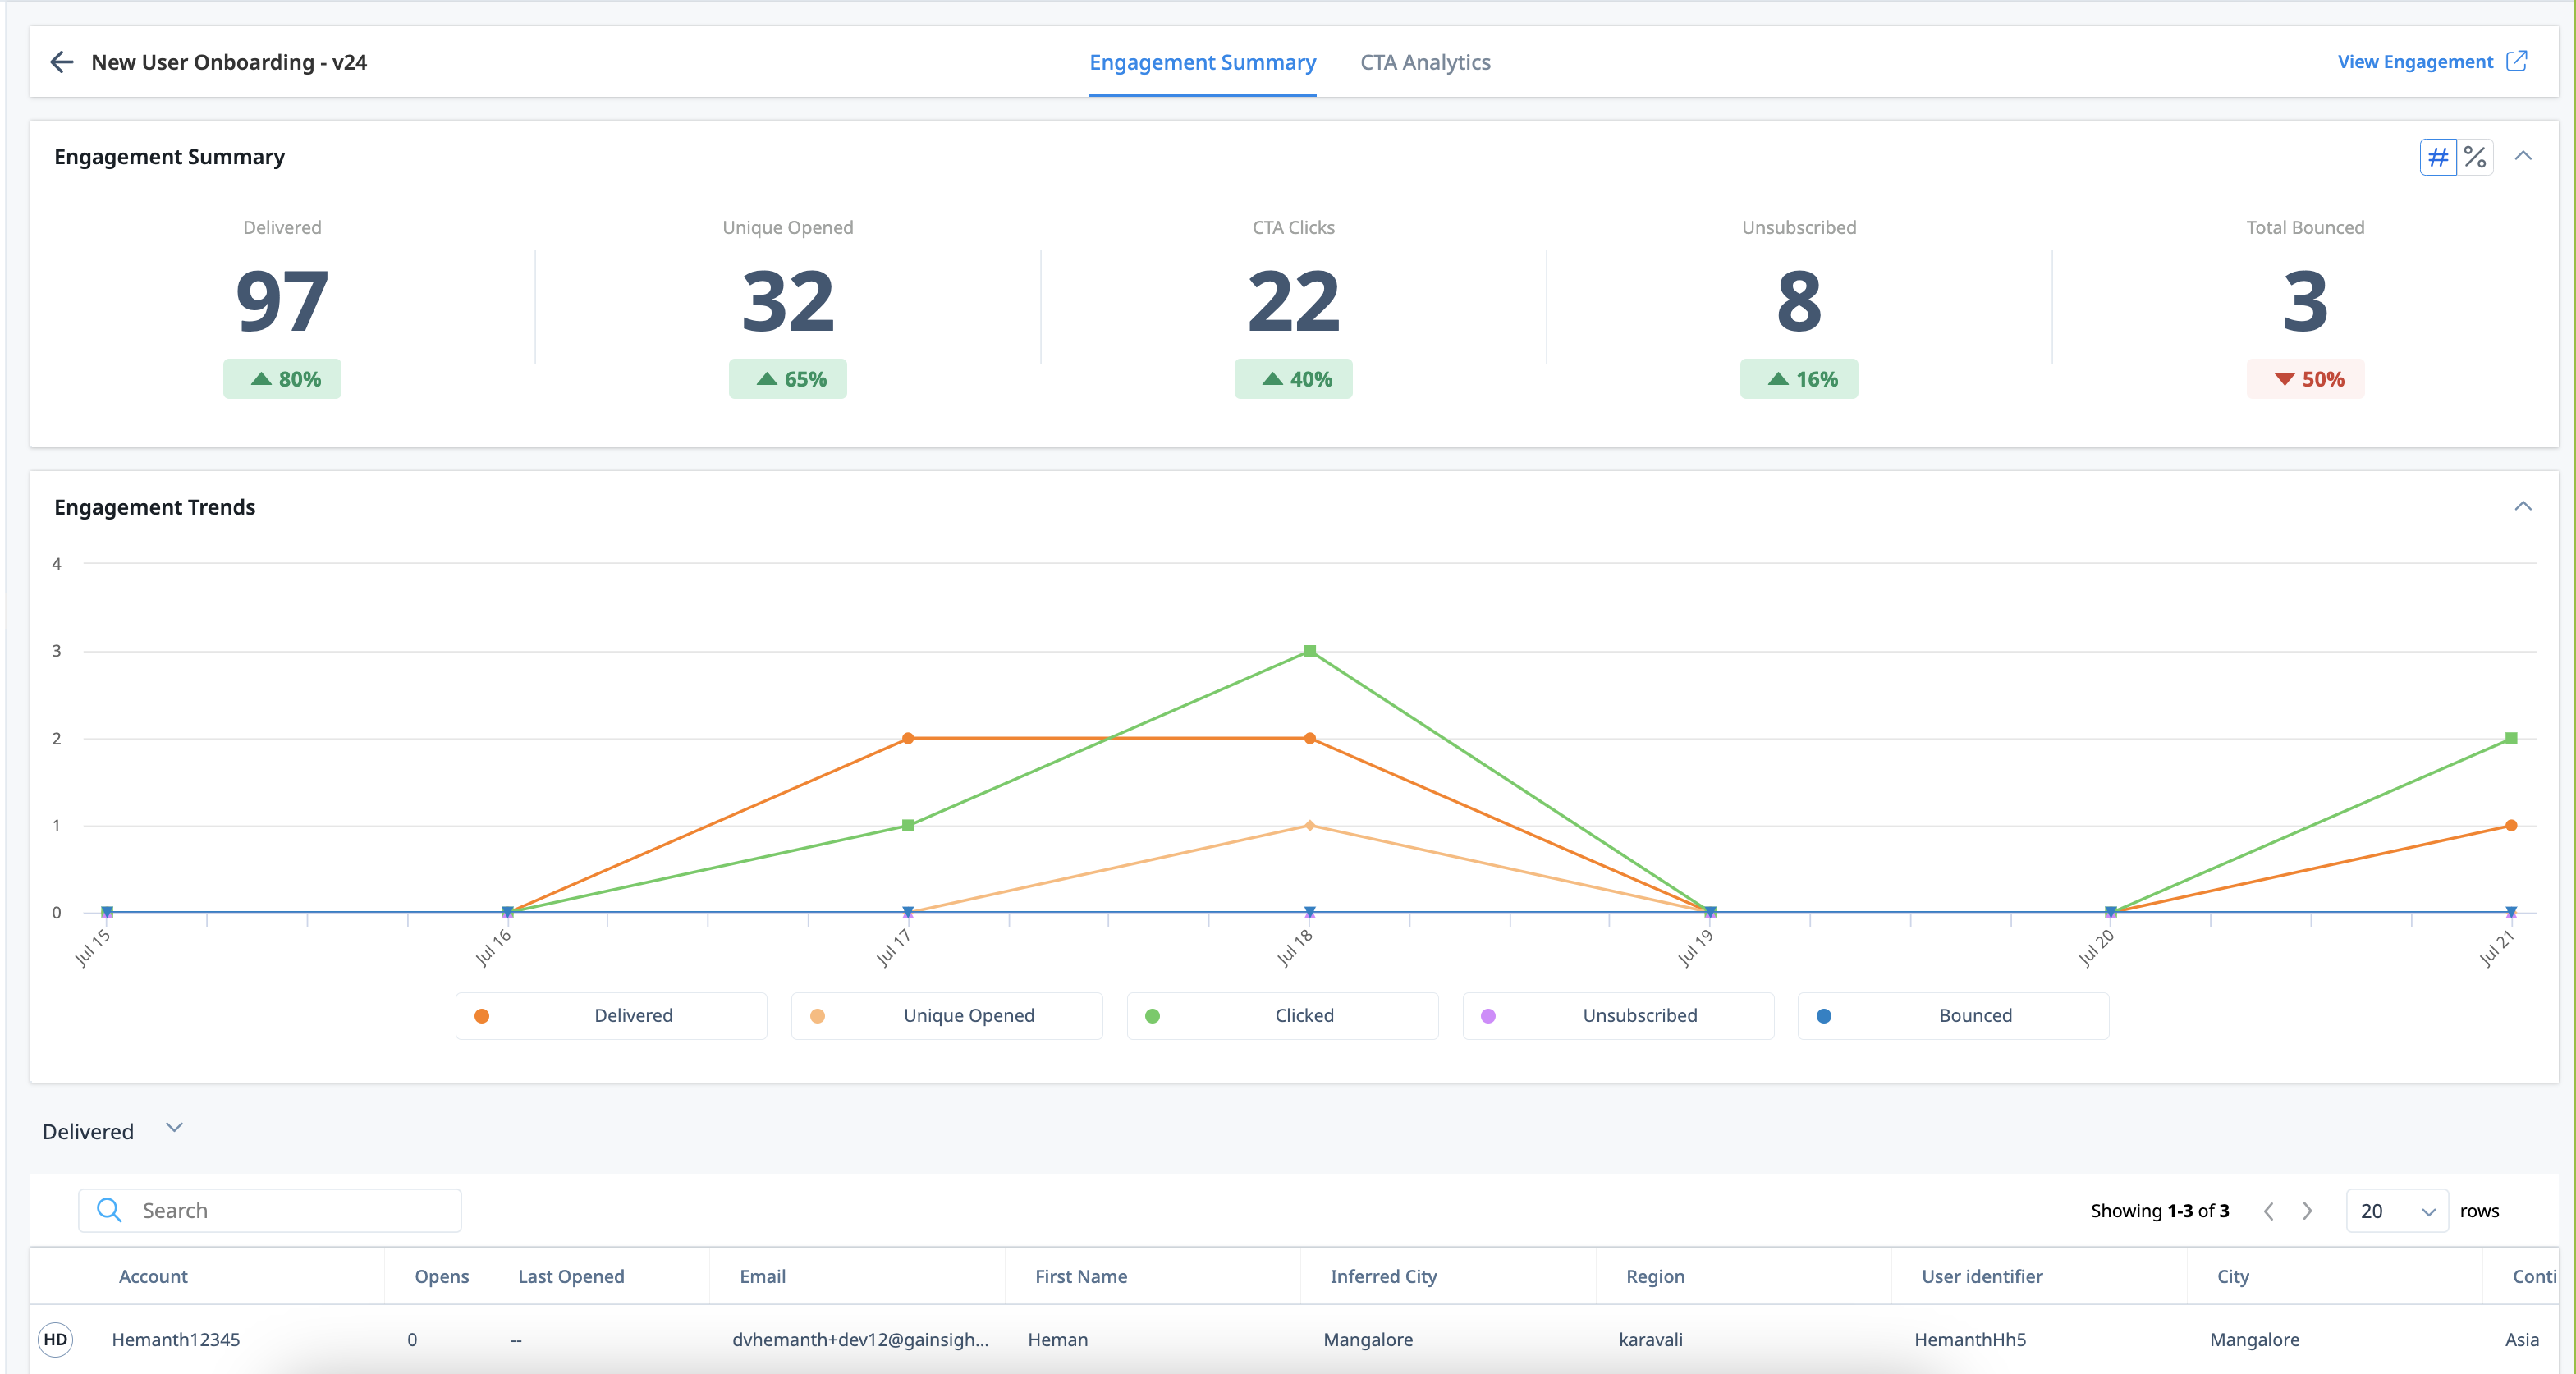
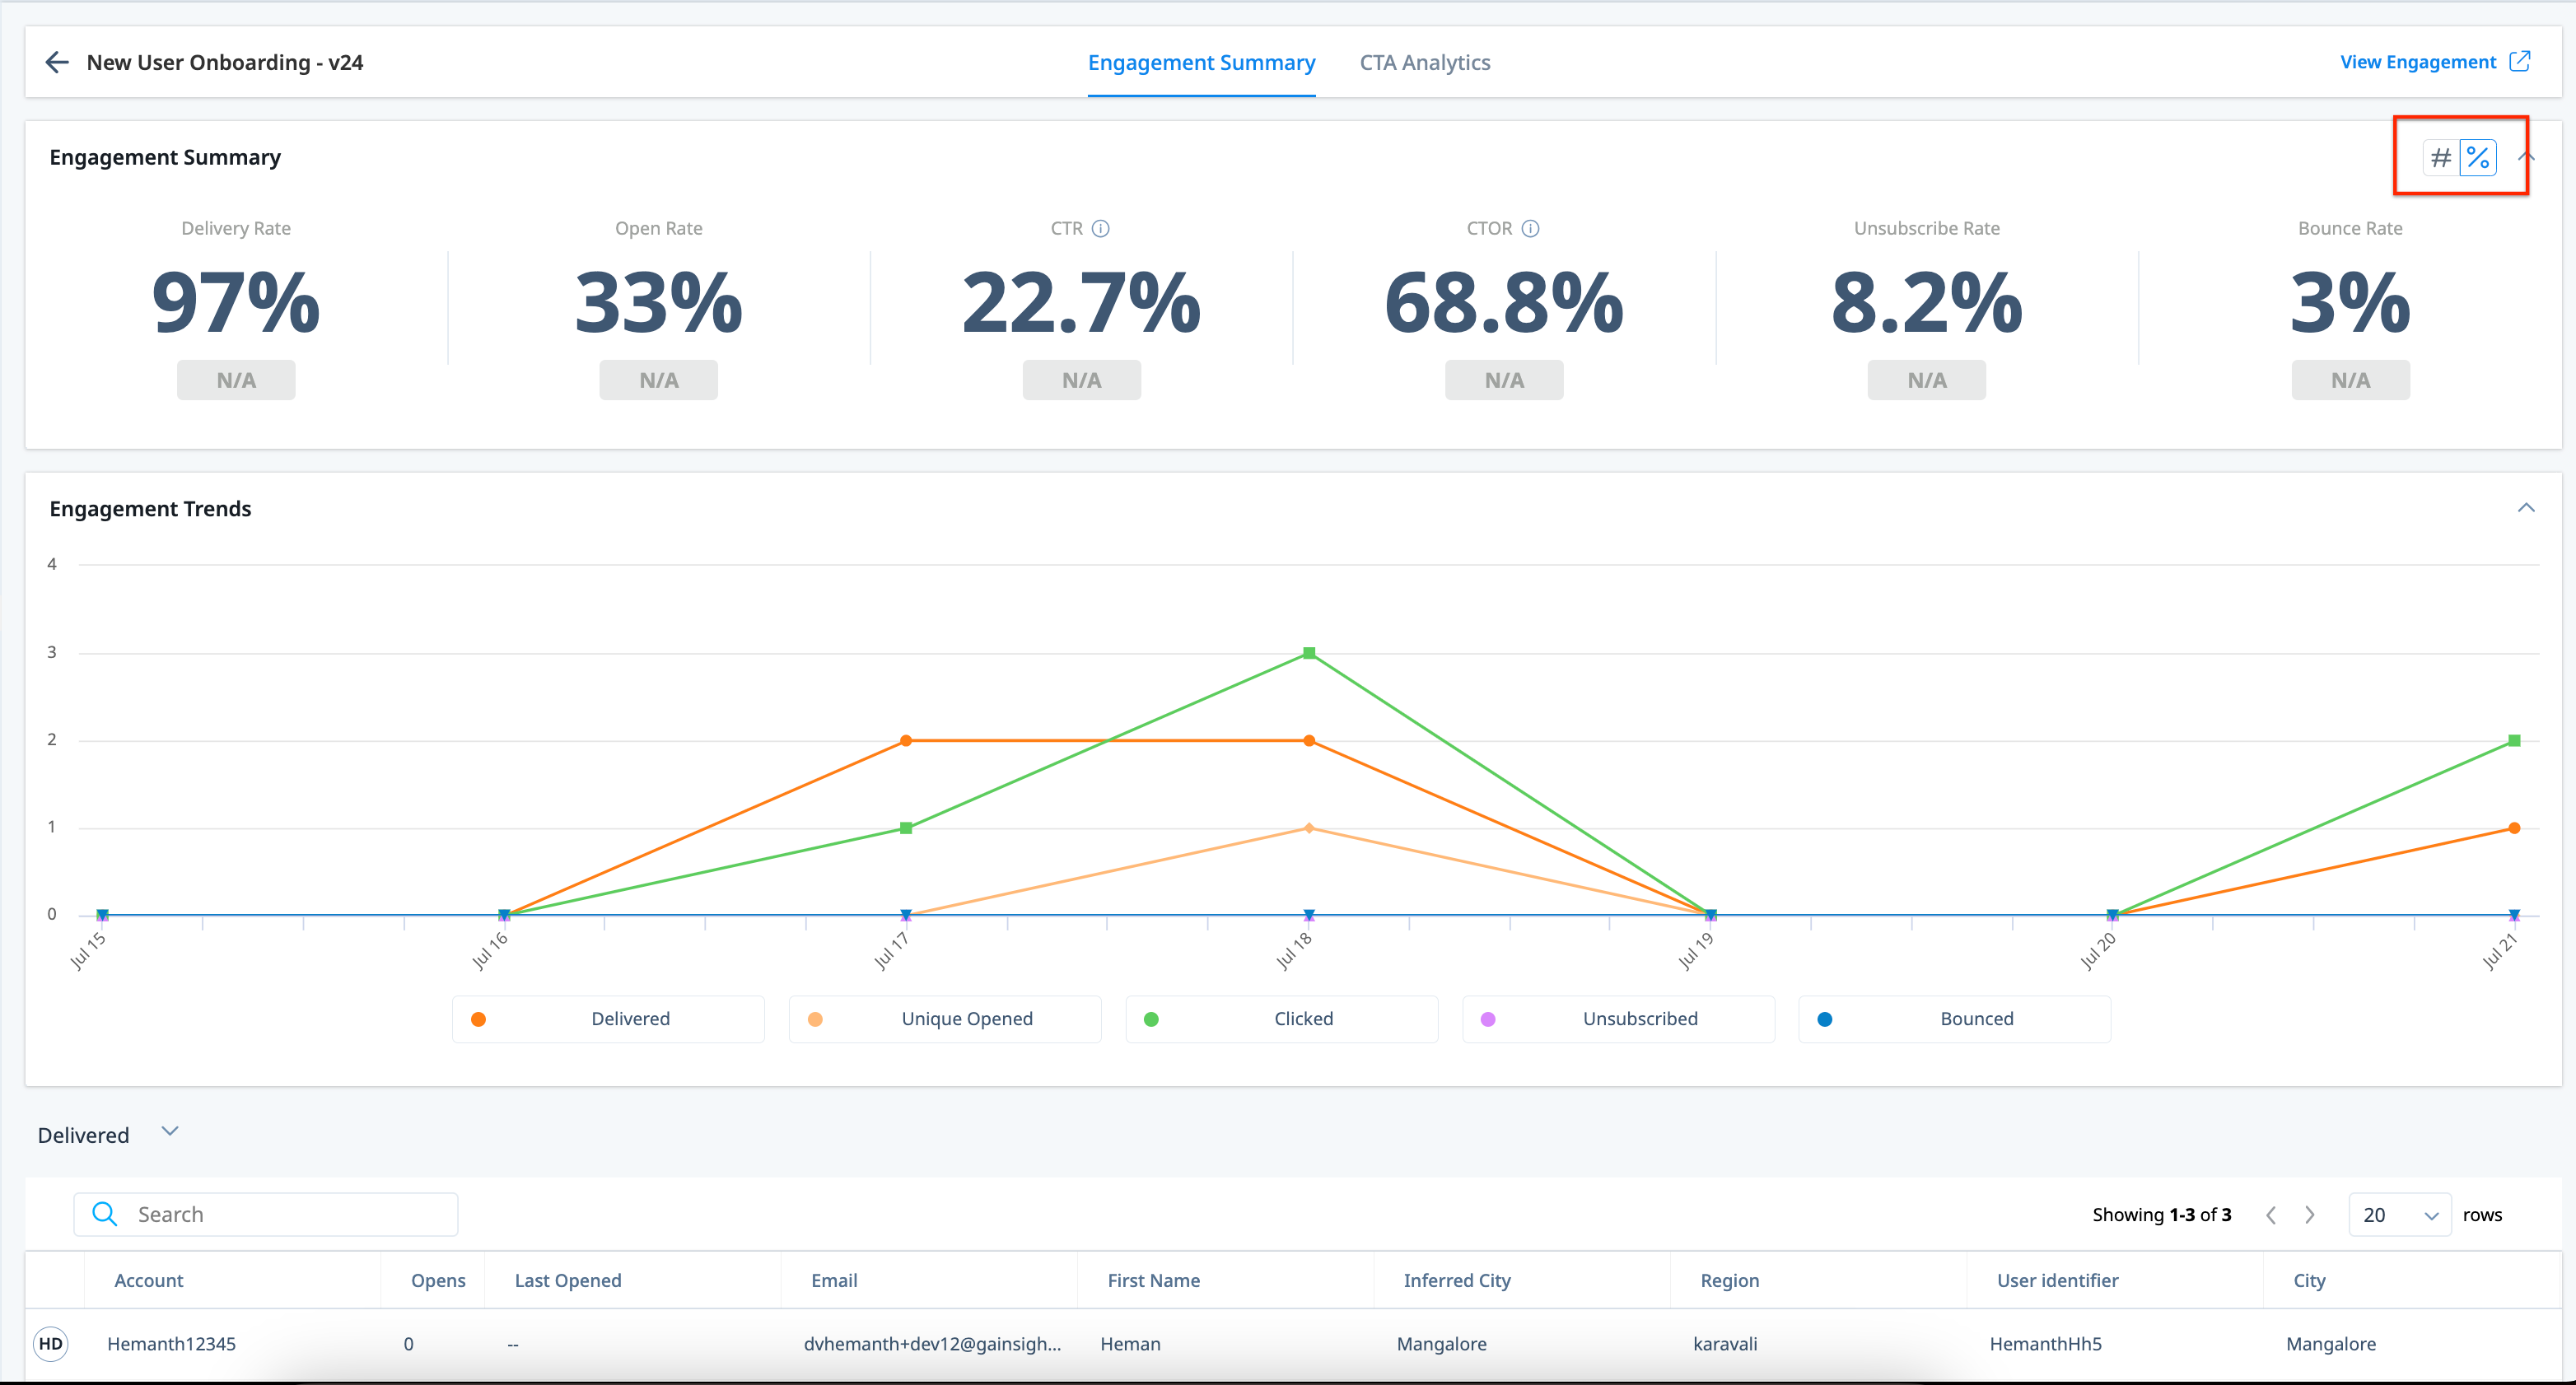
On the Engagement Summary tab, you can switch between numerical and percentage analysis for email engagements. This helps you to view your email performance data in the format that best suits your needs for better understanding and decision making. The different metrics shown are:
| Metrics (in numbers # ) | Metrics (in percentages %) |
|---|---|
| Delivered | Delivery Rate = (Emails delivered*100) / (Total emails sent) |
| Unique Opened | Open Rate = (Unique opens*100) / (Total emails delivered) |
| CTA Clicks |
CTR (Click Through Rate) = (Clicks*100) / (Total emails delivered) CTOR (Click to Open Rate) = (Clicks*100) / (Total emails opened) |
| Unsubscribed | Unsubscribe Rate = (Unsubscribes*100) / (Total emails delivered) |
| Total Bounced | Bounce Rate = (Total emails bounced *100) / (Total emails sent) |
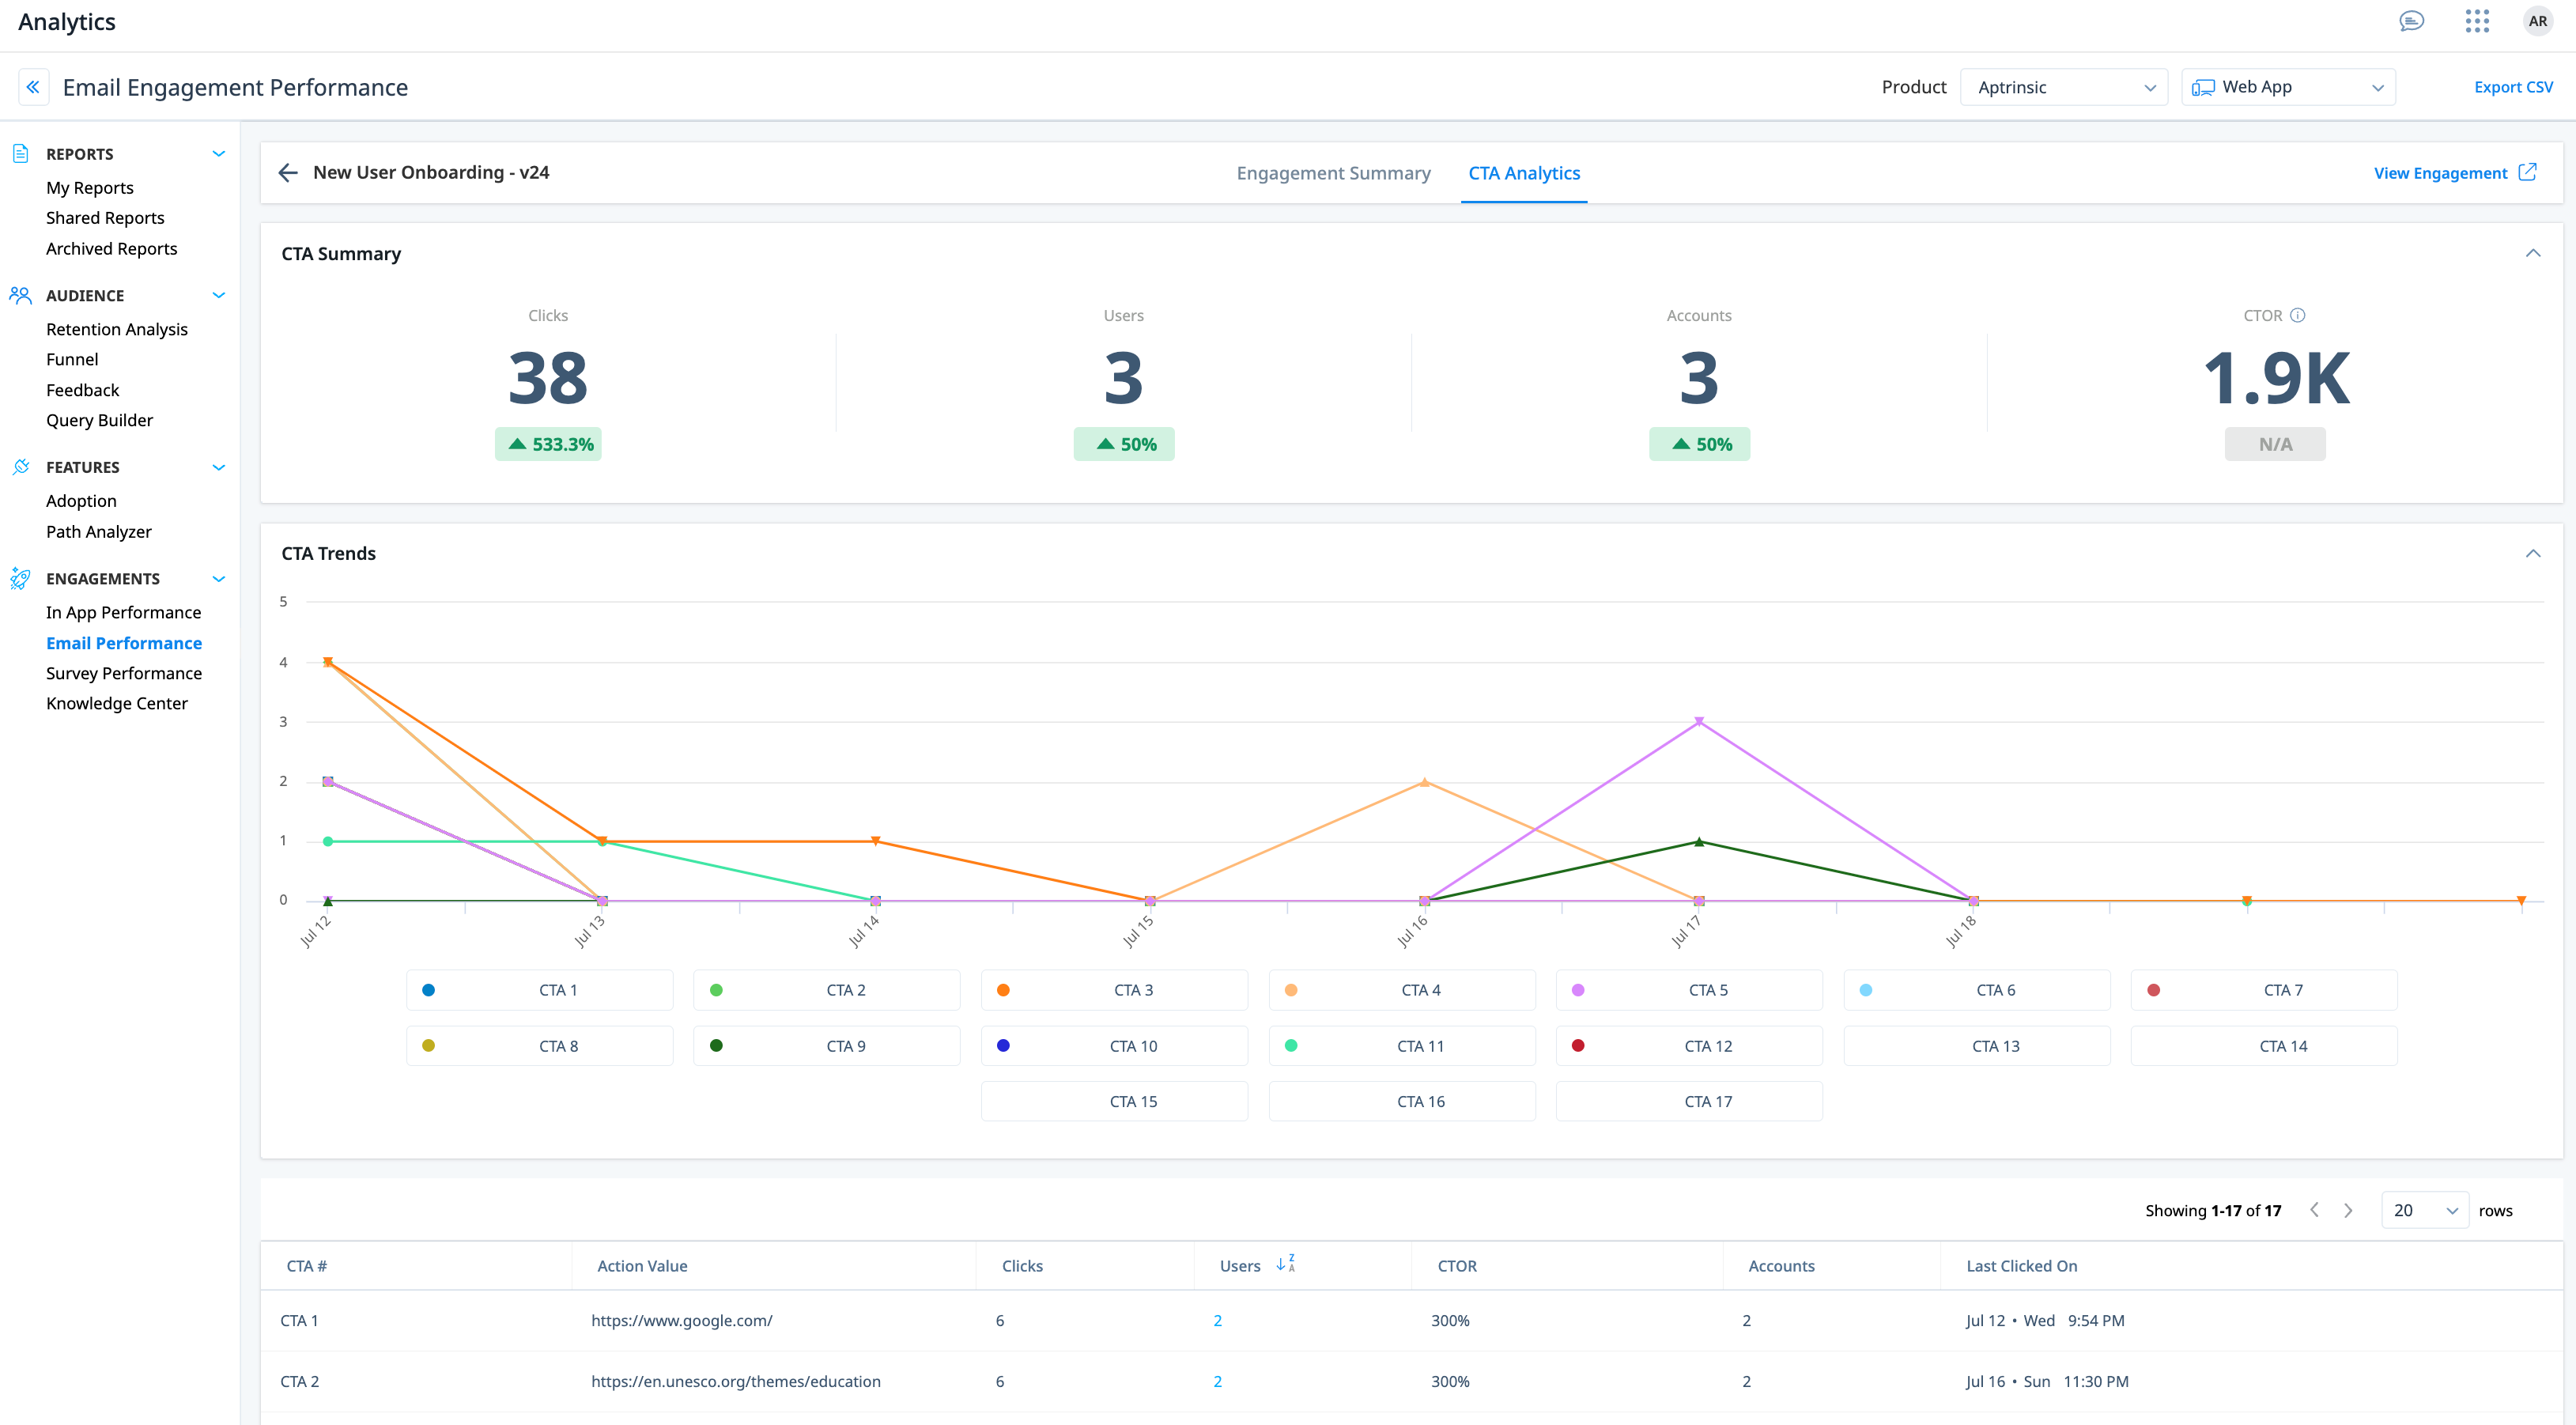
Email CTA Analytics
The CTA Analytics tab in Email Performance is designed to provide deeper insights into each Call to Actions (CTAs) in the email. For each CTA in the email engagement, you can view the following information:
- The action value of the CTA (for example: Redirect URL on clicking a button CTA)
- Count of clicks
- User and account information of the user who clicked the CTA
- CTOR (Click-to-Open Rate) of the individual CTA
- Timestamp details of when the CTA was last clicked
You can drill-down on the CTAs with which a user has interacted, allowing you to identify the CTAs that are resonating with your users. Additionally, a summary of user-interacted CTAs is available to provide a comprehensive overview of user engagement across all CTAs.
 For more information about various columns and widgets, refer to the Engagement Analytics section of the Analytics Data Dictionary article.
Survey Performance
The Survey performance report displays results for all 5 types of Surveys supported in Gainsight PX. For more information about NPS® survey analytics, refer to the Analyze NPS ® Results article. This section describes how to analyze the results of four other survey types. If you are using Mobile engagements, you can apply filters to either view data only for Web App Surveys, Mobile Surveys, or both.
You can also view the context (URL) for Survey Engagement Analytics. The context URL helps you to identify the page from which the survey was launched so that you can associate the URL to the survey response.
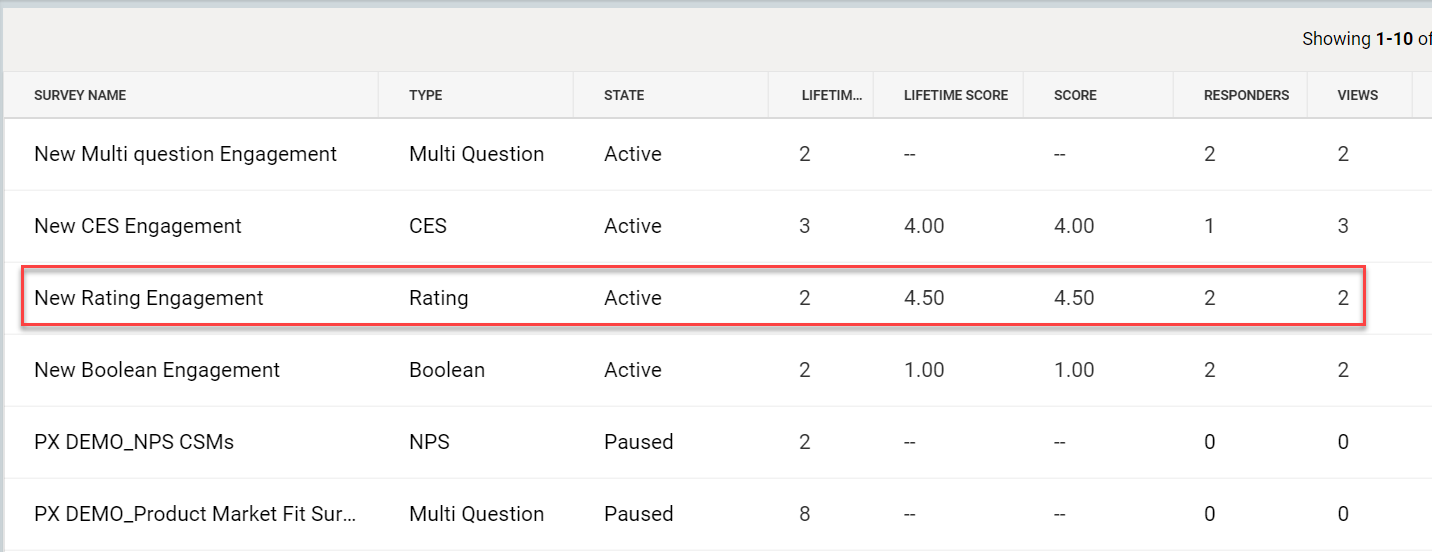
Analyze Rating Survey Results
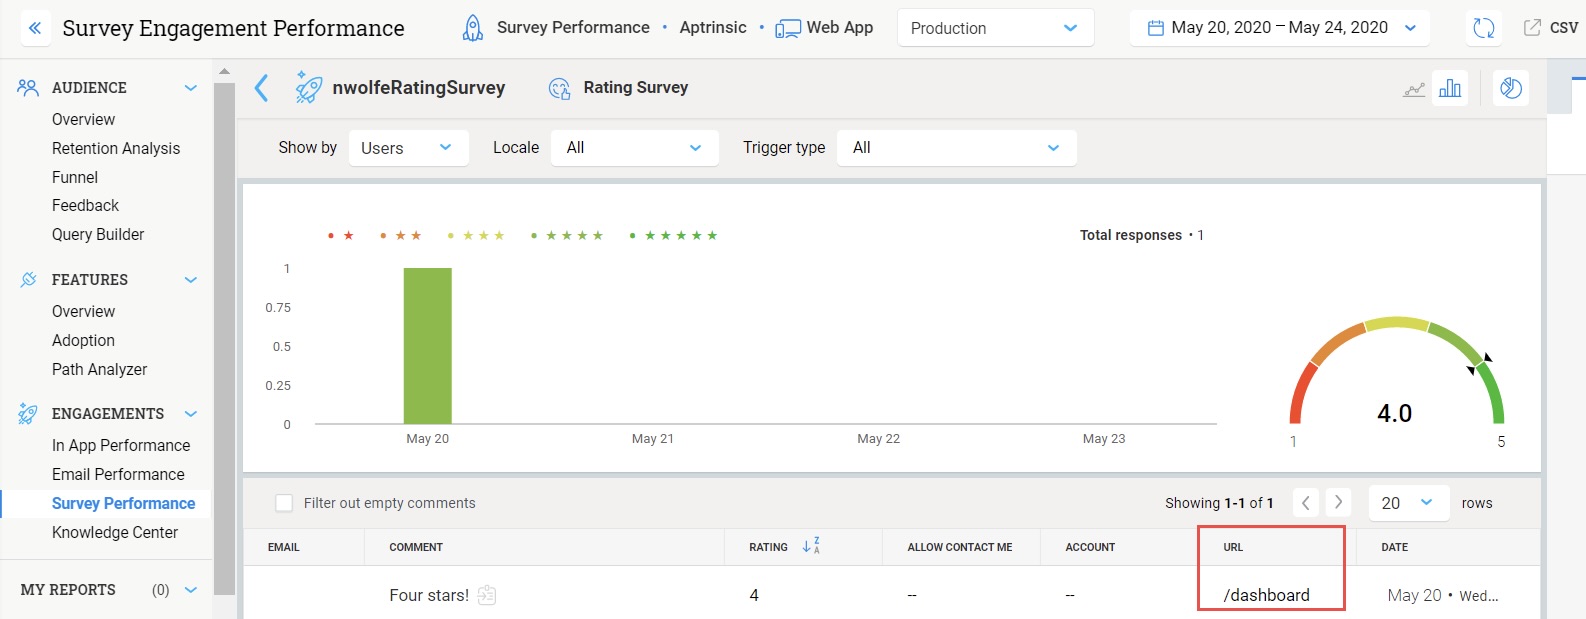
A Rating survey offers a set of 5 stars to the users, with 5 being the best rating. Based on their experience with your application page or feature, users can submit a rating.
To view Rating Survey results, click any Rating survey from the list of surveys in the Survey performance section. In the below image you can see a Rating survey. Two users have viewed and responded to the survey. Click the Rating survey to view the results in detail.
.png?revision=1)
In the following image, you can see that one respondent who has taken the survey and also the individual rating given by each user. The user has given a 5-star rating has also given comments. You can select the Filter out empty comments check box to view only those responses which have a comment. When you hover on the bar graph, you can view the legends for the scores.
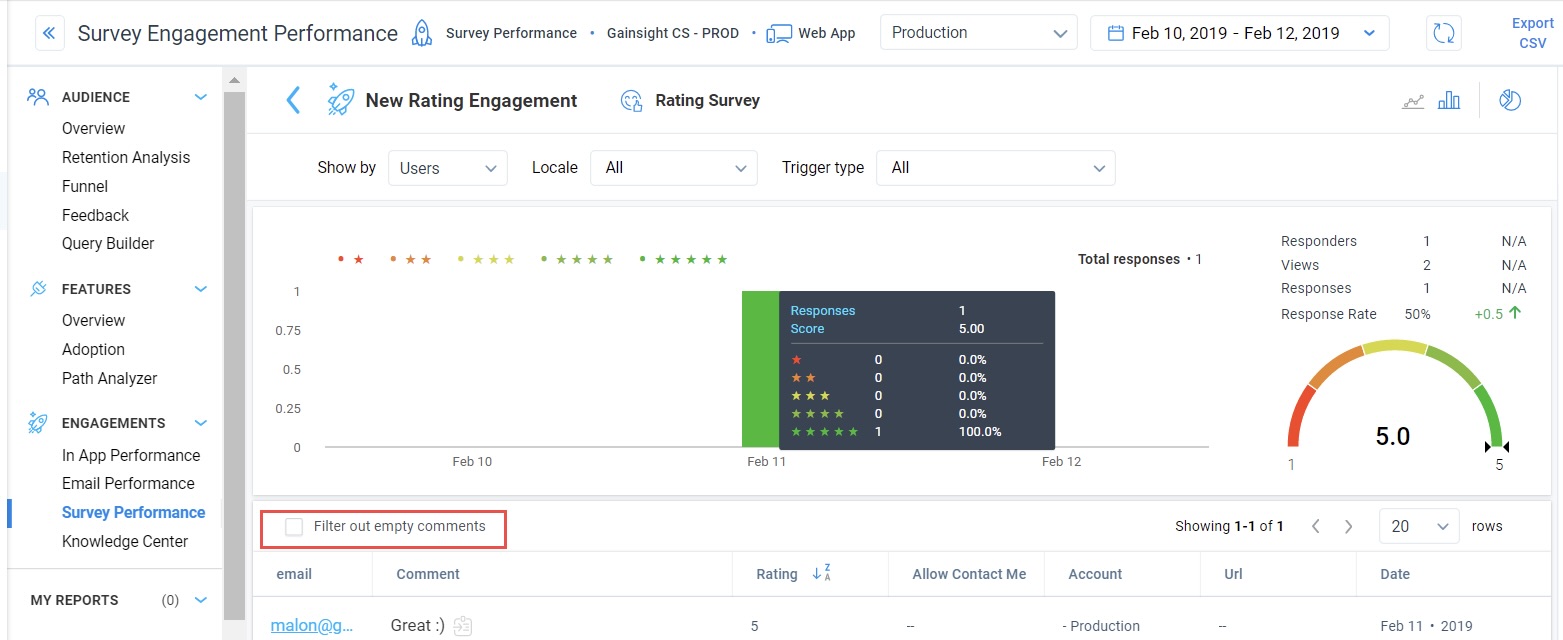
You can switch to Line Chart view, apply filters, and view results by company or overview.
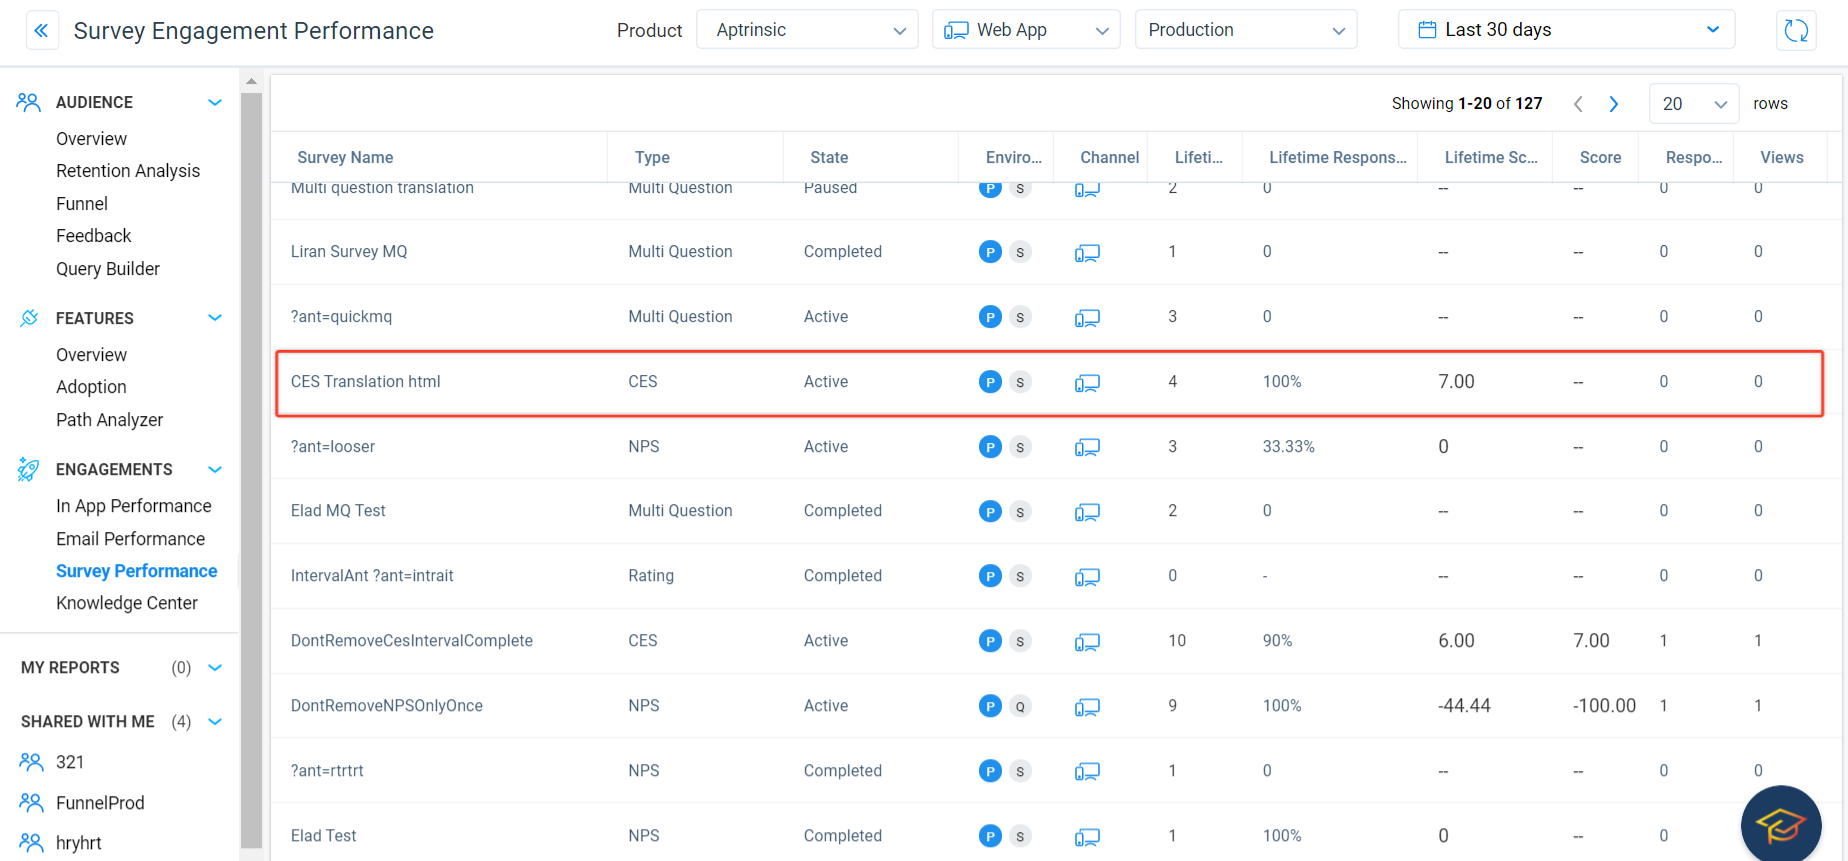
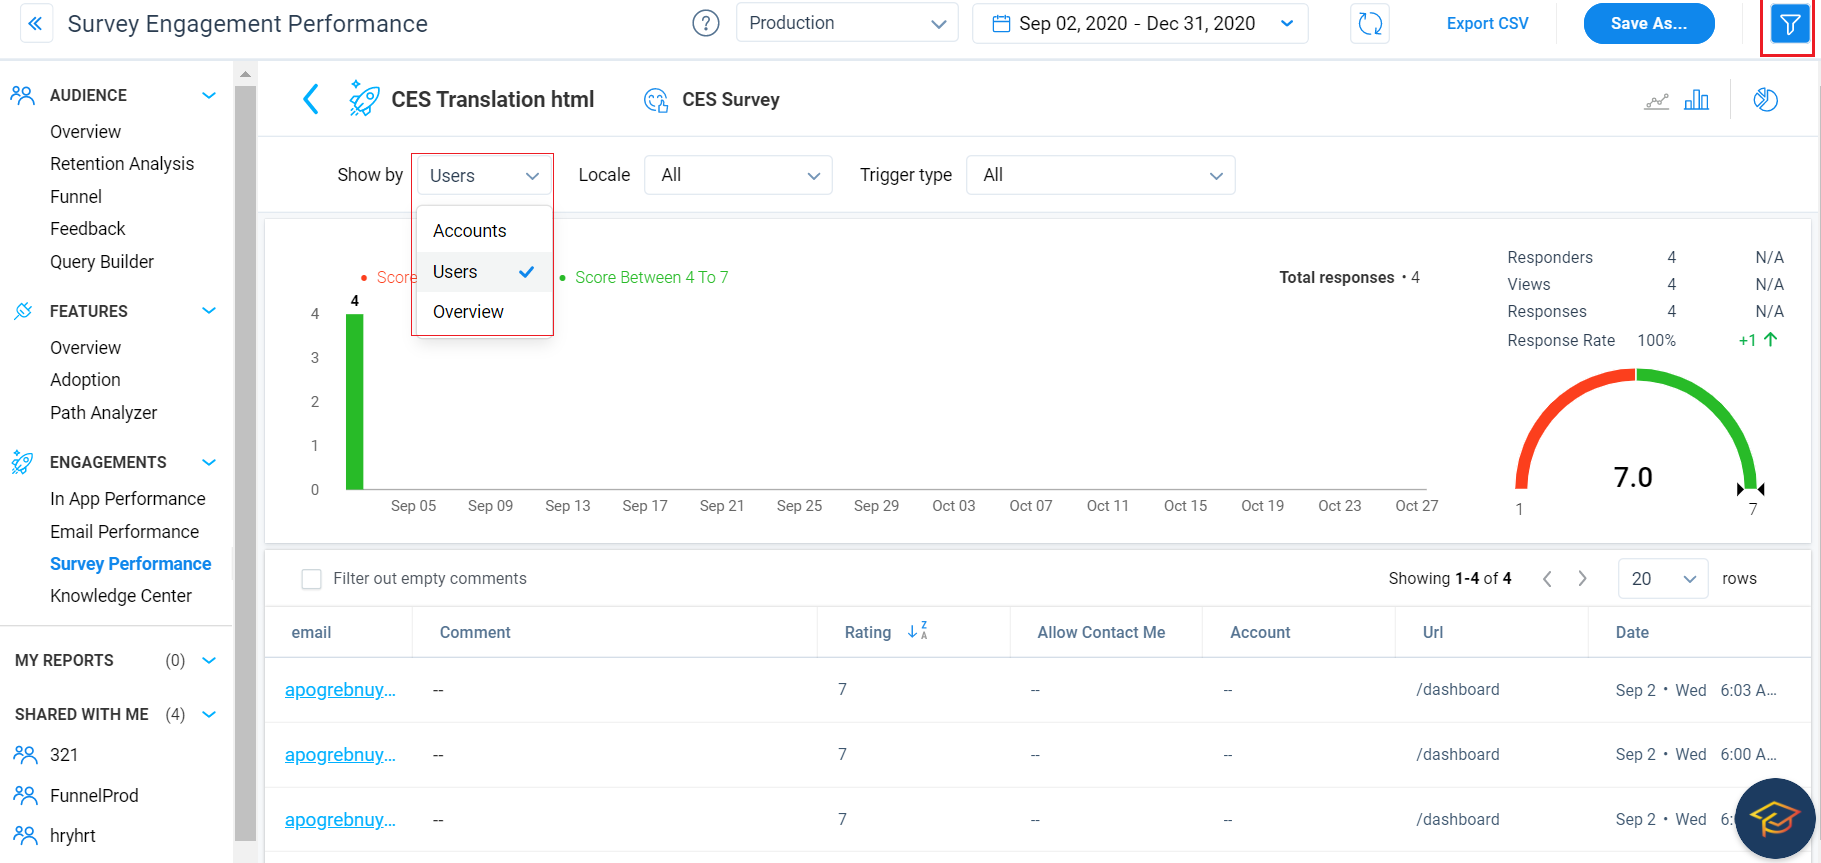
Analyze CES Survey Results
A Customer Effort Score (CES) survey is used to analyze the amount of effort a user has to put in to complete a task. CES survey displays the results on a Likert scale of 1-7. A score of either 1, 2, or 3 implies that the user is not at all happy with the amount of effort that was required. A score of 4 or 5 implies that things could have been better and a score of 6 or 7 implies that the user could understand the UI with minimal effort.
To view the results of a CES survey, click any CES survey from the Survey Performance section.
In the following image, four users have responded to the CES survey. All the four responders have given a rating of seven. All the responses were recorded on the same date. You can also view the average of the scores in the semi circle (7).
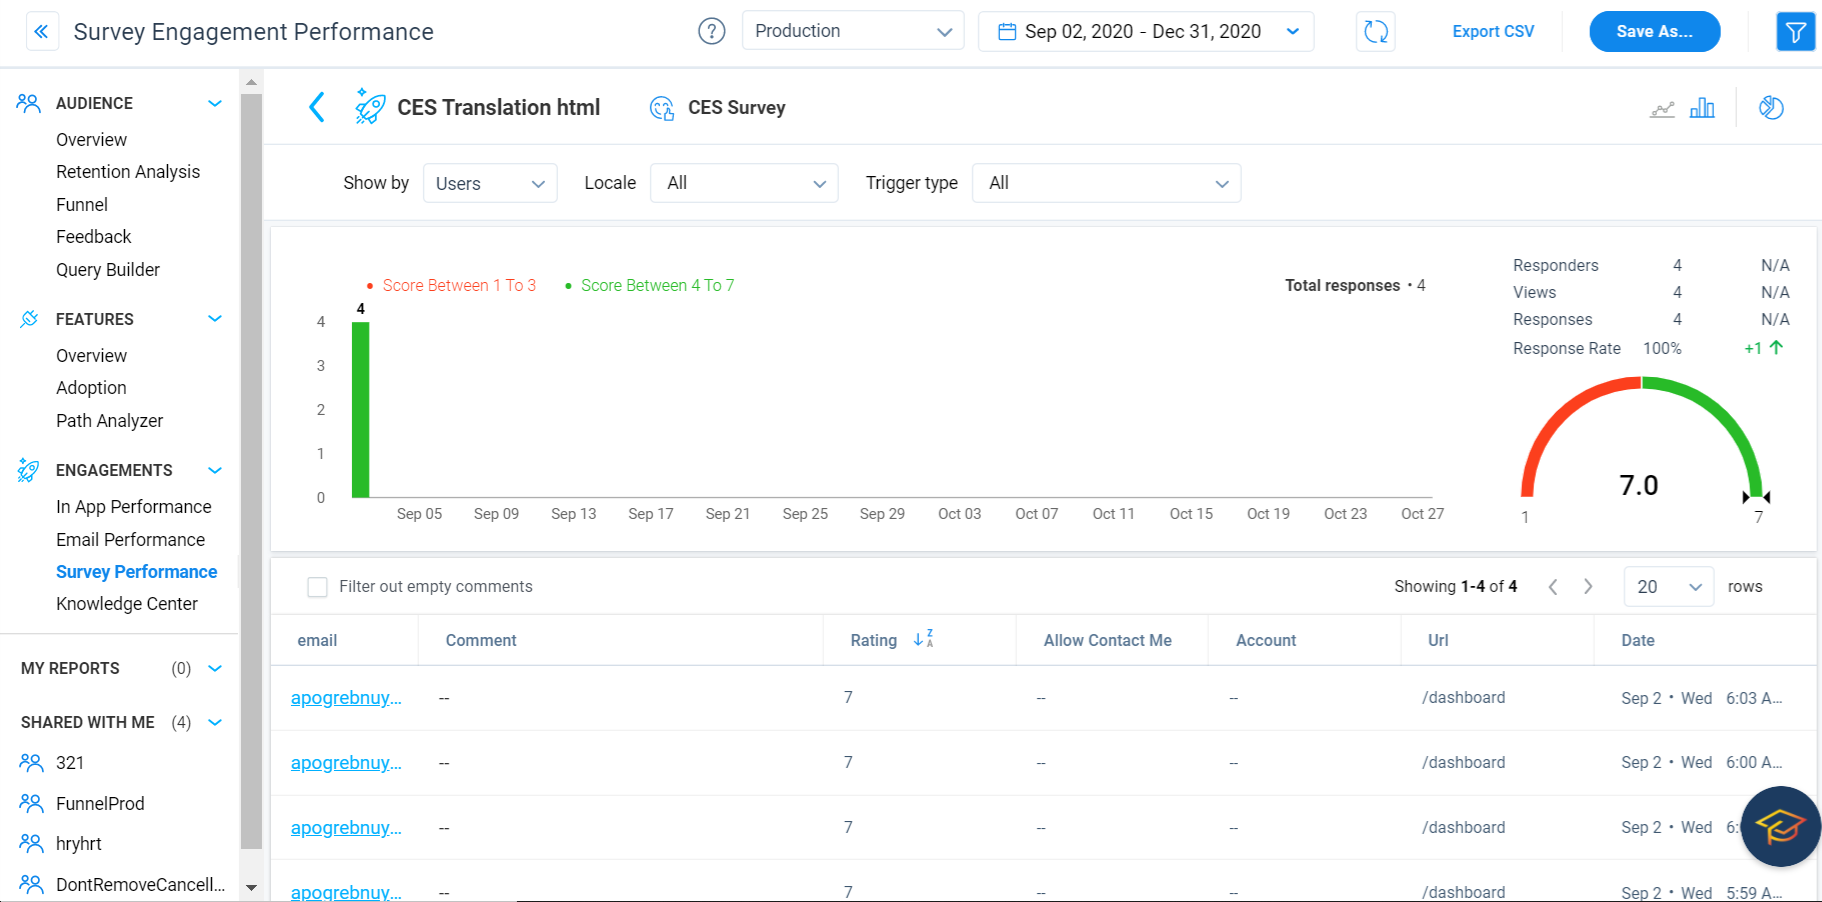
You can also switch from a bar chart to a line chart, apply filters, view results by accounts, or overview.
Analyze Boolean Survey Results
A Boolean Survey is a direct question that asks users if they are satisfied or not with a product. It has only two responses; Yes (positive) or No (negative). In the following image, you can see a Boolean survey, which has two viewers and two respondents. Both respondents have given a positive response. Click the survey to view the results in detail.
.png?revision=1)
Analyze Multi Question Survey Results
A Multi question survey allows you to display multiple questions as a survey on any page of your application. A Multi question survey can have two types of questions; Multi choice Question and an Open text question. Multichoice questions allow you to ask a question and also provide a set of answers. Users can select one or multiple answers. An Open question does not provide any options. Users must enter their answers.
In the following image, the survey constitutes of three questions. The Line chart shows the number of questions which were responded to by the users. 225 users answered Q1, 224 answered Q2 and 195 answered Q3.
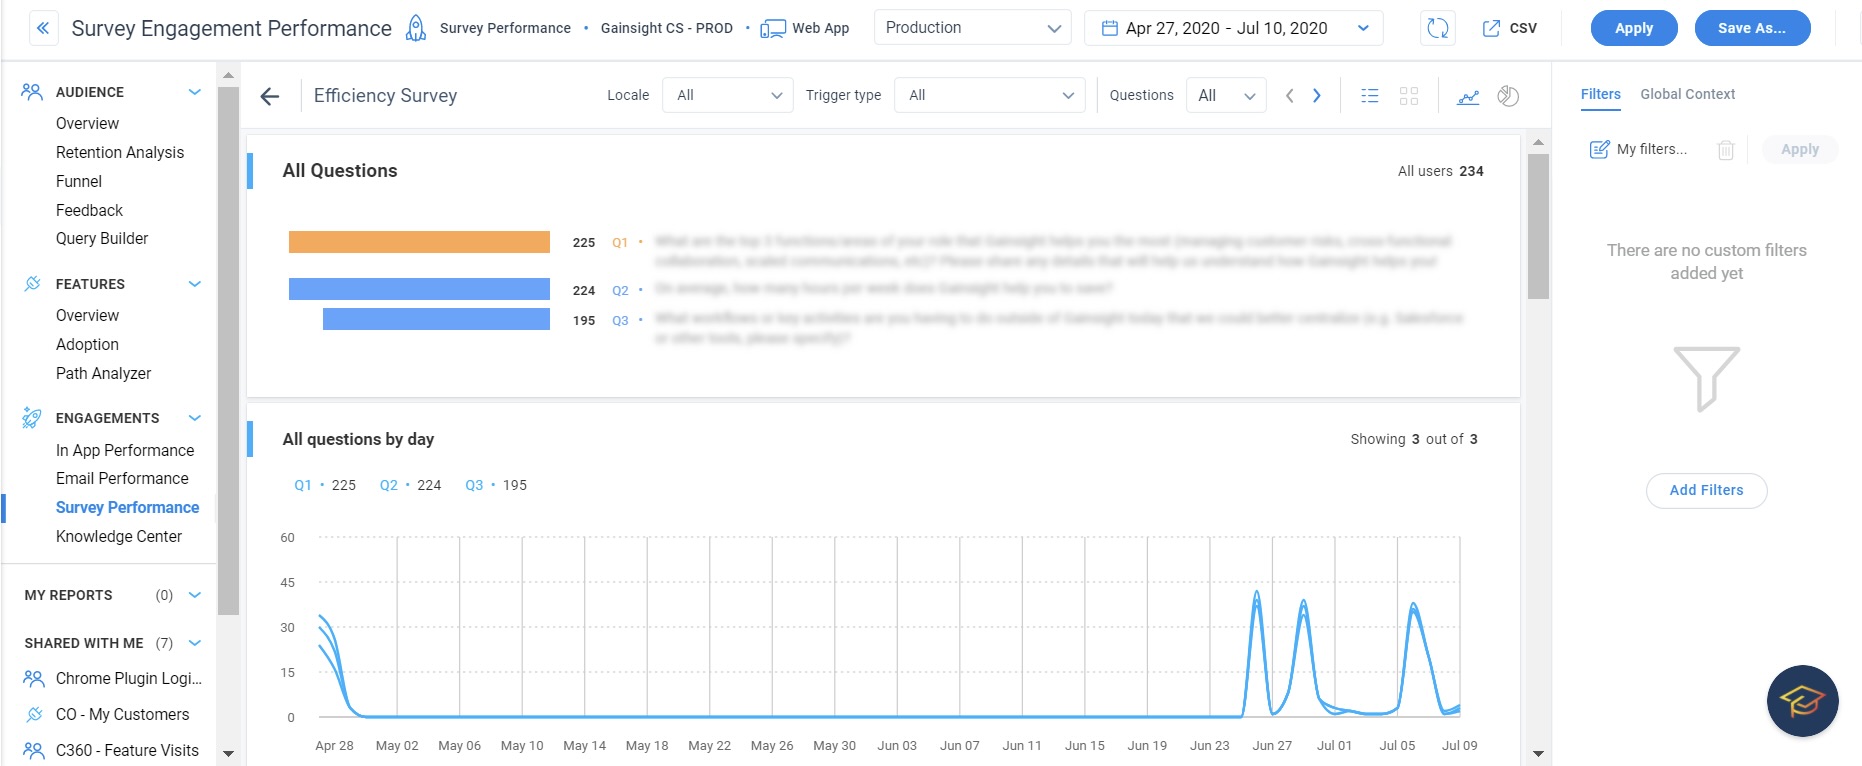
The All Questions by day section displays the days on which users responded to the surveys. You can see that many users has responded between June 17th and July 09th.
For a multi choice question, you can also click a response to view the list of users who provided that response.You can apply filters in this survey as well. However, you cannot switch to a bar chart.
Recent responses from users on open text questions are listed under question header. Click Show All Responses to view all answers.

Furthermore, survey respondents' answers across all questions are now highlighted in the drill-down view, eliminating the need for further navigation to view other responses.

Knowledge Center Bot
KC Bot Analytics helps you understand how often the Bot is used, or how many user views there are on Bot Engagements/articles, or if the search terms are returning the desired results.
For more information, refer to the Knowledge Center Bot Analytics article.
Additional Resources
| Net Promoter®, NPS®, NPS Prism®, and the NPS-related emoticons are registered trademarks of Bain & Company, Inc., NICE Systems, Inc., and Fred Reichheld. Net Promoter ScoreSM and Net Promoter SystemSM are service marks of Bain & Company, Inc., NICE Systems, Inc., and Fred Reichheld. |