PX Analytics Data Dictionary
The Analytics section in PX supports three types of performance report groups; Audience, Features, and Engagements. The reports are displayed in the form of widgets. You can also apply filters to the data displayed.
General Analytics Terms
This section explains the terms that are used across PX Analytics.
User Session: PX sessions are determined by tracking user activity within the application, and operate independently from the application's own session management or login/logout mechanisms. A PX session is initiated with the first recorded event for a user and concludes following a 30-minute period of inactivity, during which no user activity is detected by PX. Subsequently, any activity detected by PX from the same user, whether it occurs 31 minutes after the last event or at any point later — be it the next hour or day — triggers the start of a new PX session. Therefore, users may experience multiple PX sessions throughout a day, contingent on the frequency of 30-minute intervals of inactivity.
Audience Analytics Terms
This section explains the terms which you can find on widgets present in the Audience analytics section.
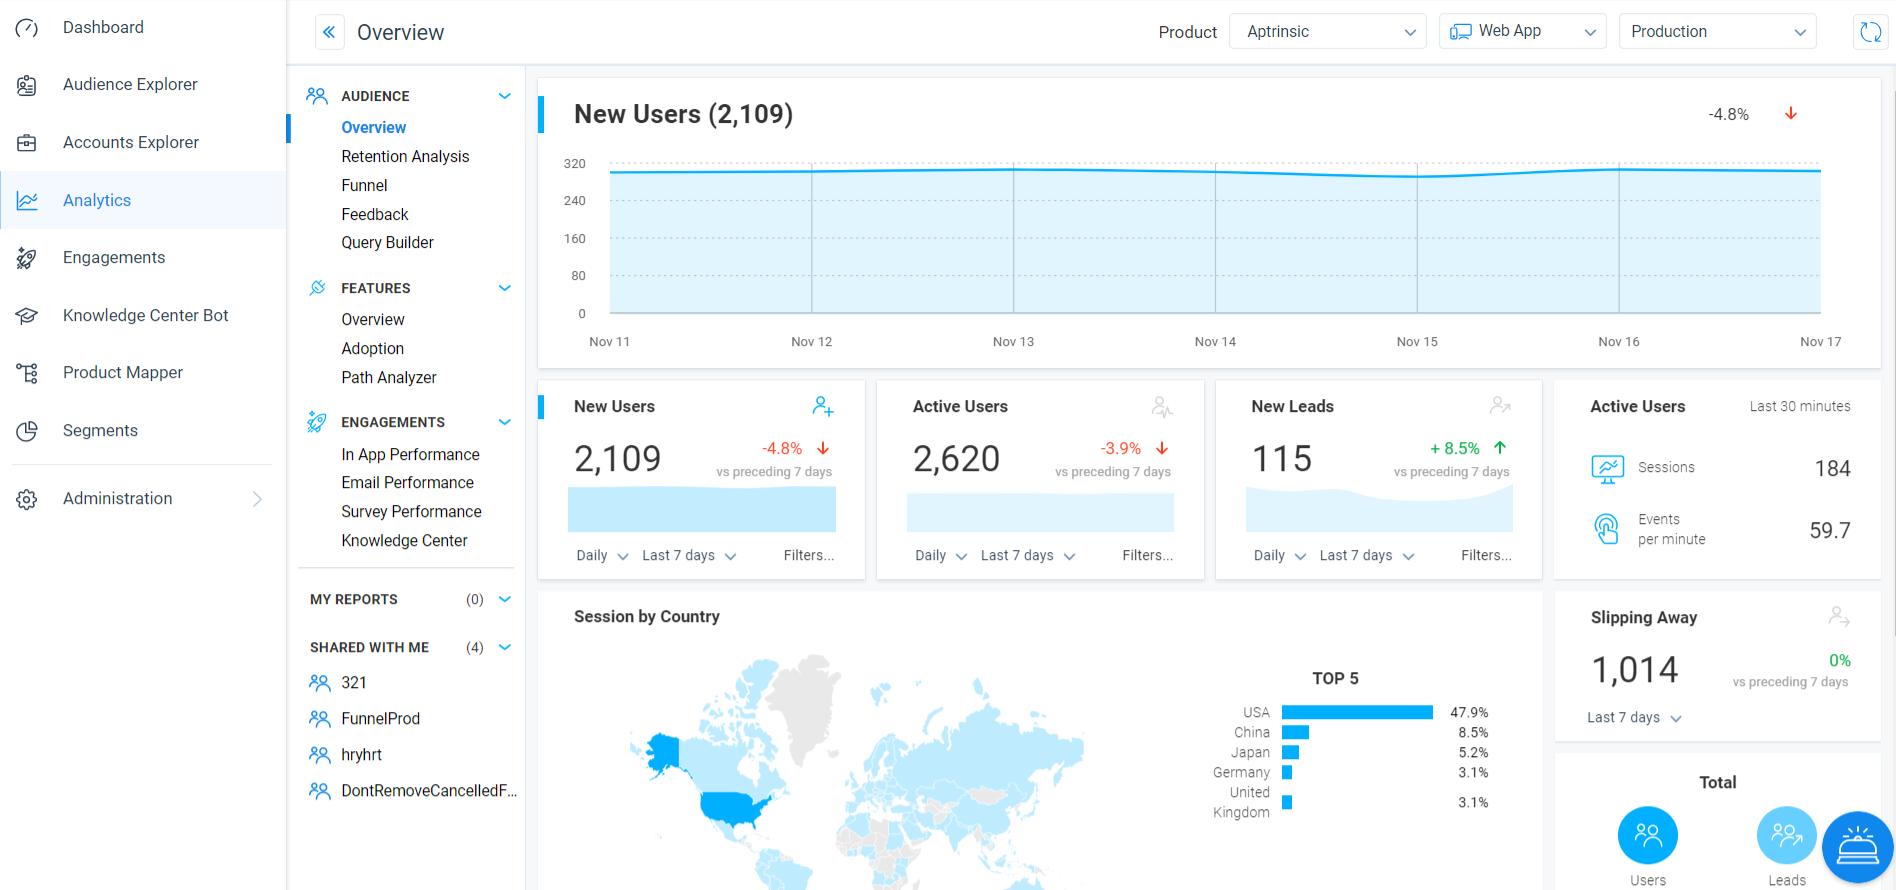
- New Users: This widget displays the number of new users who registered to your application in the given time period. By default, the time period is set for the last 7 days. You can modify the default time period. You can also apply filters to the data displayed.
Data Comparison: This widget honors the data comparison feature.- This widget compares the data for the time period you set with the equivalent historical time period.
- For instance, if you selected the last 7 days as the time period, the widget compares the data for the last 7 days with the data that existed for the 7 days which preceded the last 7 days.
- For example, if on 15 Oct 2020, you set the time period as Last 7 days, you can see the new users who signed up from 8 Oct 2020 to 14 Oct 2020. Also, you can see the percentile difference between the number of users who signed up from 1 Oct 2020 - 7 Oct 2020 and 8 Oct 2020 to 14 Oct 2020.
- Similarly, if on 15 Oct 2019, you set the time period as Last 30 days, you get a compared data of new users registered from 2 Sep 2019 - 1 Oct 2019 and 16 Sept 2020 - 14 Oct 2020.
- Active Users: This widget displays the number of users who were active during the selected time period. A User is deemed to be active if they initiated any session during the time period. This widget also honors the Data Comparison features and allows you to apply filters.
- New Leads: This widget displays the number of new leads, generated during the selected time period. This widget also honors the Data Comparison features and allows you to apply filters.
- Active Users (Sessions and Events): This widget displays two items; the number of sessions that were created in the last 30 minutes and the number of events recorded per minute, for the last 30 minutes.
- Browsers: This widget displays the various browsers from which your application has been accessed, in the specified time period. When you click a browser in the widget, you can view the distribution of different versions of that browser.
- Usage by time of day: This widget displays the time at which users accessed your application, in the specified time period.
- Session by Countries: This widget displays the various countries which initiated a session. The legend shows the top 5 countries which recorded the highest number of session, in the given time period.
Features Analytics Terms
This section explains the terms which you can find on widgets present in the Features analytics section.
- Events Recorded: This widget displays the total number of events, recorded during the selected time period. Events include URL rules, Tag UI element rules, and custom event rules. The following events are tracked:
- [PAGE_VIEW, APP_OPENED, SIGN_UP, USER_FEEDBACK, LEAD, APP_BACKGROUNDED, BADGE_TRACK, APP_UPDATED, APP_CRASHED, IDENTIFY, APP_UNINSTALLED, SESSION_INITIALIZED, FEATURE_MATCH, FORM_SUBMIT, APP_INSTALLED, CUSTOM, SCREEN]
- Custom Event: You can configure this widget to display data for any of the features, you wish.
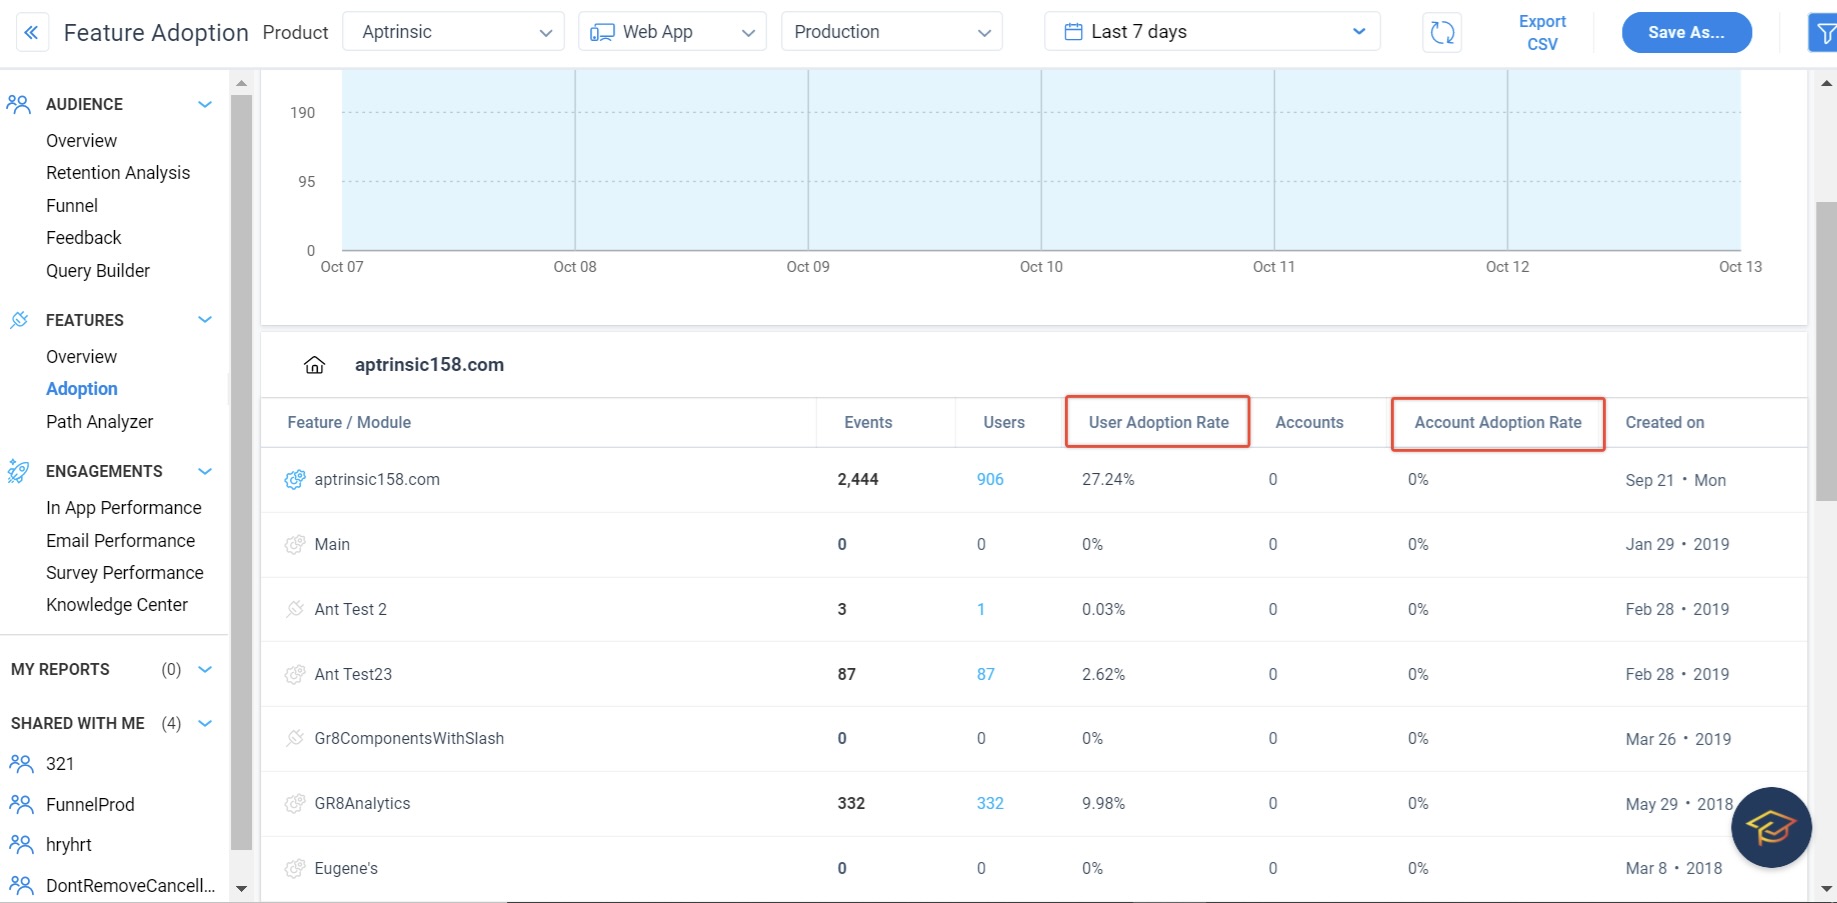
- User Adoption Rate: This is a column located on the Adoption report. This column displays the percentage of users that have adopted the feature, against the total number of users matching the filter criteria.
Formula: (Total number of users who were active (had a session) at the selected time period / Total number of users matching the criteria) * 100- Account Adoption Rate: This is a column located on the Adoption report. This column displays the percentage of accounts that have adopted the feature, against the total number of accounts matching the filter criteria.
Formula: (Total number of accounts matching the criteria, that were active (had a session) during the selected time period/ Total number of accounts matching the criteria) * 100
Engagement Analytics Terms
All the terms explained below are columns in the Engagements Analytics, located on different engagement reports.
The following terms can be found in the In-App Performance report and are applicable to Dialog, Slider, and Guide engagements.
- Views: The number of times the engagement was viewed during the date range selected.
- Lifetime Views: The number of times the engagement was viewed, irrespective of the date range selected.
Note:
- Lifetime Views in the Engagements list view include views from all environments. Lifetime Views in the In App Performance report is broken down per environment.
- For a single-step tooltip, the engagement is counted as “completed” if it just appears on the UI element of the application. The user does not have to click within the engagement for it to be counted as completed.
- Unique Views: The number of times the engagement was viewed by unique users within the selected date range.
In the following image, the date range is selected as 30 days. The highlighted engagement was viewed 43 times during the last 30 days and 47 times overall.
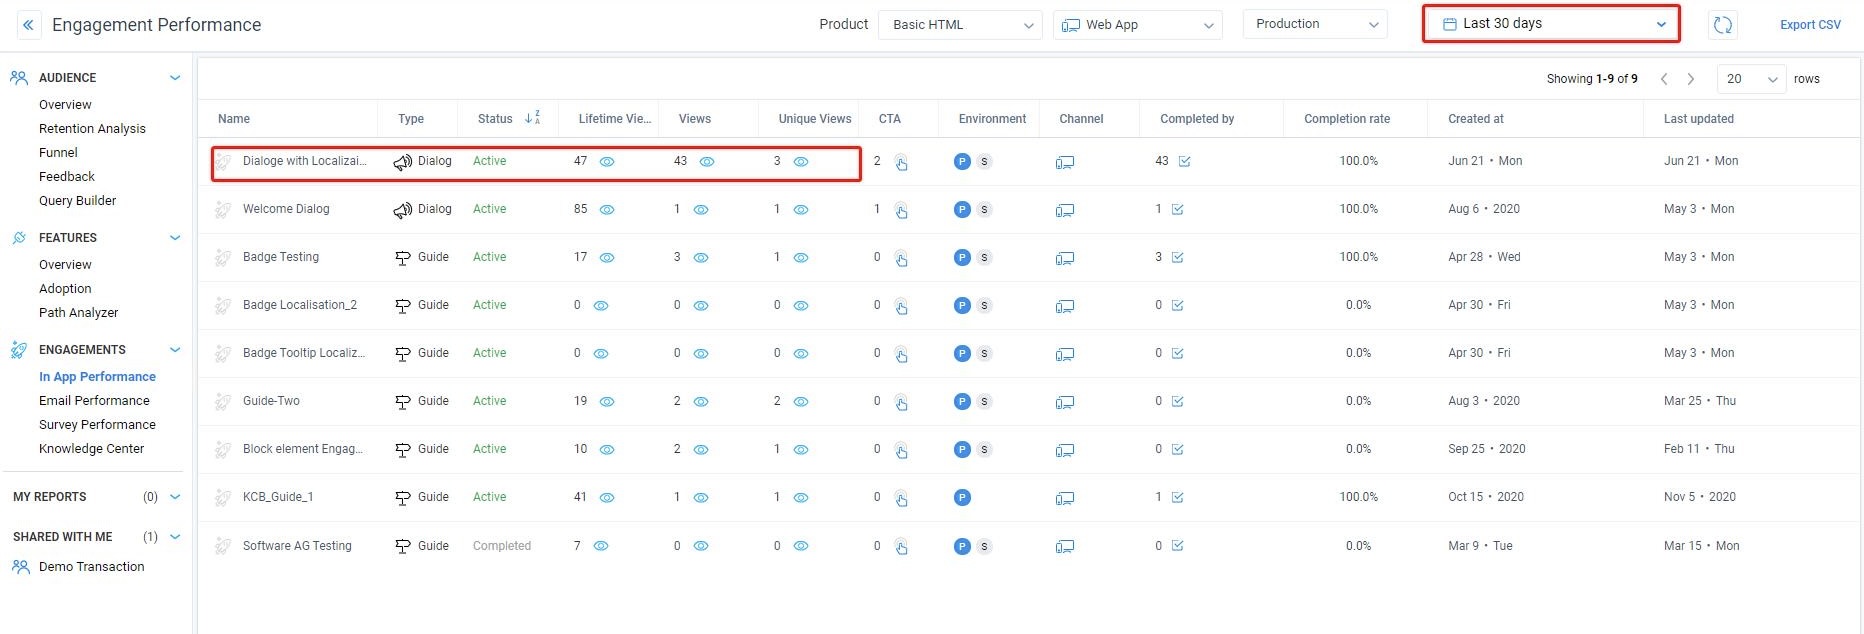
- CTA: This column displays the number of times hyperlink(s), and buttons (used in your engagement) were clicked by users while viewing the engagement.
- Completed By: This column displays the number of users who completed your engagement. The following is the completion criteria for different engagements:
- Dialog: The engagement is said to be completed if a user sees the engagement.
- Slider/Guide: The engagement is said to be completed when a user navigates through all of the slides/steps of the engagement and reaches the final slide/step.
- NPS®/CES/Rating/Boolean Surveys: The engagement is said to be completed when the user submits the survey.
- Multi Question Survey: The engagement is said to be completed when the user answers all the questions.
- Completion Rate: This column displays the percentage value of the number of users who completed an engagement, as opposed to the number of users who viewed the engagement, in the date range selected.
Formula: (value in Completed by column / value in Views column) * 100
The following terms are applicable to Email engagements and can be found on the Email Performance report. Some of the terms in this section are present as both a widget and a column.
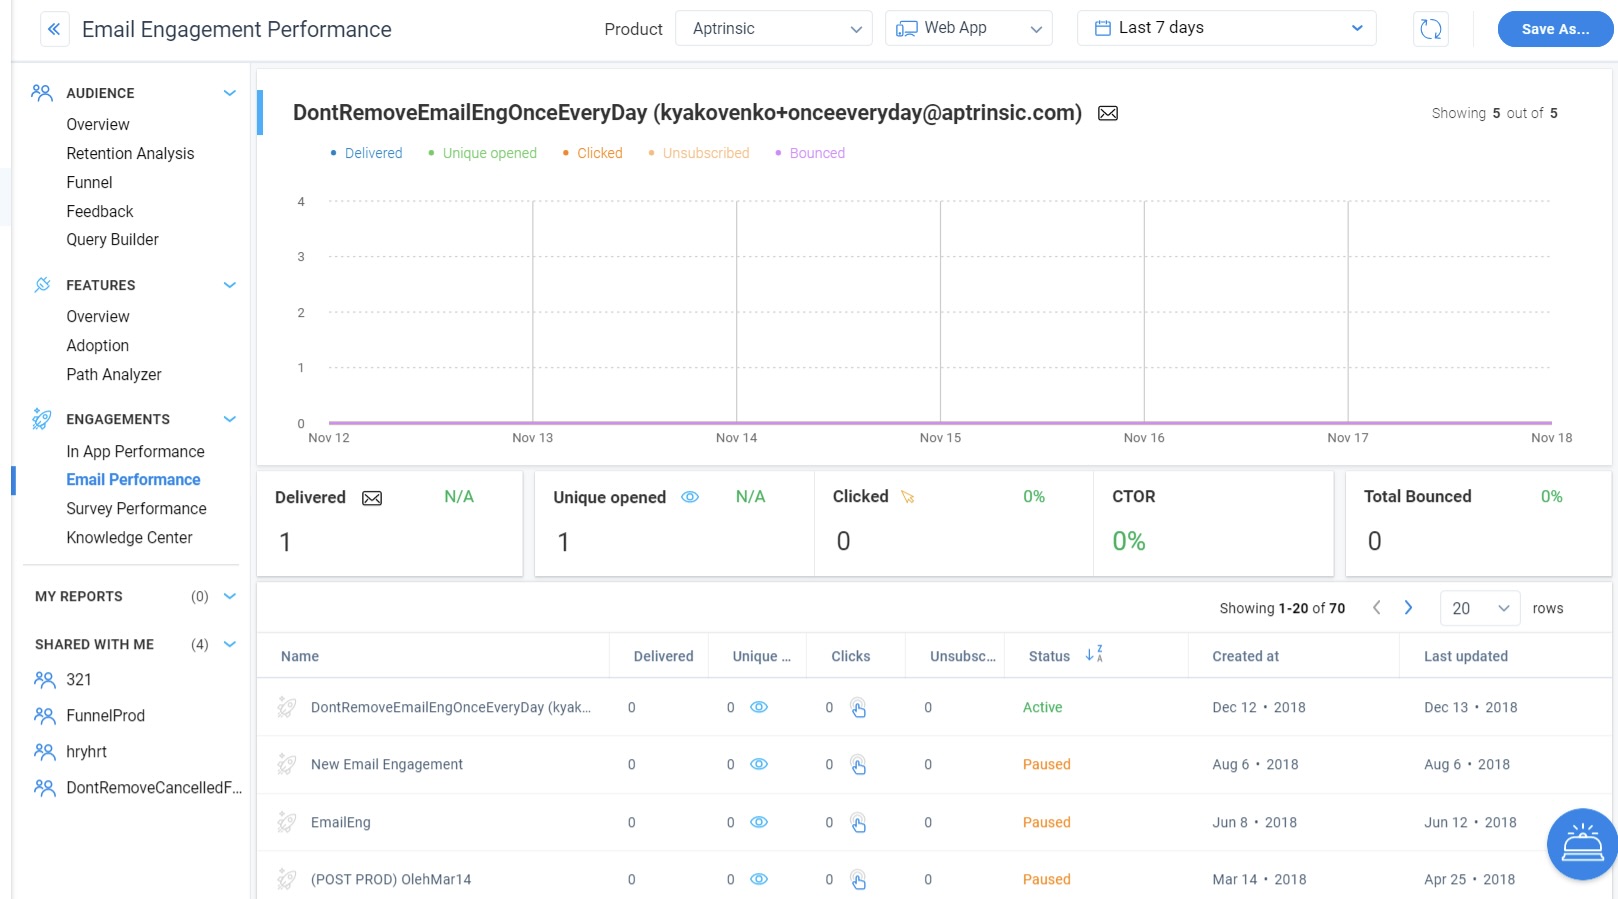
- Delivered: The Delivered column displays the total number of users to whom the email was sent in the selected time period. The widget also compares the present data with equivalent historic data.
- Unique Opened: The Unique Opened column displays the total number of unique users who read the email. The widget also compares the present data with equivalent historic data.
- Clicked: The Clicks column displays the total number of users who clicked a hyperlink present in the email. The widget also compares the present data with equivalent historic data.
- Unsubscribed: The Unsubscribed column displays the number of users who unsubscribed from your emails. There is no widget for the unsubscribed column.
- CTOR: CTOR stands for Click-to-Open Rate and is present as a widget. This widget compares the number of people that opened the Email as opposed to the number of users that clicked a link in the Email. The percentile value is displayed.
Formula: (Number of clicks / Number of opens) * 100 - Total Bounced: This widget displays the percentage of email addresses in your subscriber list that didn't receive your message because it was returned by a recipient mail server. This widget also compares the present data with equivalent historic data.
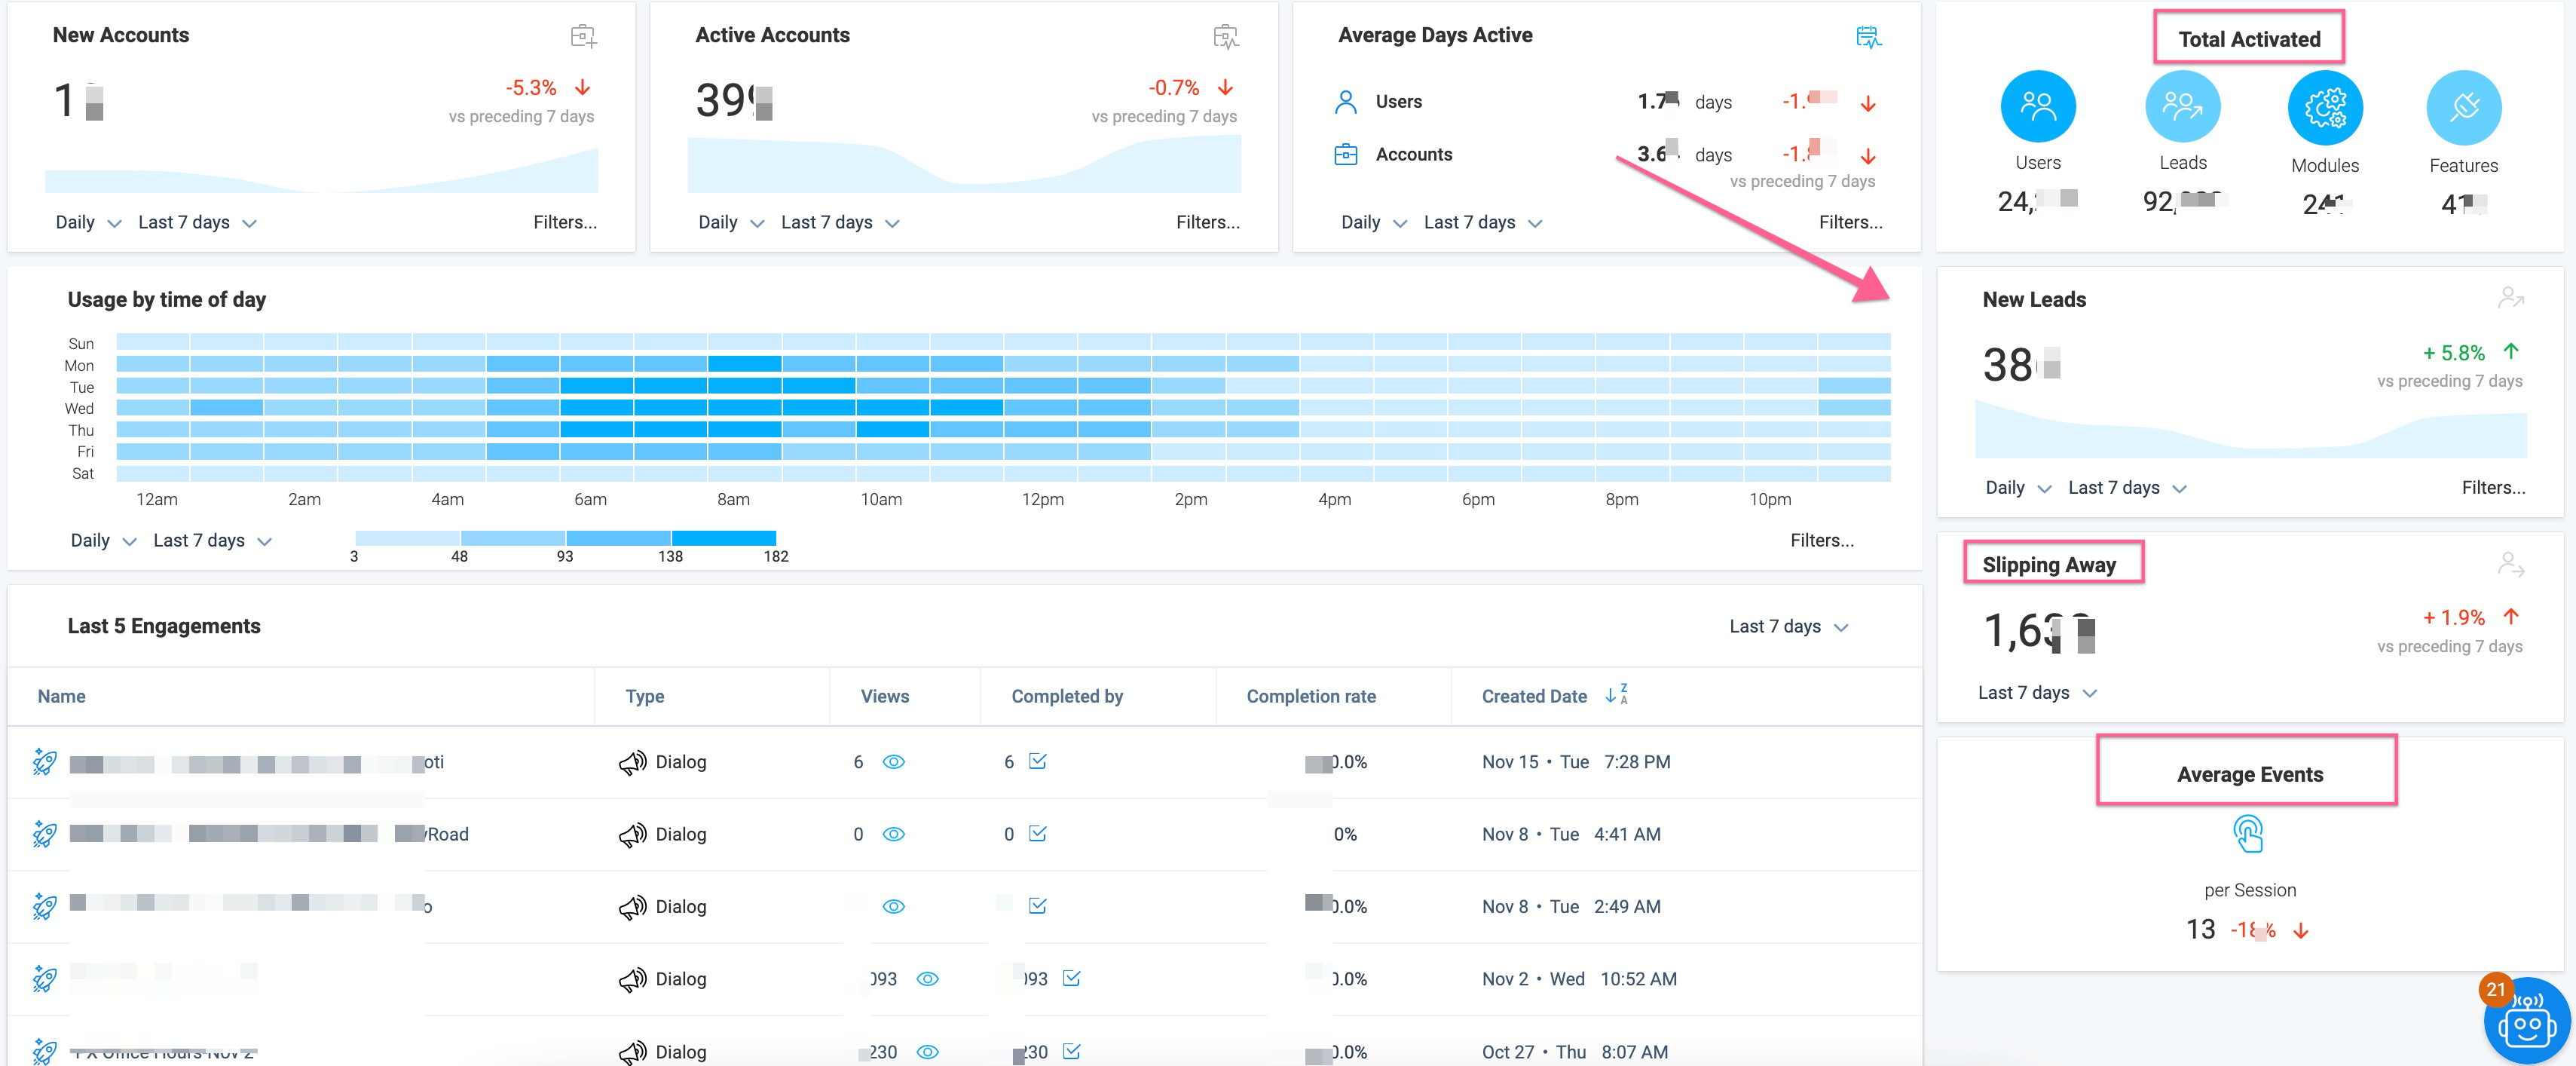
Gainsight PX Dashboard Analytics Terms
The default Gainsight PX Dashboard displays the following three unique widgets that are not available to add in custom dashboards.
- Average Events: This widget displays the average number of events recorded per session, during the selected time period.
- Slipping Away: Slipping away compares two time frames; current and equivalent historical period. If the usage is trending down, it signals the users are slipping away. The number you see on the widget is the number of users who are slipping away. This widget has a built in filter which filters users who had minimal activities with your product, during the selected time period.
- Total Activated: This widget displays the following metrics:
- The total number of Users and the total number of Leads present in your application, from the day PX started tracking your application. You cannot apply any time period for this widget.
- The total number of Modules and Features of your product mapped with the Product Mapper since PX was installed in your application.
| Net Promoter®, NPS®, NPS Prism®, and the NPS-related emoticons are registered trademarks of Bain & Company, Inc., NICE Systems, Inc., and Fred Reichheld. Net Promoter ScoreSM and Net Promoter SystemSM are service marks of Bain & Company, Inc., NICE Systems, Inc., and Fred Reichheld. |