Dashboard Templates
This article explains the different types and uses of templates in PX dashboards.
Overview
Dashboard Templates help to enhance the user experience of creating dashboards for different use cases, with reduced efforts. They are ready-to-use templates with a curated list of widgets that help you customize your dashboard to derive effective information of your product. You can use You can use the pre-configured list of widgets, or even add or remove widgets from other templates to customize the dashboard.
Dashboard Templates
Following are the different types of dashboard templates:
- Adoption
- Onboarding
- Retention
- Trial
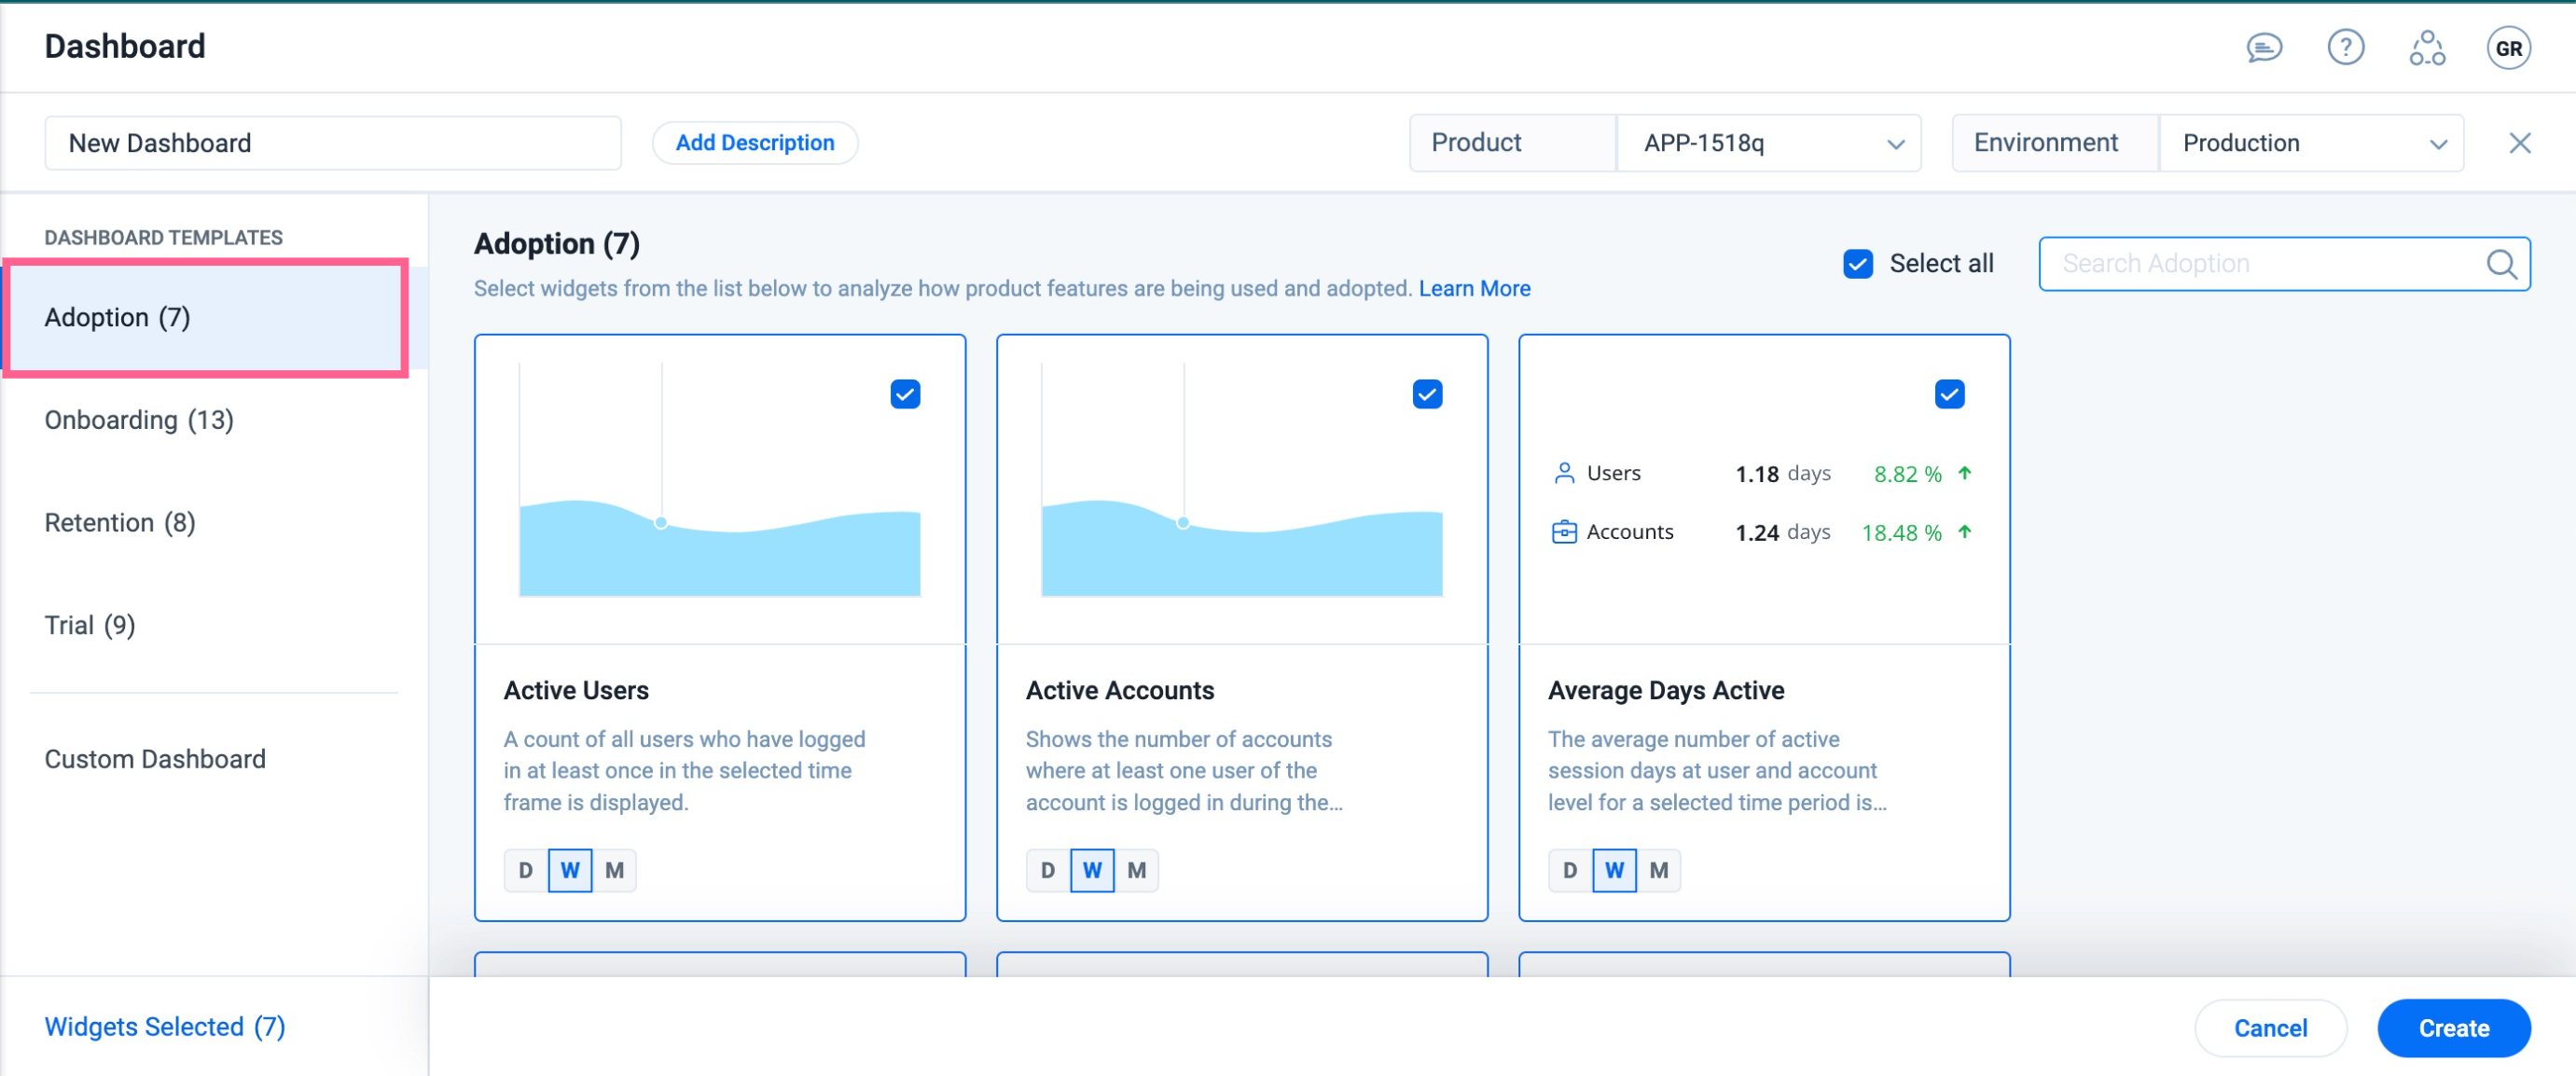
Adoption
The Adoption template for dashboards lists widgets that help to understand and analyze product usage and adoption. For example, consider that you have released a new feature or product for users to try. To ease analyzing the feature adoption, you can use the Adoption template to track:
- Number of active users using the feature.
- Increase or decrease in adoption as compared to the previous time period that you selected.
- Gauge the CES survey feedback.
The below table lists the widgets and the default time granularity configuration in adoption template.
|
Widget |
Graph Selection |
Default Time |
|
Active Users |
Line, Bar, Area(Default), KPI |
4 Weeks |
|
Active Accounts |
Line, Bar, Area(Default), KPI |
4 Weeks |
|
Average Days Active |
NA |
12 Weeks |
|
Feature KPI |
Line, Bar, Area, KPI(Default) |
NA |
|
CES Performance |
Donut |
4 Weeks |
|
Feature Performance |
Line(Default), Bar, Area, KPI |
NA |
|
Retention Analysis |
Line, Bar(Default), Area, KPI |
NA |
For more information on widgets, refer to the Widgets Categories section in the Widgets in Gainsight PX article.
Note: You can select specific or all available widgets from the Adoption template according to your requirement.
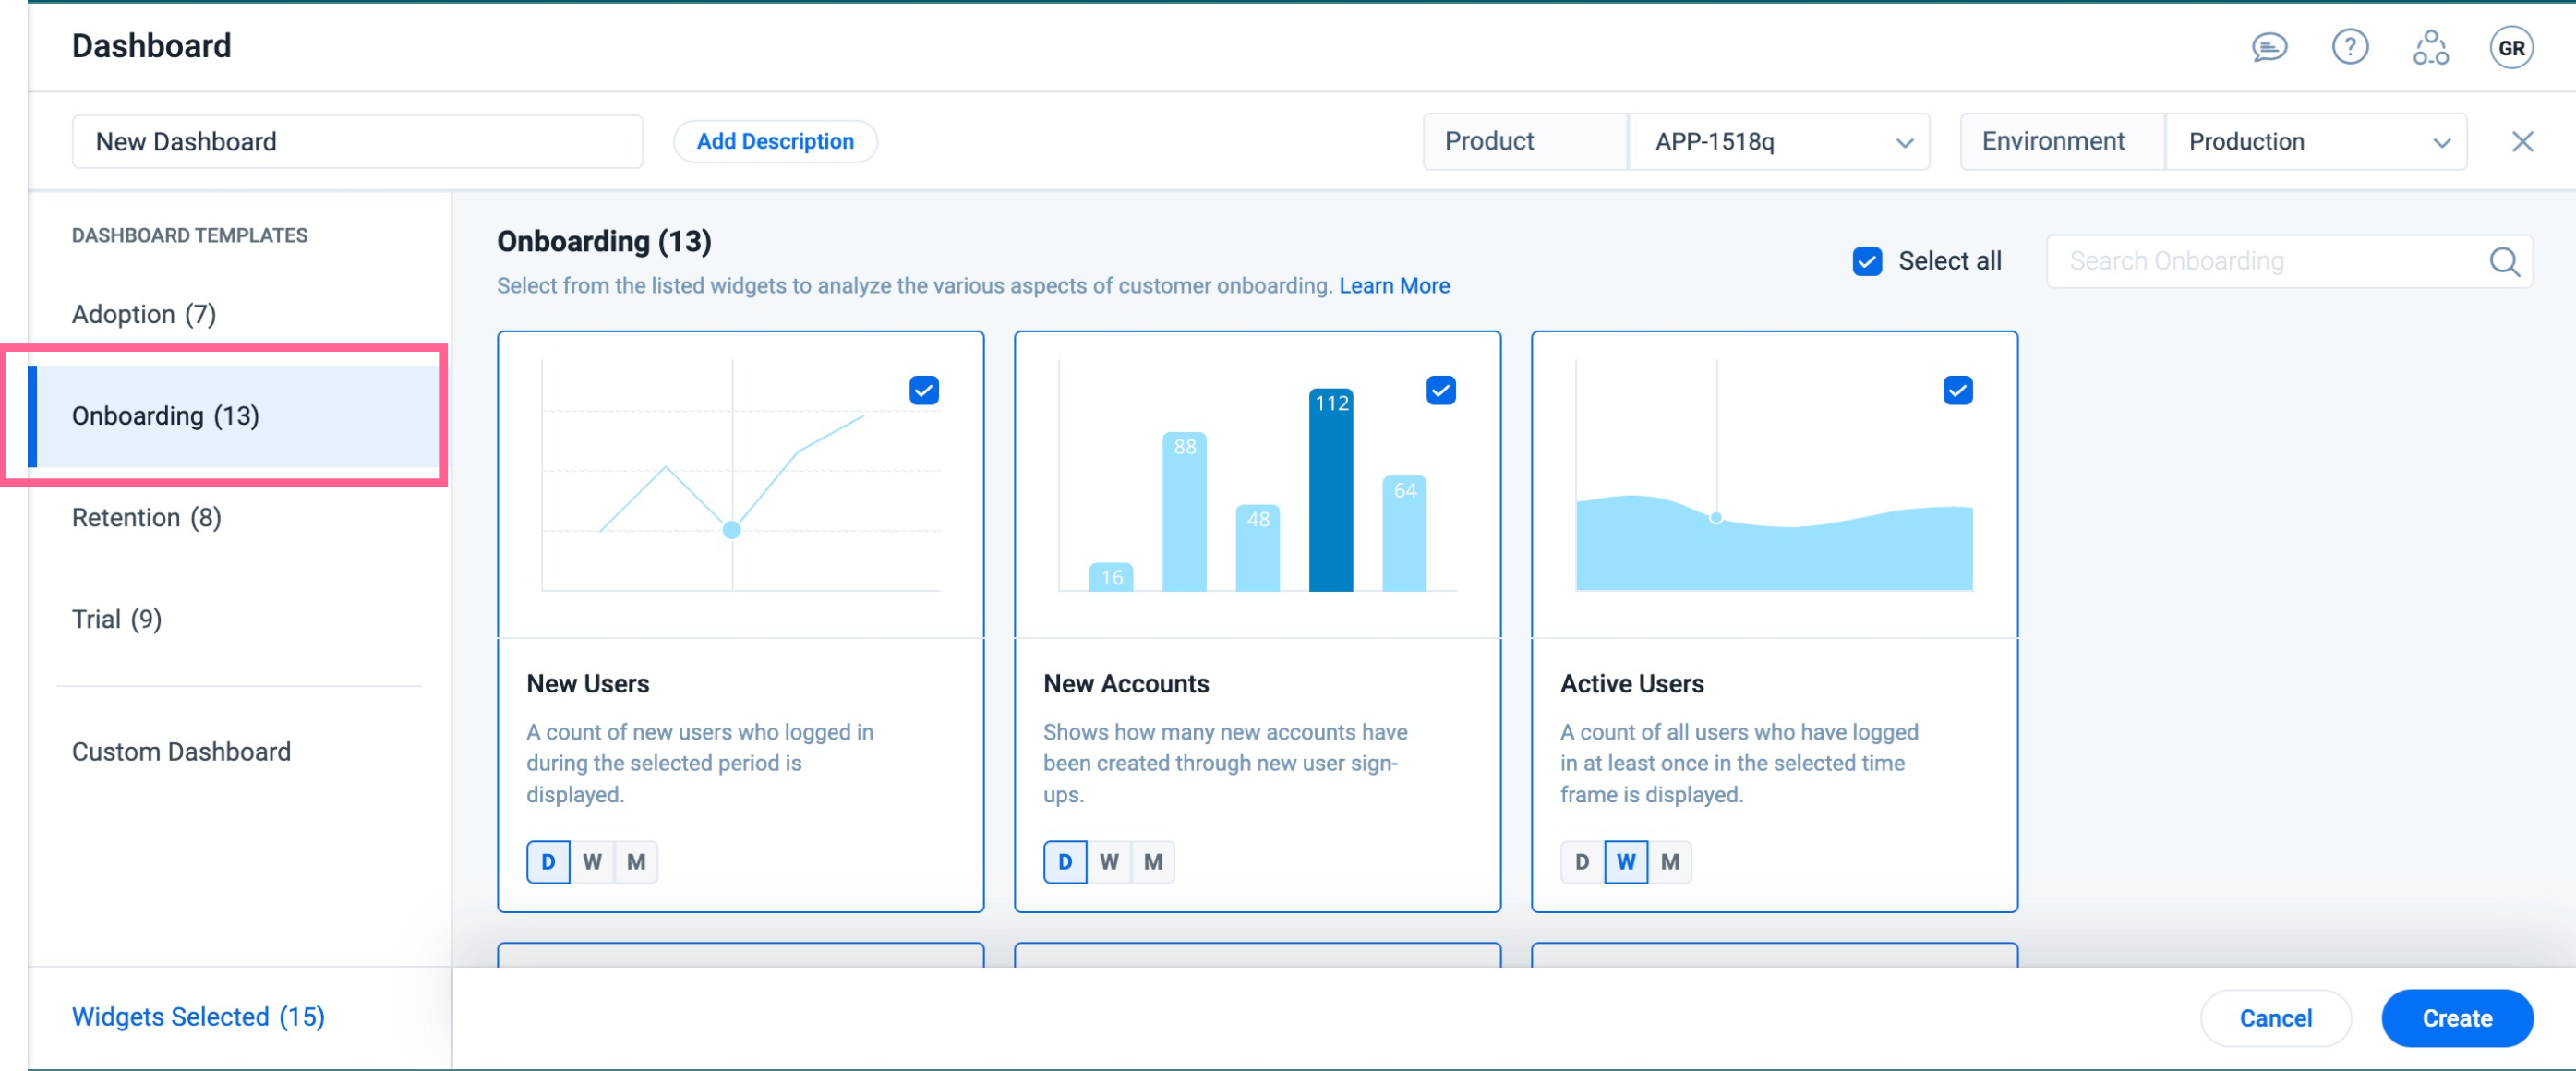
Onboarding
The Onboarding template helps you to understand and analyze the various aspects of your customer's journey, from initial sign-up to product usage. The widgets listed in this template help you to dive deeper into information such as the number of new leads, users and accounts created, session count and session duration in a particular period of time, and so on. Further, you can also analyze feature or product performance, essential metrics such as completion rate, average completion time, and time to step for a Funnel report.
The below table lists the widgets and the default time granularity configuration in onboarding template.
|
Widget |
Graph Selection |
Default Time |
|
Active Users |
Line, Bar, Area(Default), KPI |
4 Weeks |
|
New Users |
Line(Default), Bar, Area, KPI | 30 Days |
|
New Accounts |
Line, Bar(Default), Area, KPI |
30 Days |
|
Active Accounts |
Line, Bar, Area(Default), KPI |
4 Weeks |
|
Average Days Active |
NA |
12 Weeks |
|
Average Session Duration |
NA |
30 Days |
|
Guide Performance |
Line(Default), Bar, Area, KPI |
4 Weeks |
|
Feature Performance |
Line(Default), Bar, Area, KPI |
NA |
|
Session Count |
Line(Default), Bar, Area, KPI |
7 Days |
|
Feature KPI |
KPI |
NA |
|
CES Performance |
Survey |
4 Weeks |
|
NPS Performance |
Survey |
4 Weeks |
|
Funnel |
NA |
NA |
|
Stickiness Ratio |
Line(Default), Bar, Area, KPI |
NA |
For more information on widgets, refer to the Widgets Categories section in the Widgets in Gainsight PX article.
Note: You can select specific or all available widgets from the Adoption template according to your requirement.
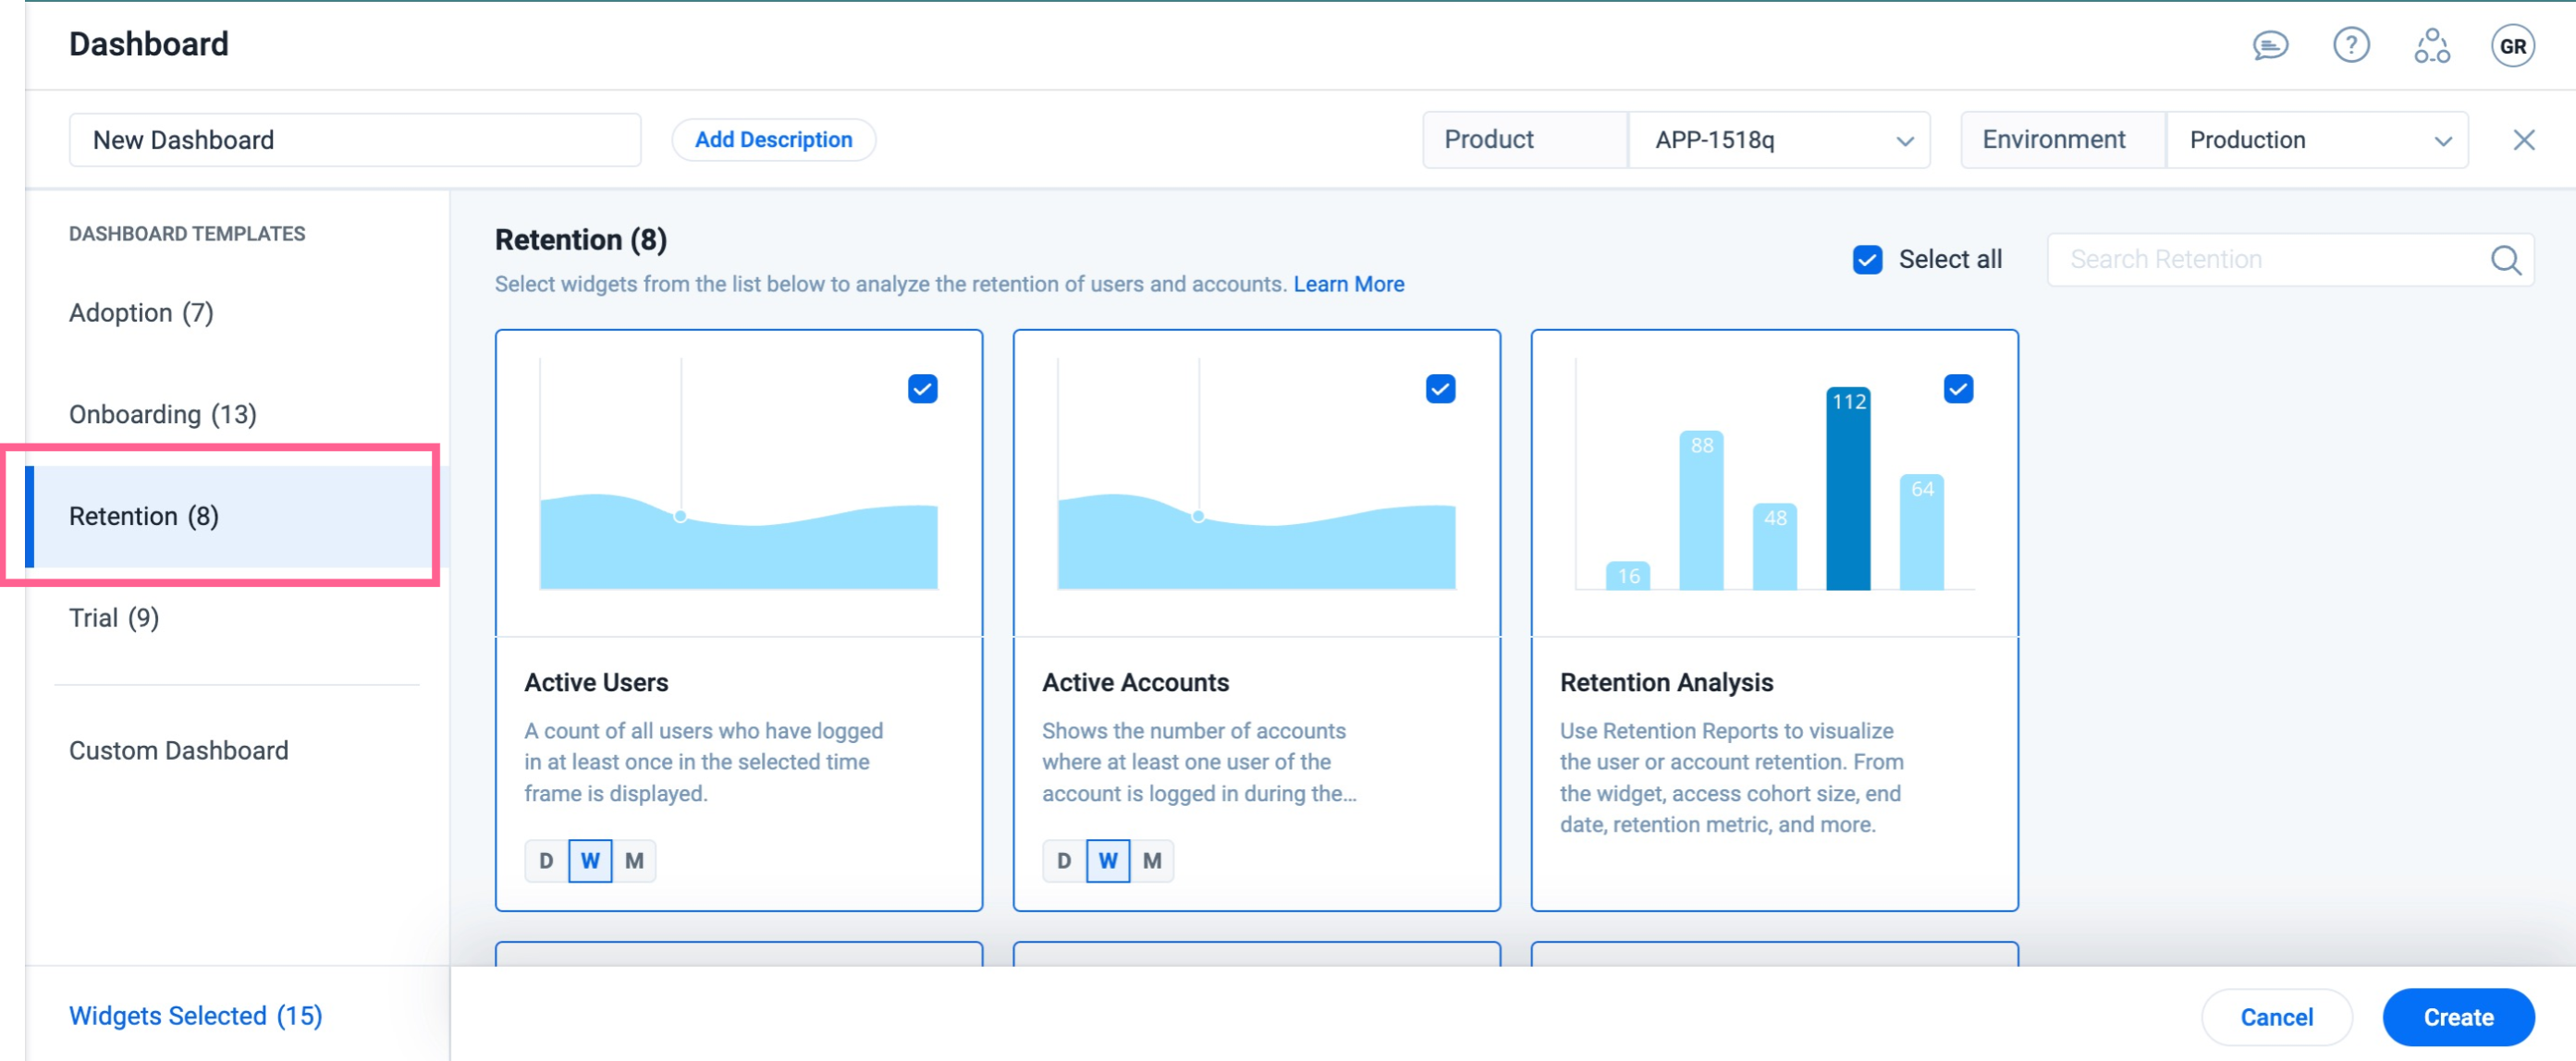
Retention
The Retention template for dashboards list widgets which help to understand and analyze user or account retention. You can use the Retention template to understand adoption and usage metrics of users. Key Widgets in the template are Retention Analysis and Stickiness Ratio.
The below table lists the widgets and the default time granularity configuration in retention template.
|
Widget |
Graph Selection |
Default Time |
|
Active Users |
Line, Bar, Area(Default), KPI |
4 Weeks |
|
Active Accounts |
Line, Bar, Area(Default), KPI |
4 Weeks |
|
Retention Analysis |
Line, Bar(Default), Area, KPI |
NA |
|
Stickiness Ratio |
Line(Default), Bar, Area, KPI |
NA |
|
Feature KPI |
Line(Default), Bar, Area, (KPI) |
NA |
|
NPS Performance |
Survey |
4 Weeks |
|
Feature Performance |
Line(Default), Bar, Area, KPI |
NA |
|
Session Count |
Line(Default), Bar, Area, KPI |
7 Days |
For more information on widgets, refer to the Widgets Categories section in the Widgets in Gainsight PX article.
Note: You can select specific or all available widgets from the Adoption template according to your requirement.
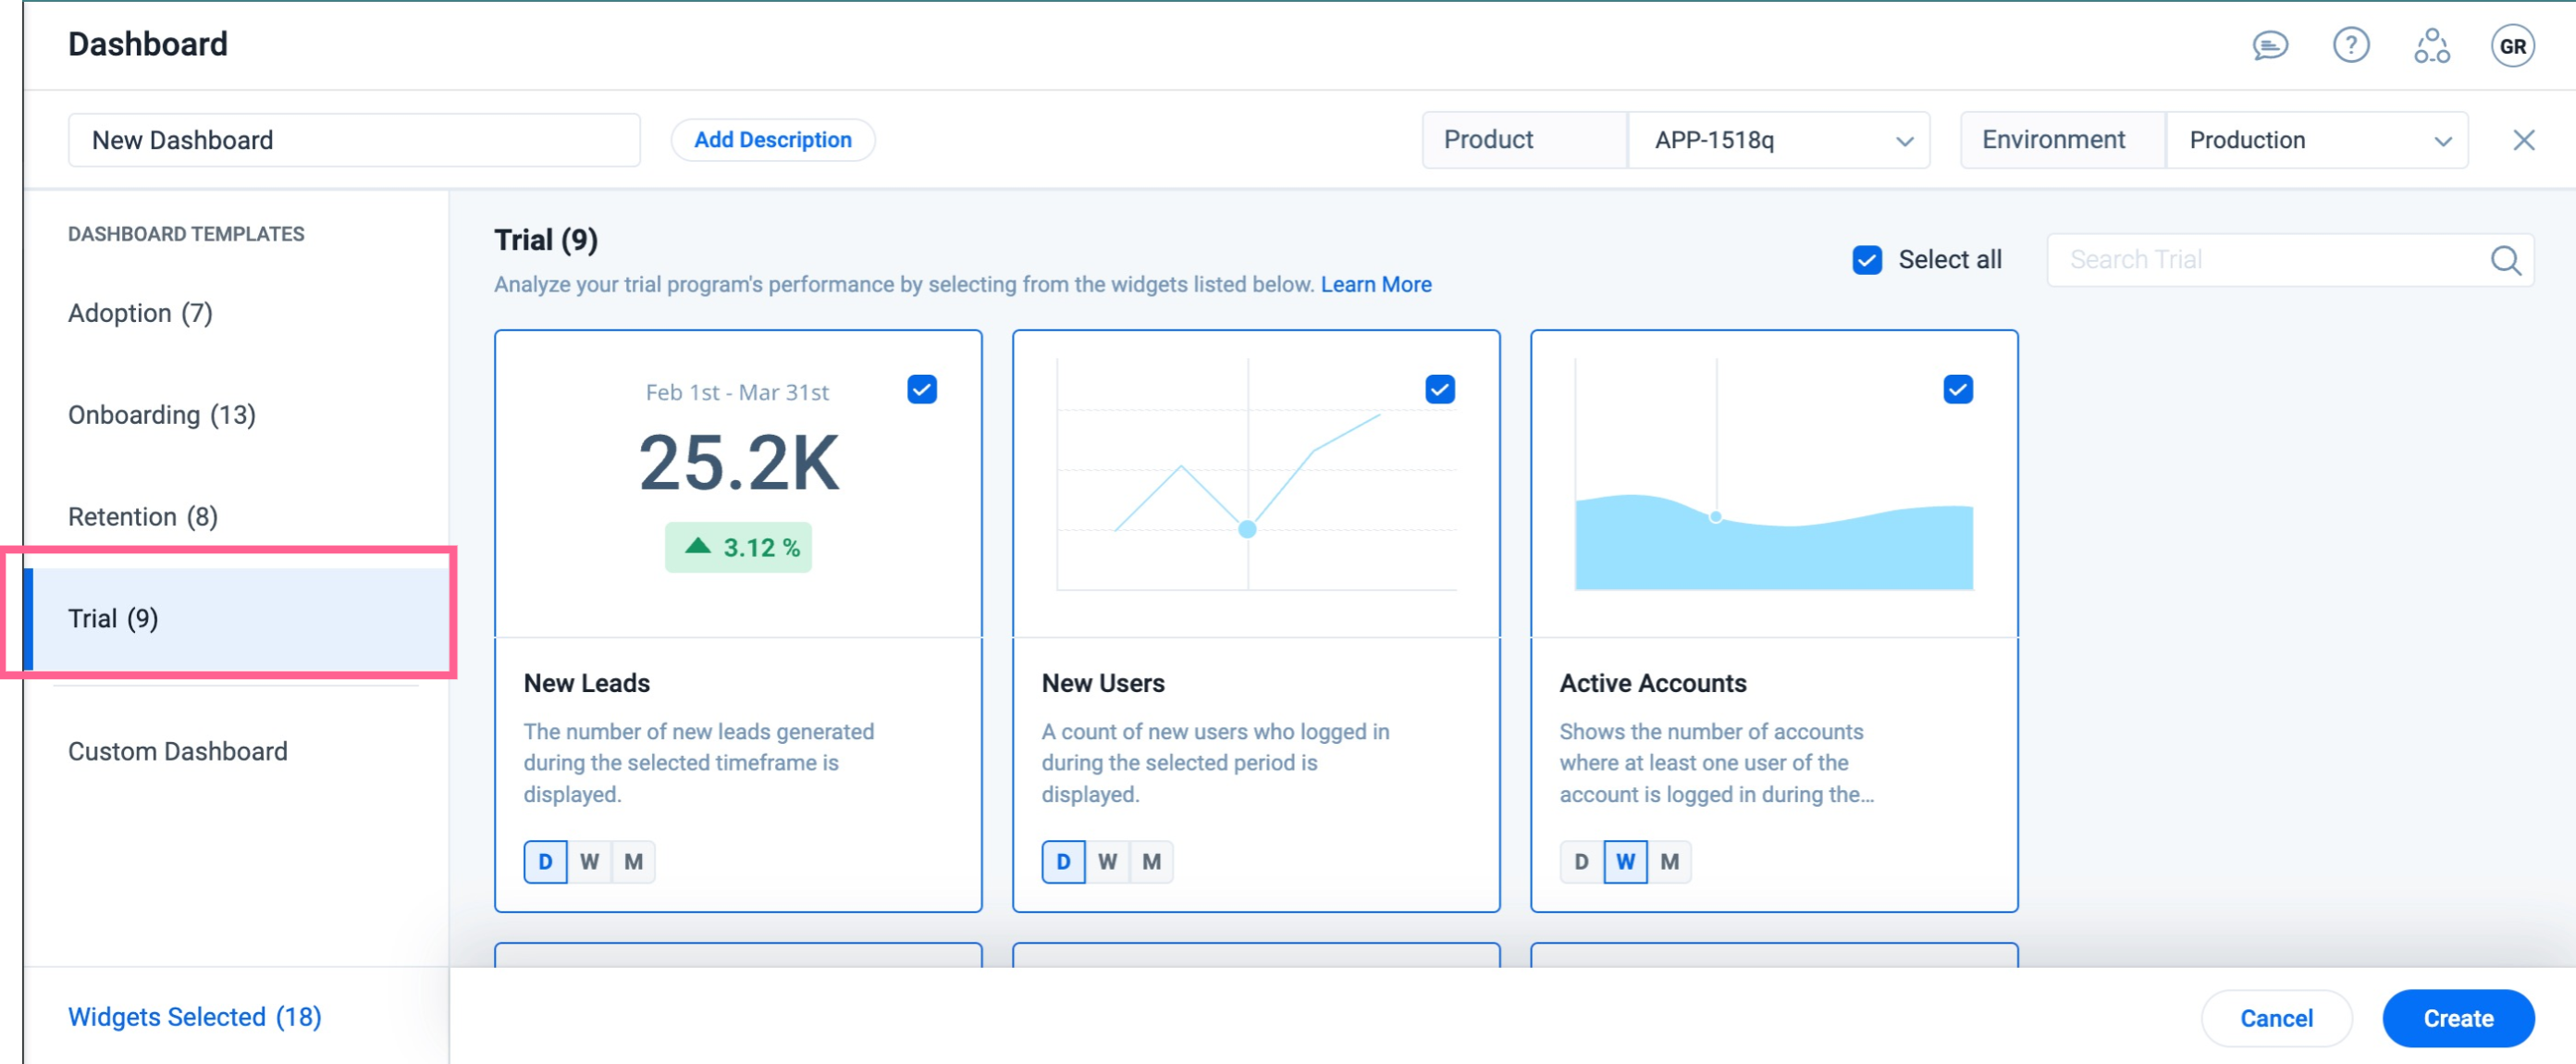
Trial
The Trial template helps you to understand and analyze the holistic performance of your product’s trial program. This template has a list of widgets that cumulatively help derive insights into the product usage of customers who are in the trial period. The widgets listed under this template help you to understand the number of new leads, first time users, number of active accounts, active session durations, and the PX events recorded. It also helps to analyze different cohorts and behaviors for custom events. Retention report helps you to gauge the product performance in trial period.
The below table lists the widgets and the default time granularity configuration in trial template:
|
Widget |
Graph Selection |
Default Value |
|
New Leads |
Line, Bar, Area, KPI(Default) |
30 Days |
|
New Users |
Line(Default), Bar, Area, KPI | 30 Days |
|
Active Accounts |
Line, Bar, Area(Default), KPI |
4 Weeks |
|
Average Session Duration |
NA |
4 Weeks |
|
Events Recorded |
Line, Bar, Area(Default), KPI |
7 Days |
|
Query Builder |
Pie-Chart |
NA |
|
Funnel |
Report |
NA |
|
CES Performance |
Survey |
4 Weeks |
|
Retention Analysis |
Line, Bar(Default), Area, KPI |
NA |
For more information on widgets, refer to the Widgets Categories section in the Widgets in Gainsight PX article.
Note: You can select specific or all available widgets from the Adoption template according to your requirement.
Additional Resources
| Net Promoter®, NPS®, NPS Prism®, and the NPS-related emoticons are registered trademarks of Bain & Company, Inc., NICE Systems, Inc., and Fred Reichheld. Net Promoter ScoreSM and Net Promoter SystemSM are service marks of Bain & Company, Inc., NICE Systems, Inc., and Fred Reichheld. |