Configure PX Dashboards
This article explains how to configure a PX Dashboard, including adding and configuring widgets in Dashboards and sharing a Dashboard. Gainsight recommends that you first read the Gainsight PX Dashboard Overview article and then proceed with this article.
Overview
PX Dashboards offer an interactive way of viewing data. You can create multiple dashboards, customize and share them with users across the subscription.
Business Use Cases
Gainsight PX allows you to create Dashboards and set it with different access permission types. Following are a few examples of the three different permission types offered by Gainsight PX:
- An admin can create a Private dashboard that only he/she can access. This dashboard can help to analyze the performance metrics of a dialog engagement, announcing a new feature that allows users to provide feedback for support articles, launched to a segment of users.
- An admin can create a Public dashboard that shares common metrics for the subscription and make it accessible to all the users within the subscription.
- Consider that an Account Management team in your company needs to view a dashboard that shows widgets related to all the relevant account information. An admin user can now create the required dashboard and share with the team members with customized access permissions (view/edit) for each user.
Create a Dashboard
This subsection explains how to create a new dashboard using the dashboard templates or build a custom dashboard.
To create a new dashboard:
- Log into Gainsight PX with your account credentials.
- Navigate to Dashboard from the main menu.
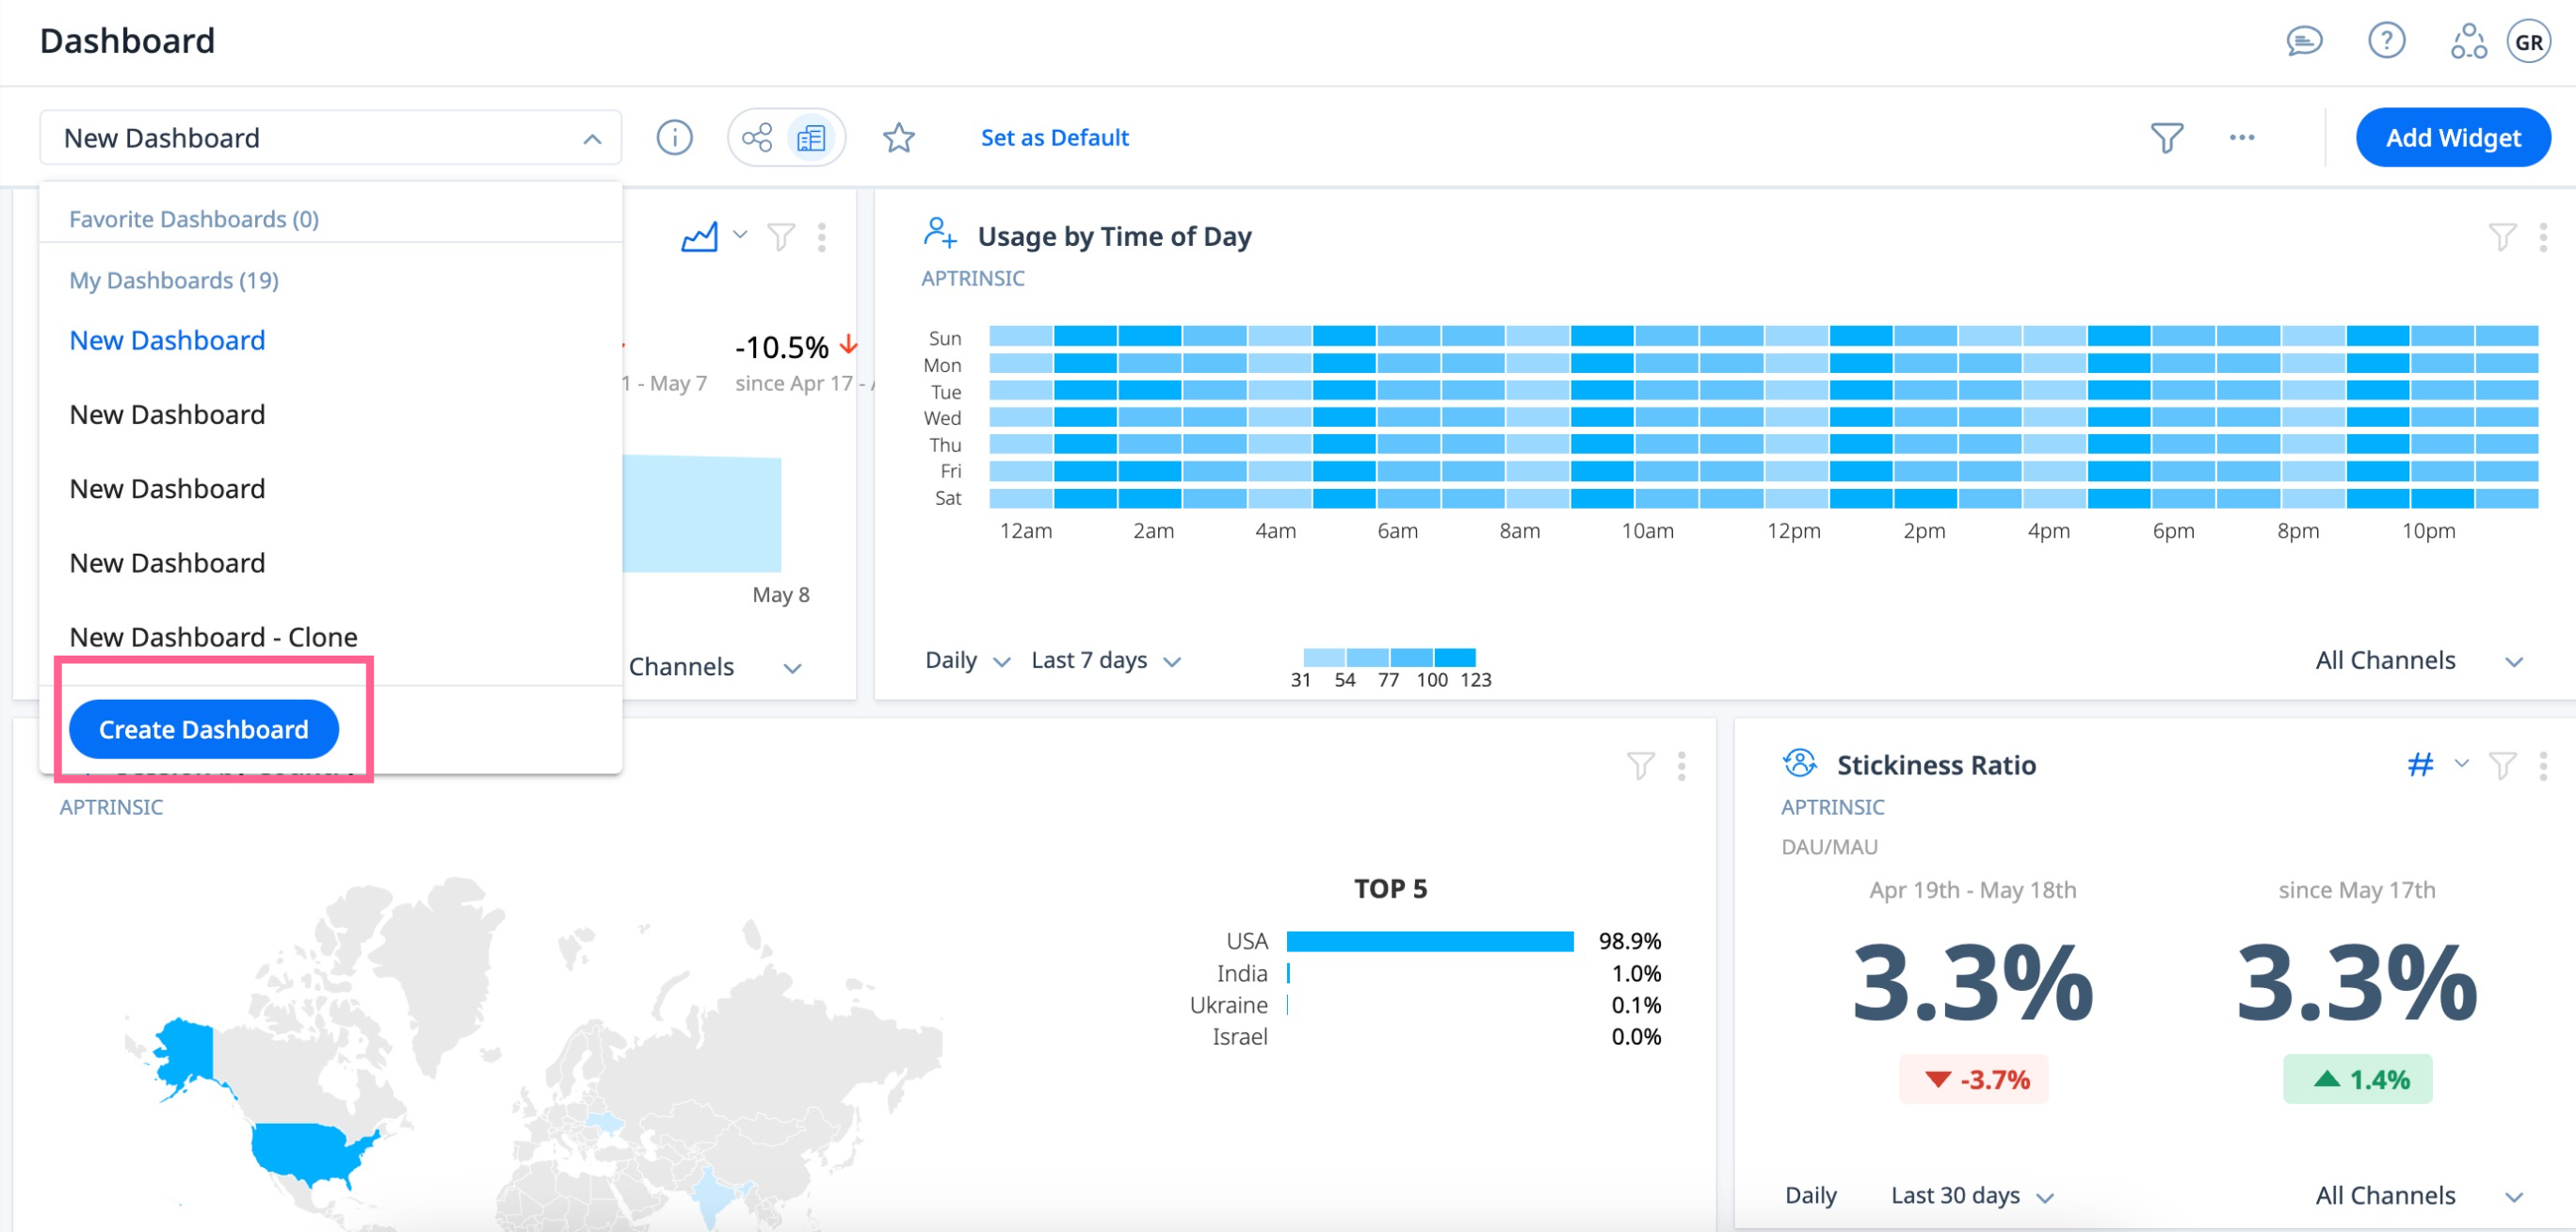
If a dashboard is already loaded, click Create Dashboard from the dashboard dropdown list.
If you have not created any Dashboards so far, click Create your first Dashboard. The Dashboard screen appears.
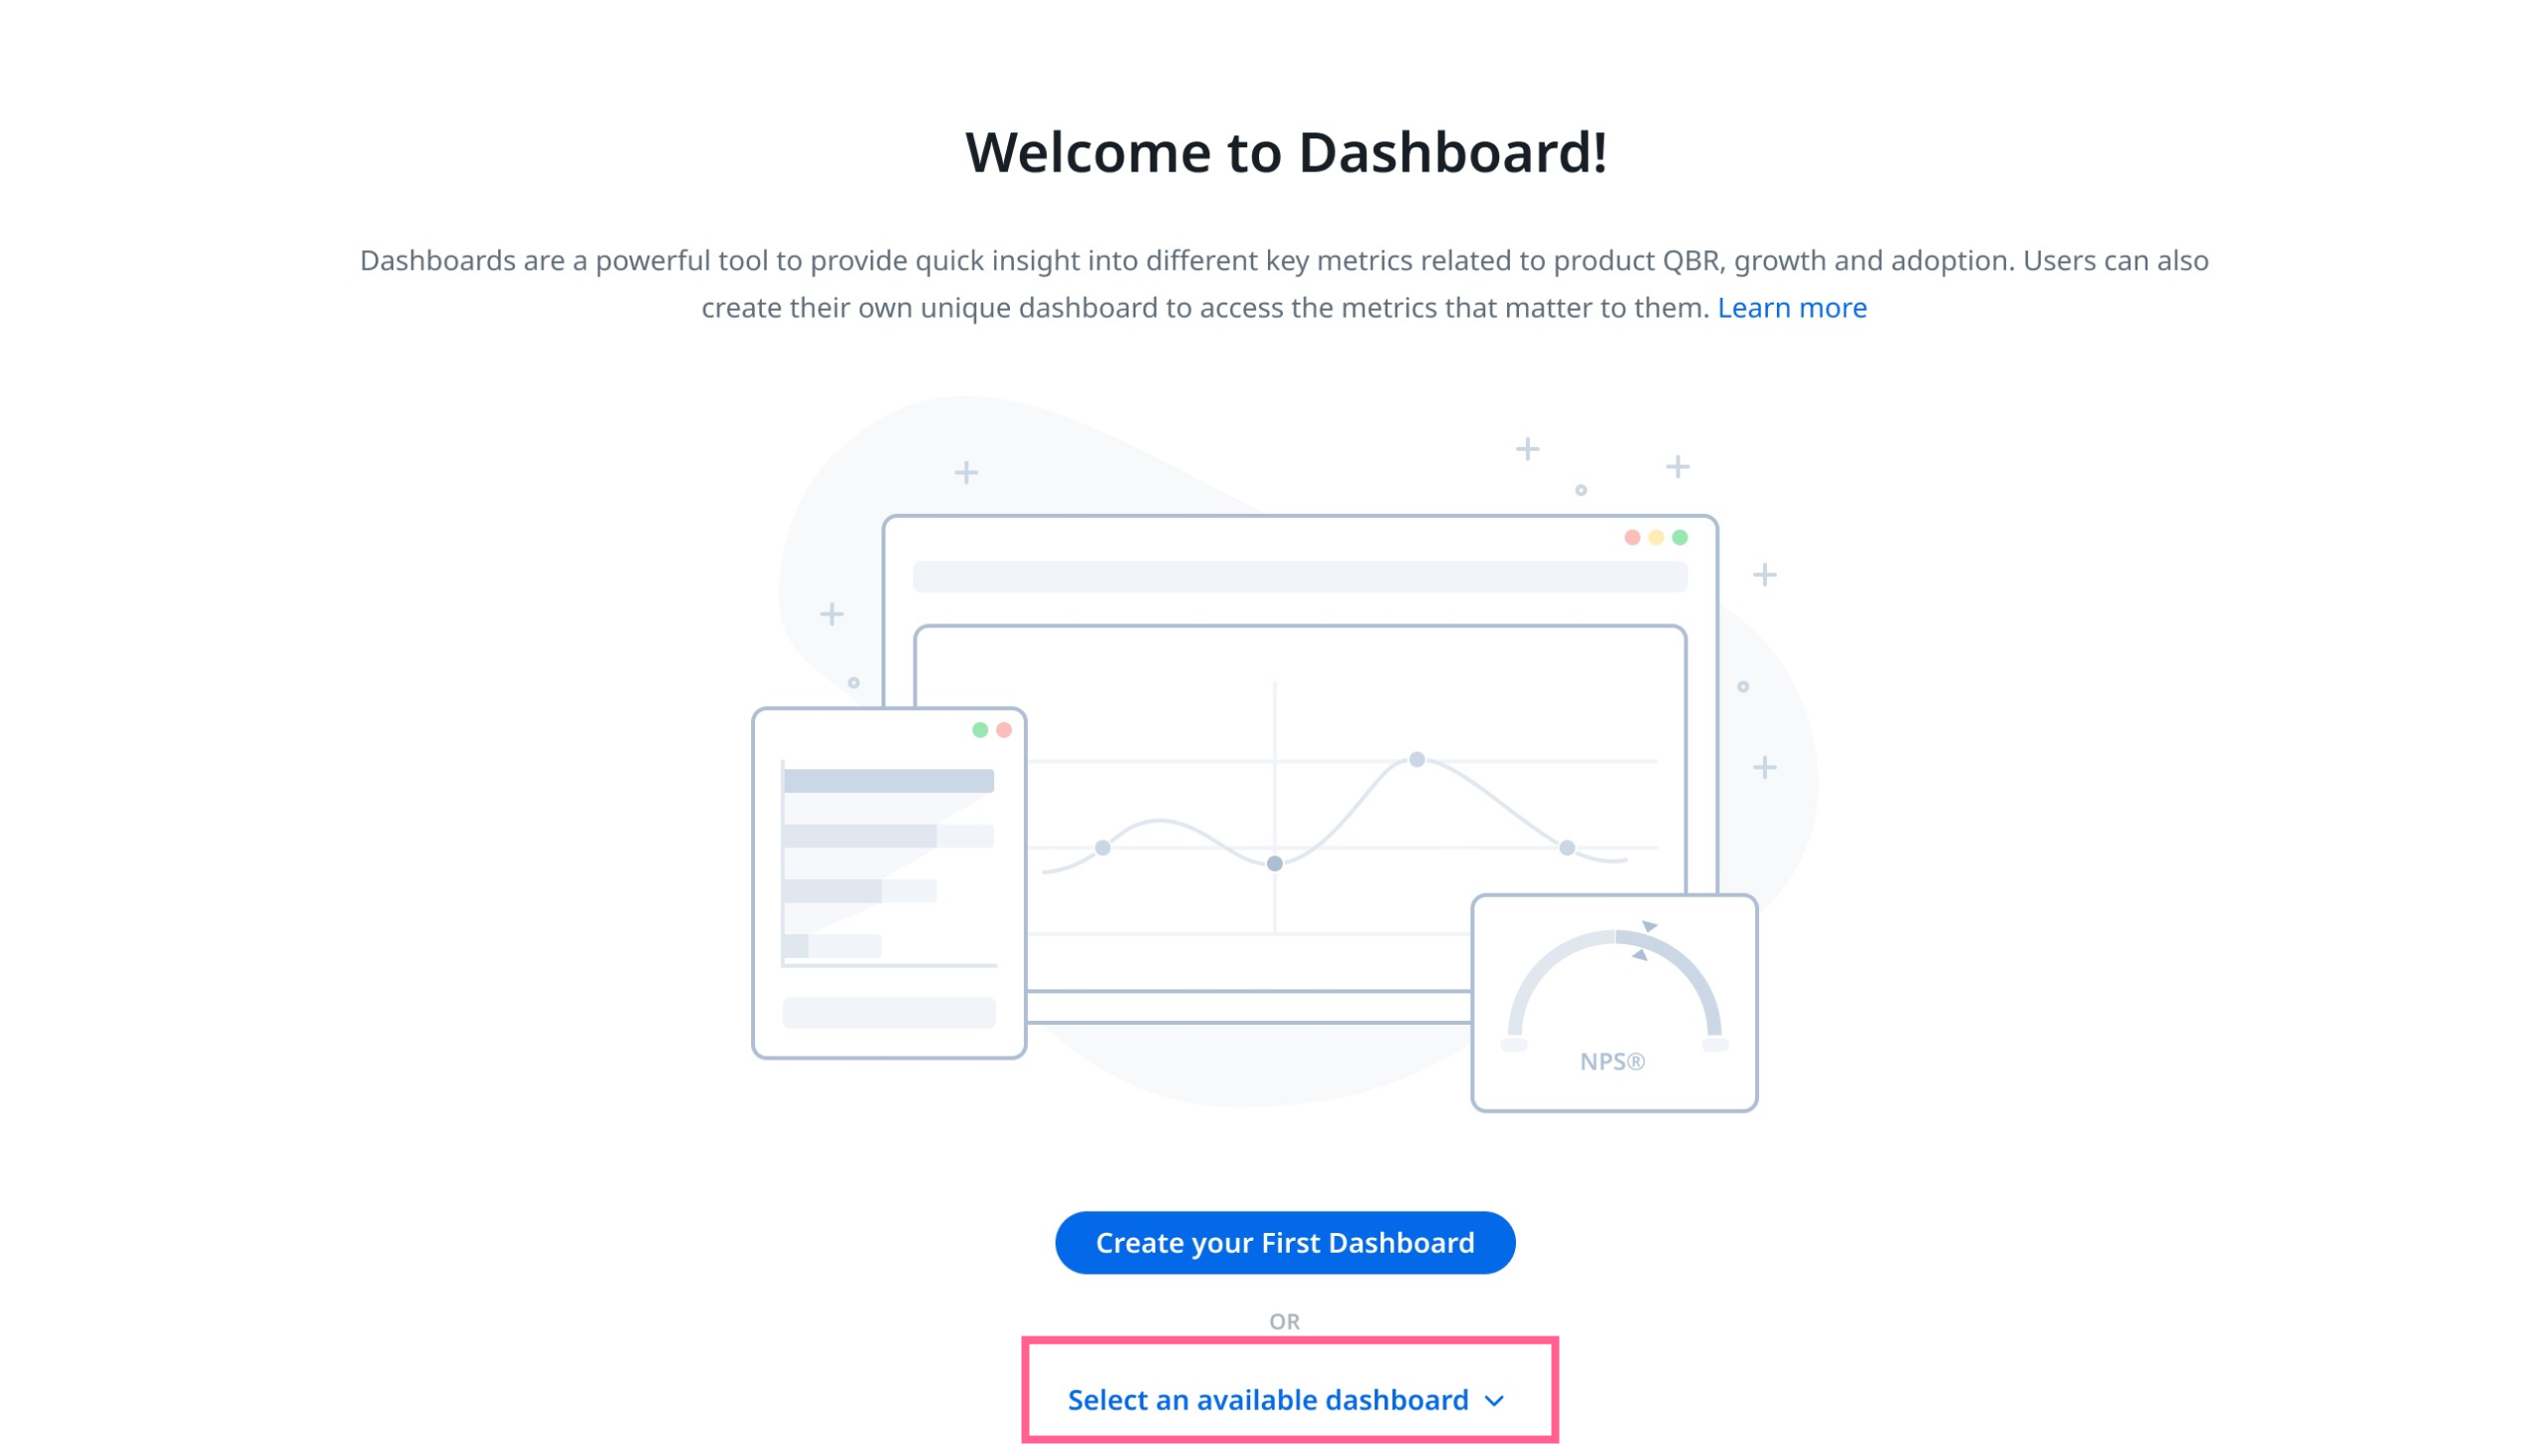
- (Optional) Click Select an Available Dashboard if you do not want to create a new dashboard, and want to choose an existing dashboard. The drop-down lists the Favorite Dashboards, My Dashboards, Shared Dashboards, and Public Dashboards. This drop-down helps you to select and navigate easily to the required dashboard.
- In the Dashboard screen, provide the following details:
- In the Name field, enter a name for the dashboard.
- (Optional) In the Description field, provide more details about the dashboard.
- (Optional) If there are multiple products in the subscription, select the product to which the Dashboard is applicable.
- (Optional) Select the product environment.
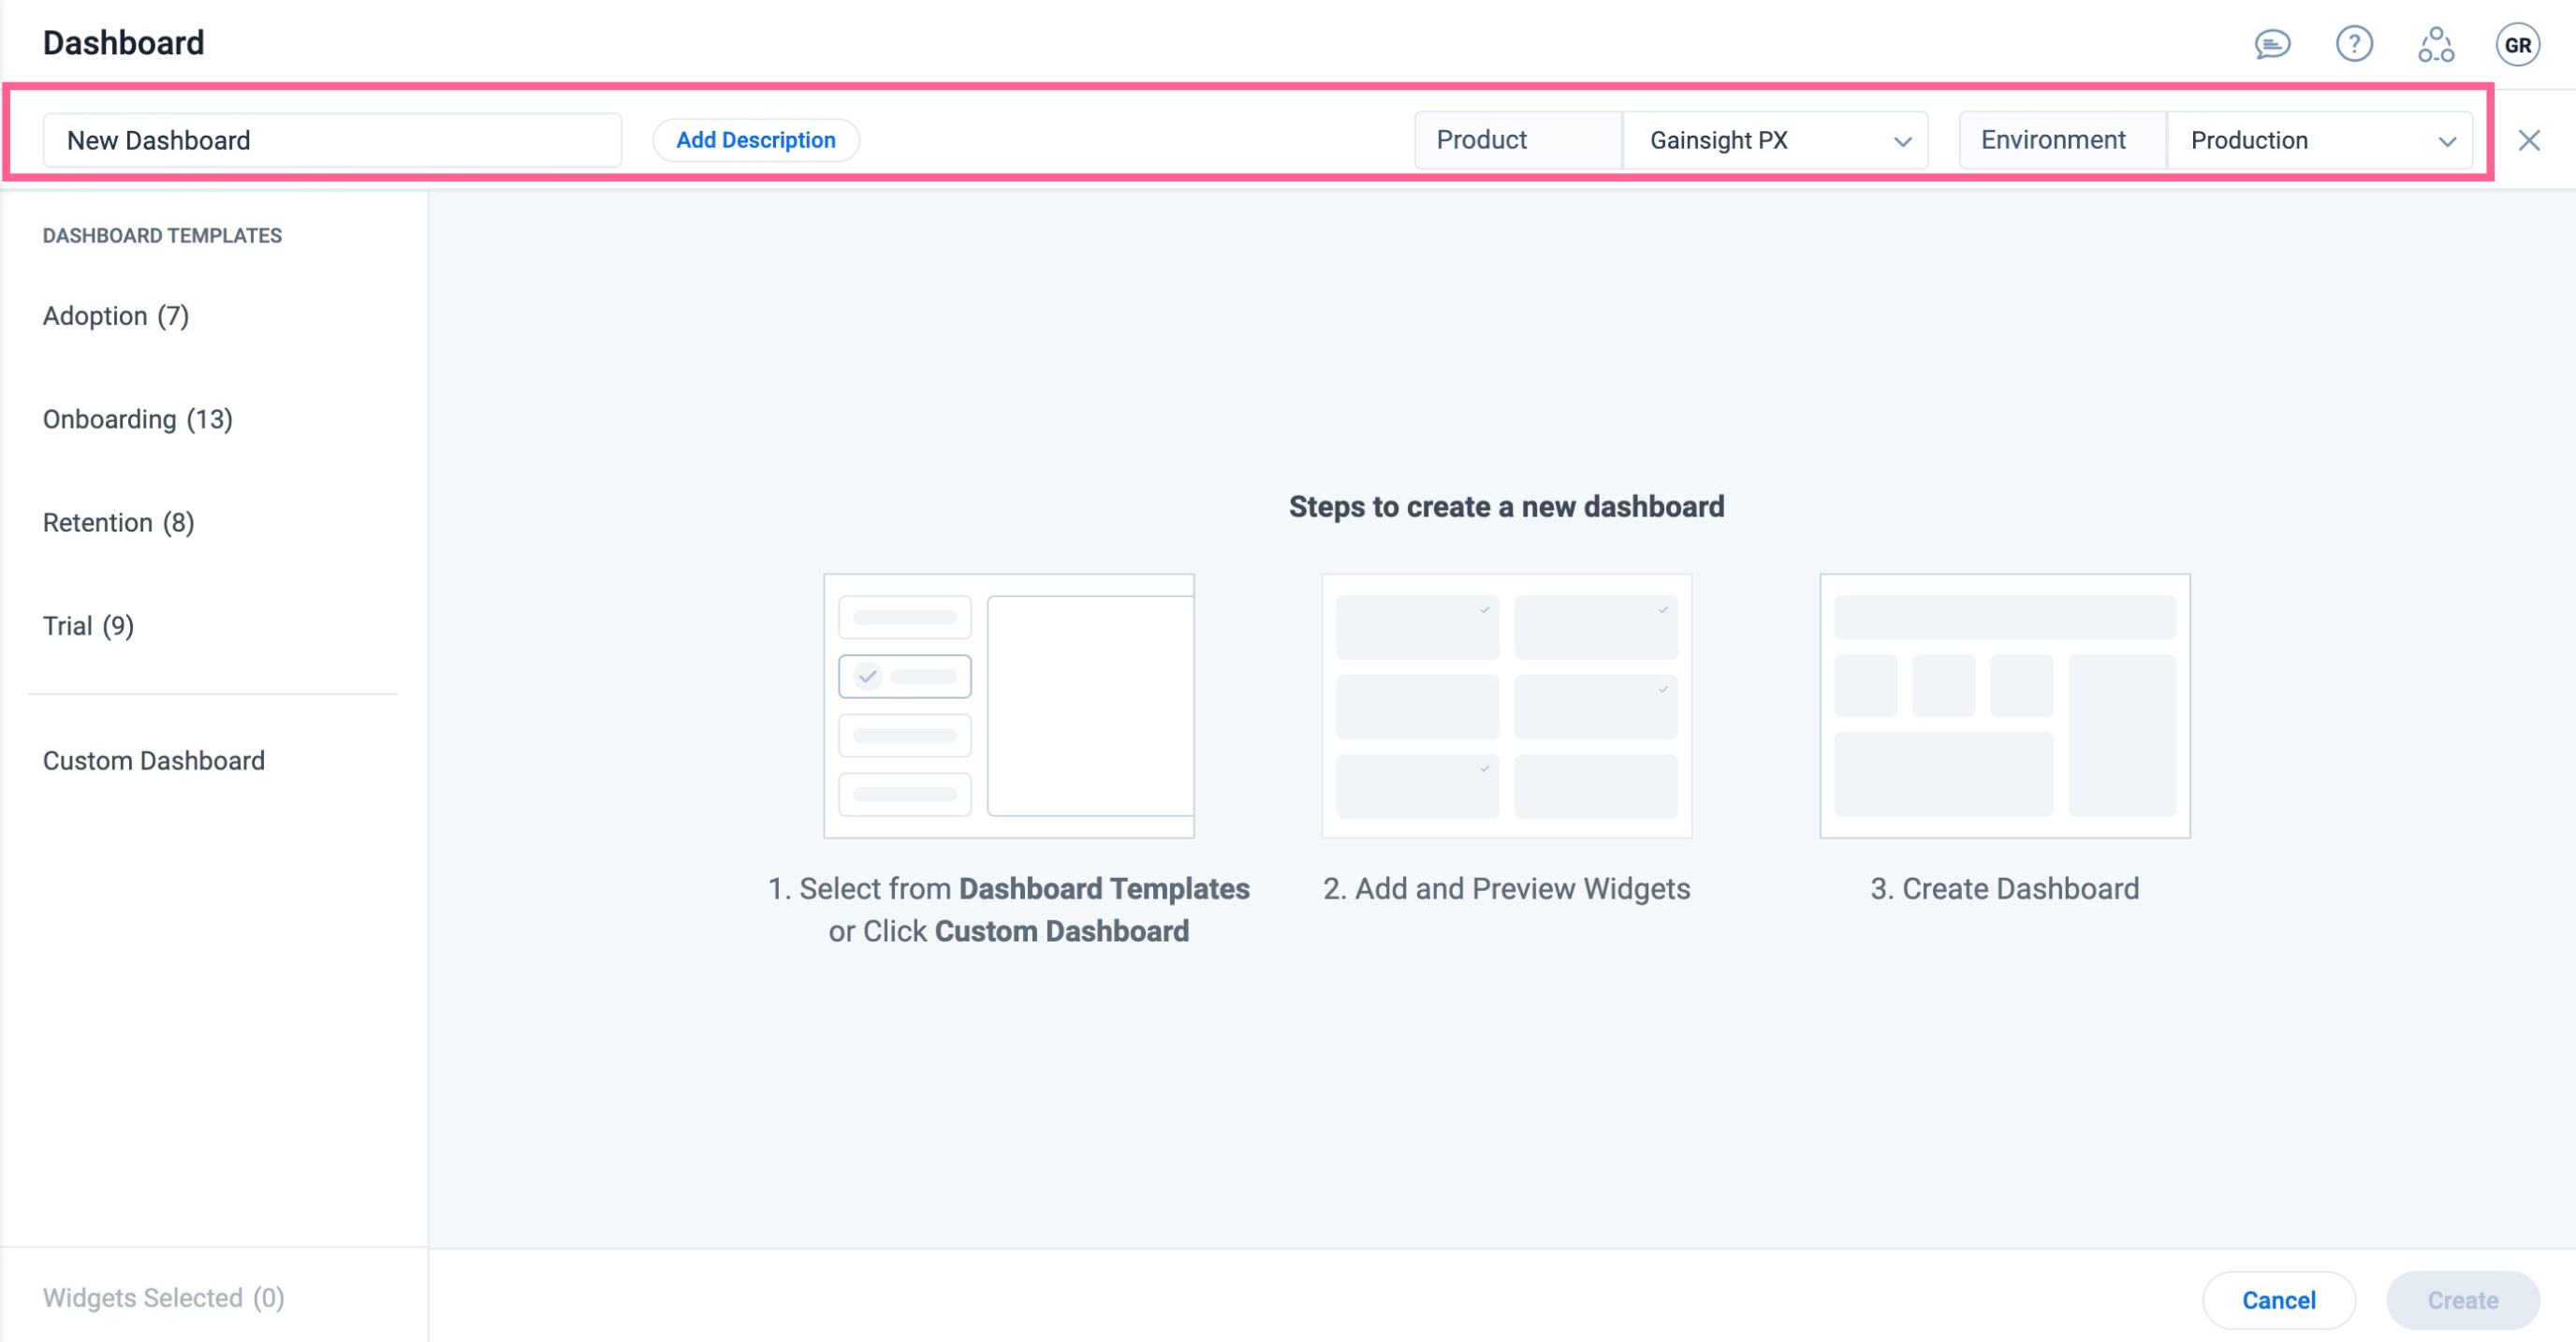
You can create dashboards in one of the following ways:
- Dashboard Templates: Create a dashboard from a curated list of templates based on your use case. For more information, refer to the Create Dashboard Using Templates section.
- Custom Dashboards: Create a customized dashboard using widgets based on your use case. For more information, refer to the Create Custom Dashboard section.
Create Dashboard Using Templates
The following out of the box dashboard templates are available to create a dashboard quickly:
- Adoption
- Onboarding
- Retention
- Trial
To create a dashboard using a template:
- In the Dashboard window, click Dashboard Templates.
- Select the template based on your business needs.
- Select the desired widgets listed within the template to add them to your dashboard. For more information on templates, refer to Dashboard Templates article.
Note: You can search for specific widgets or use the Select all option to add all the widgets available in the template to your dashboard. 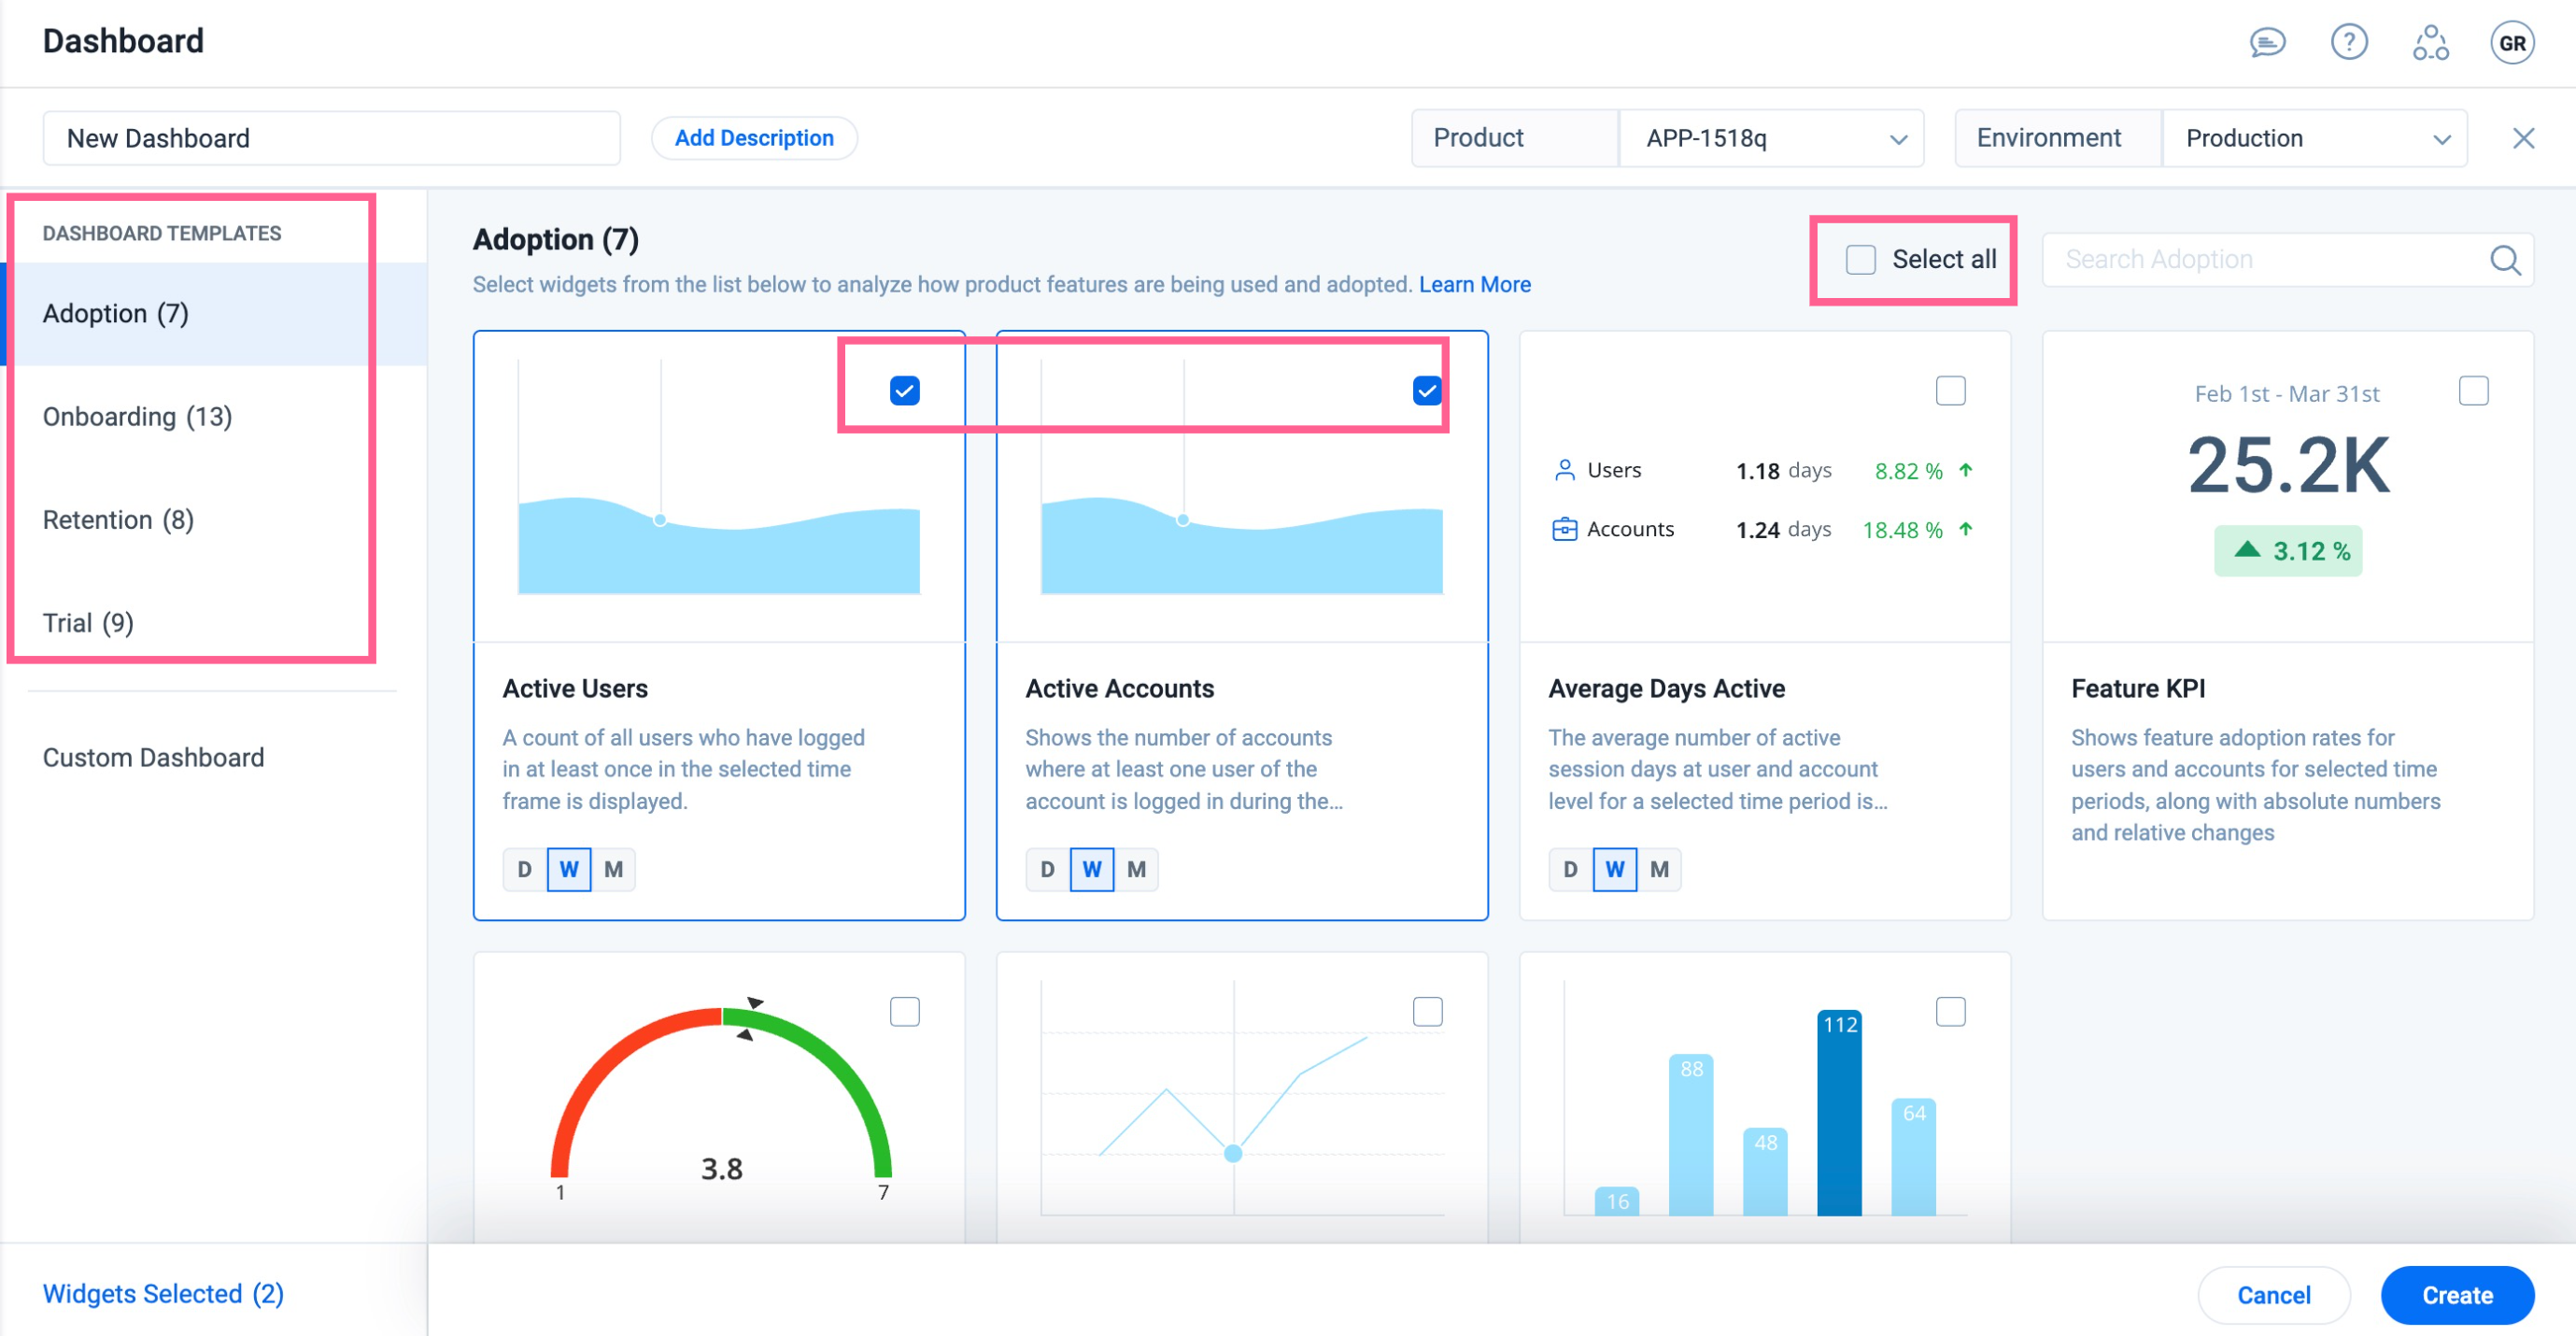
- For each widget, hover over the widget and select the visualization type from the available options.
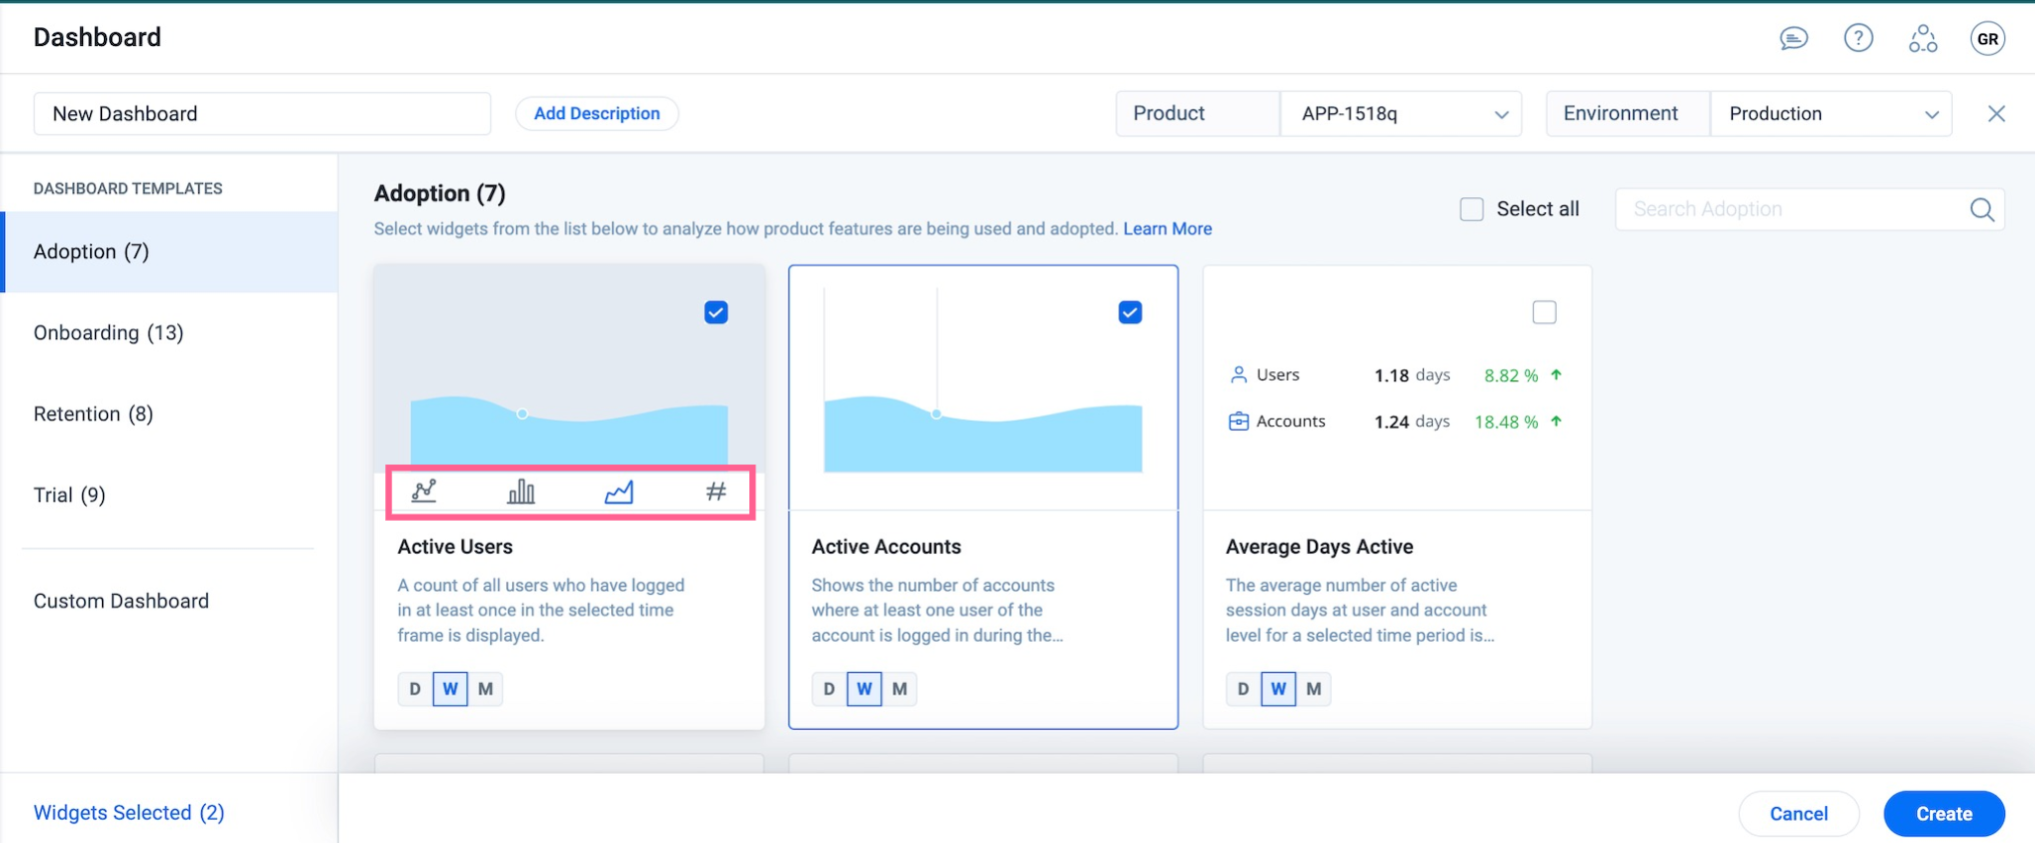
- Select the time granularity in Days, Weeks, or Months to display the data.
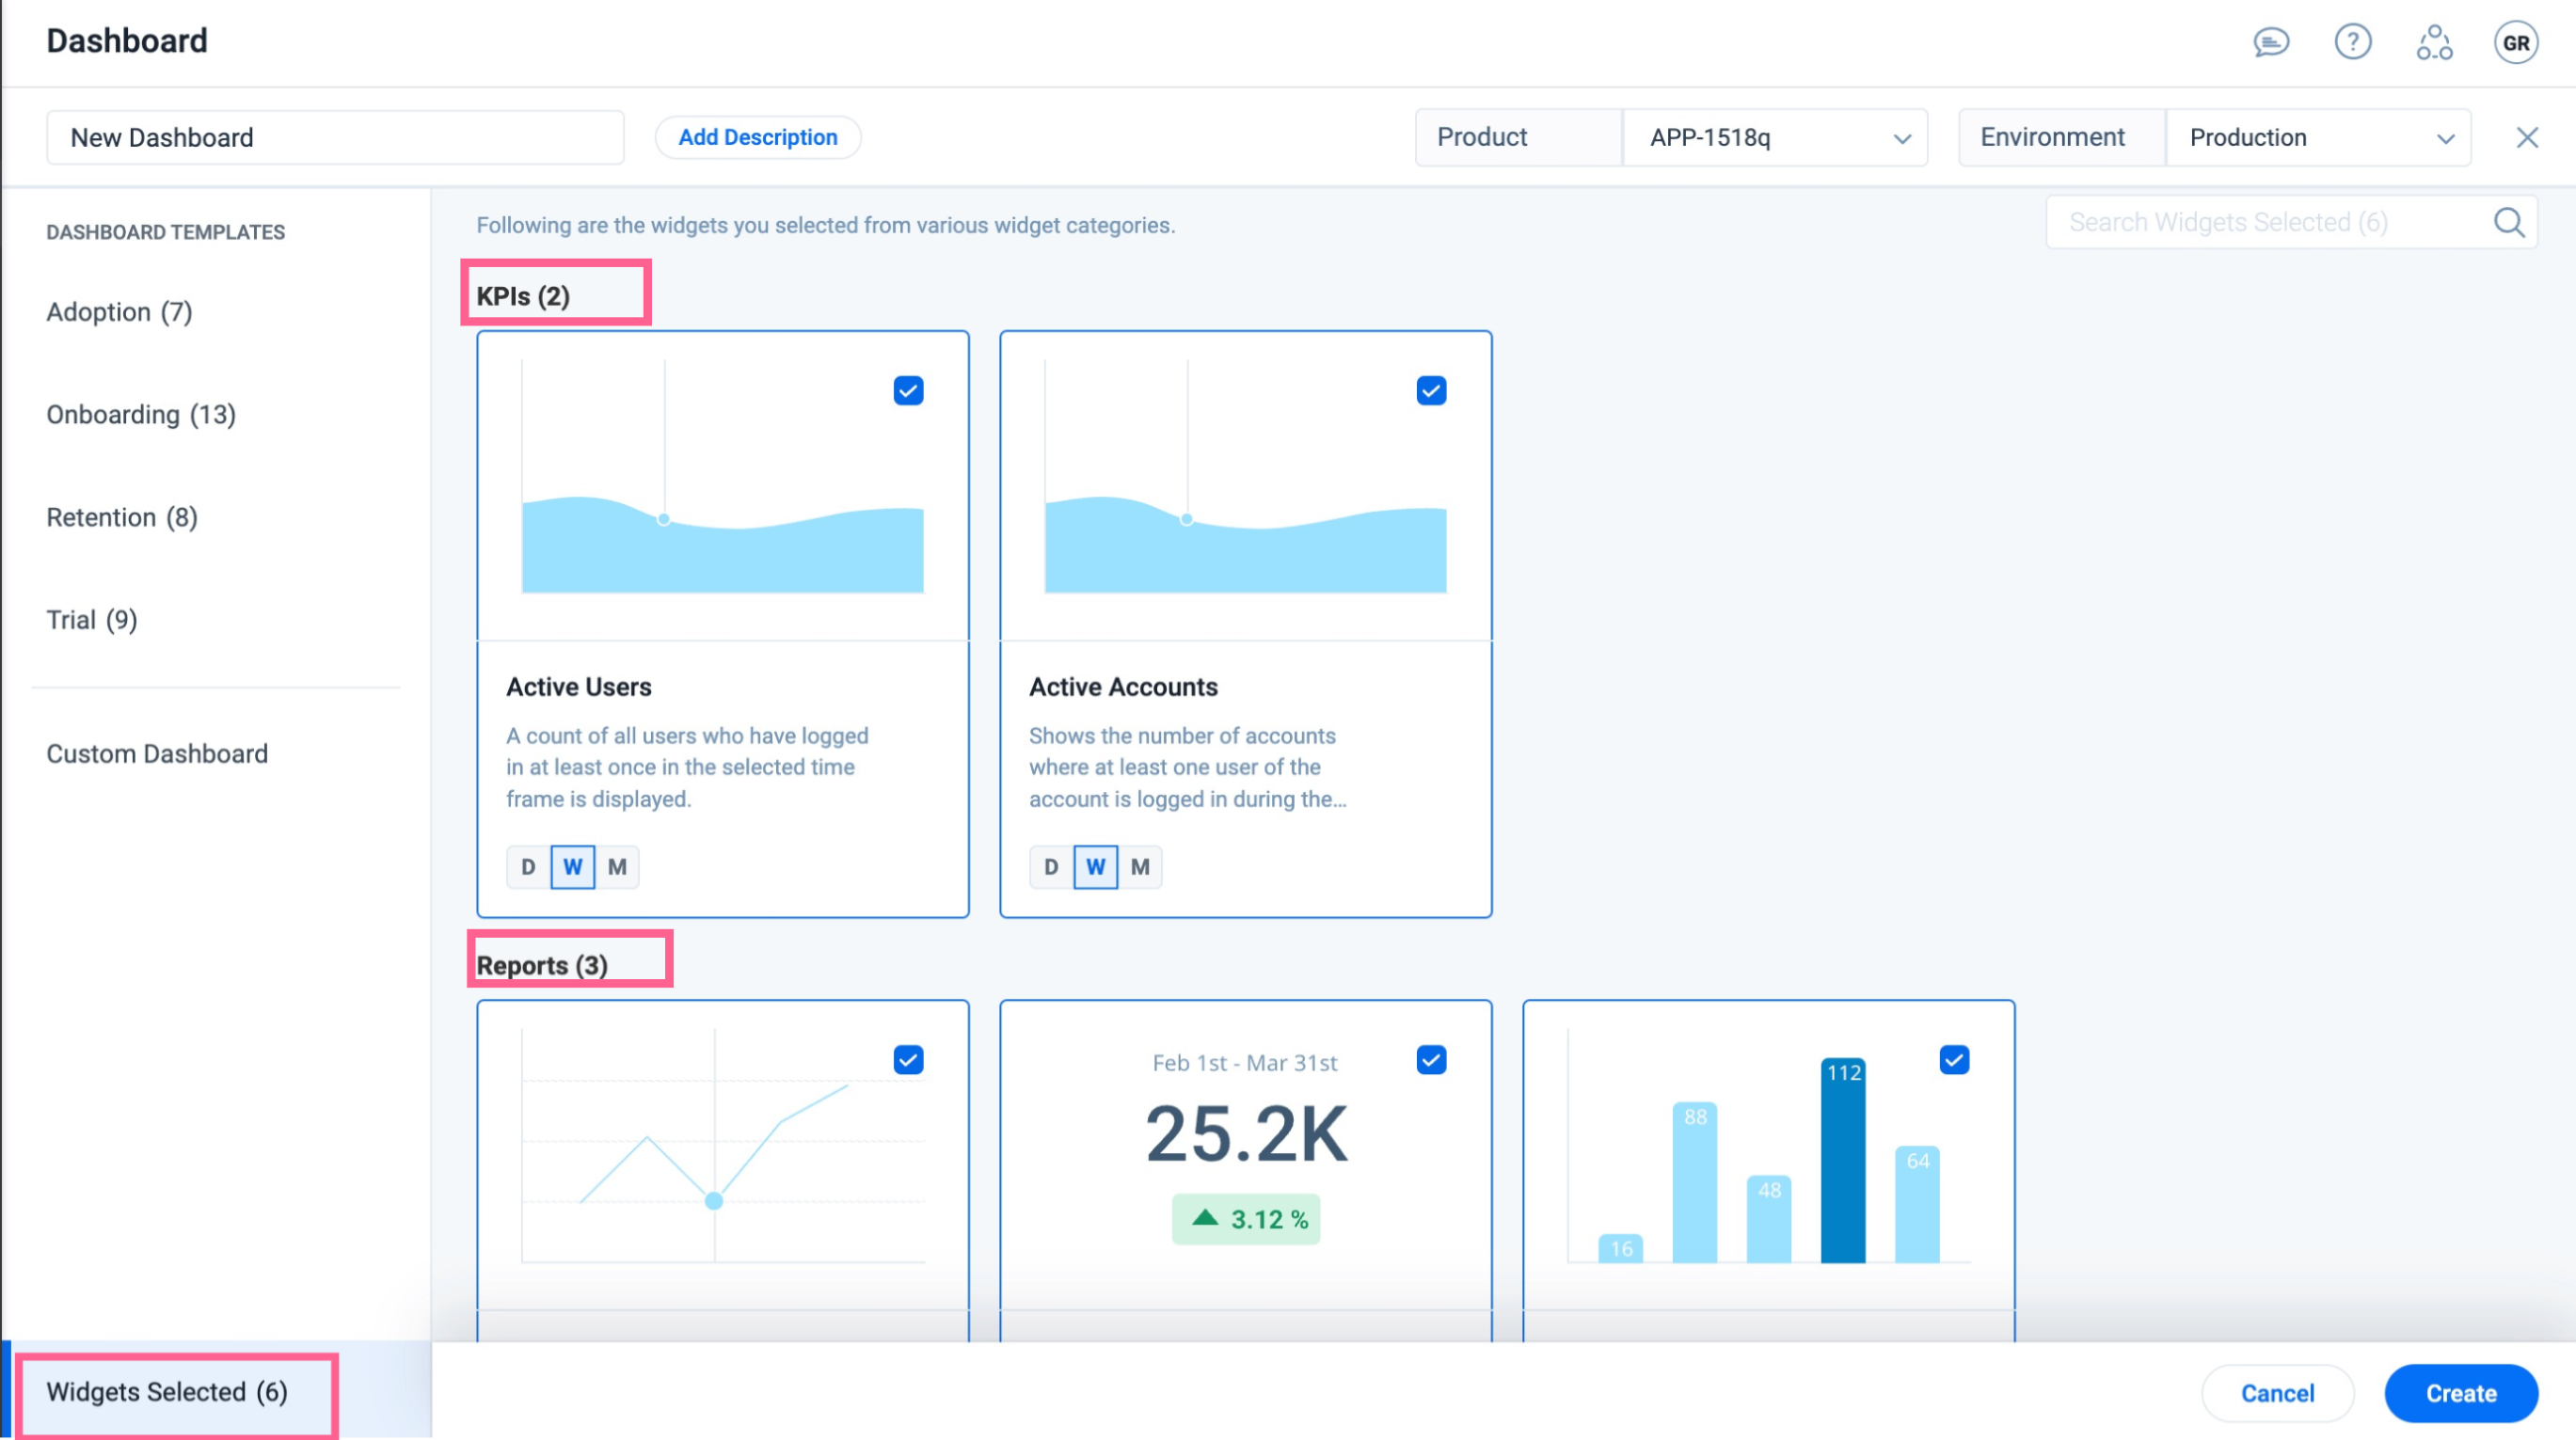
- (Optional) From the bottom-left corner of the screen, click Widgets Selected to preview the selected widgets from different widget categories.
- Click Create. The new private dashboard is created. To change the access permissions, refer to the Set Access Permissions on Dashboard section.
- (Optional) Click Add Widget to add additional widgets from multiple widget categories.
Create Custom Dashboards
You can select and add widgets individually based on your business requirements to create a custom dashboard.
To create a custom dashboard:
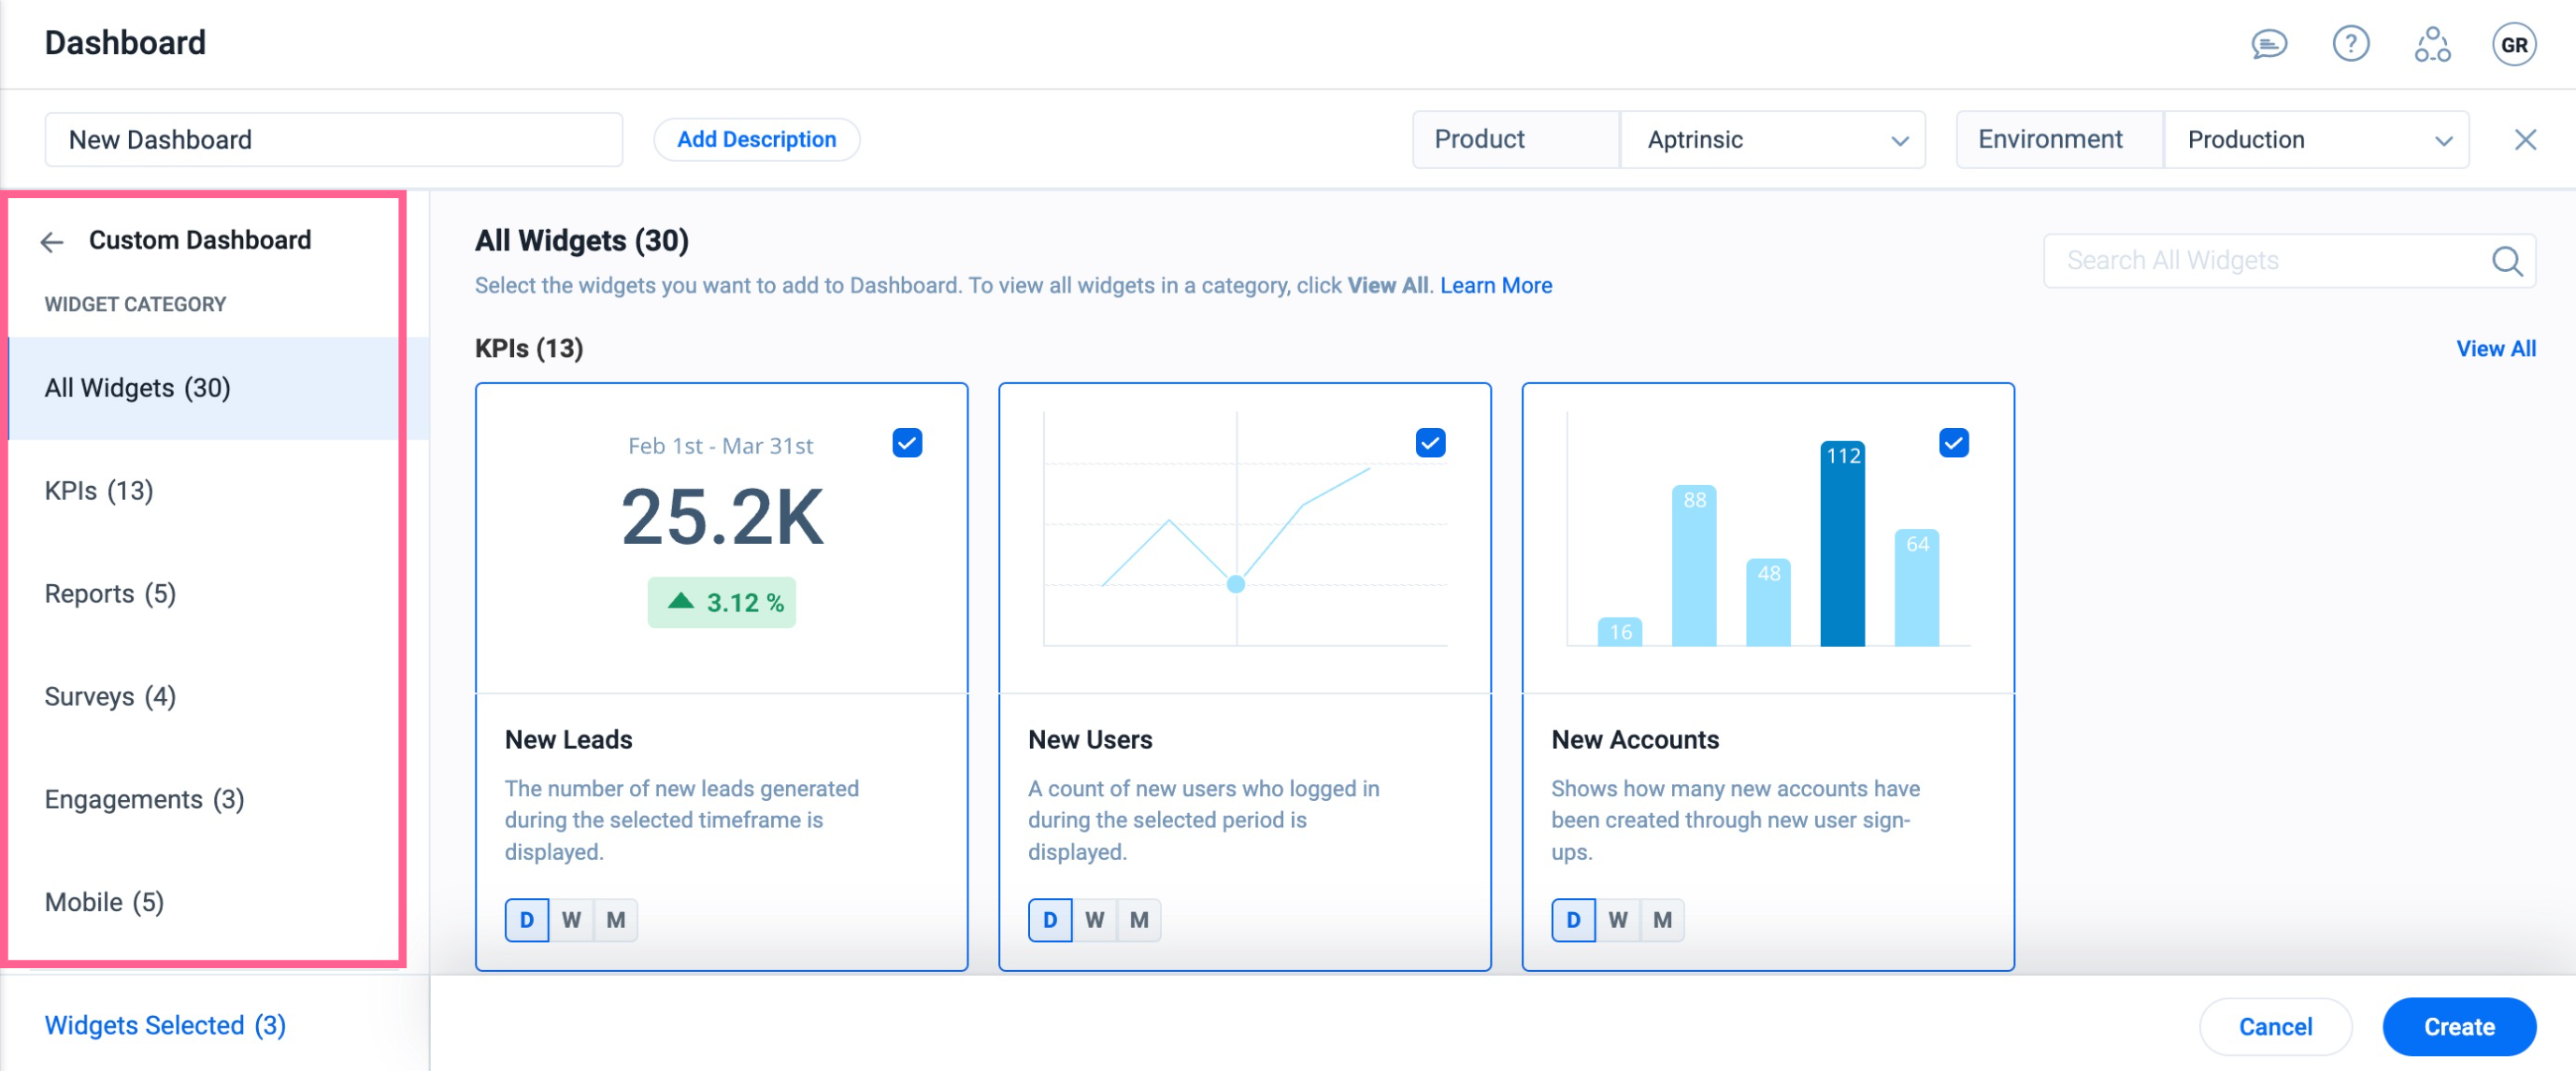
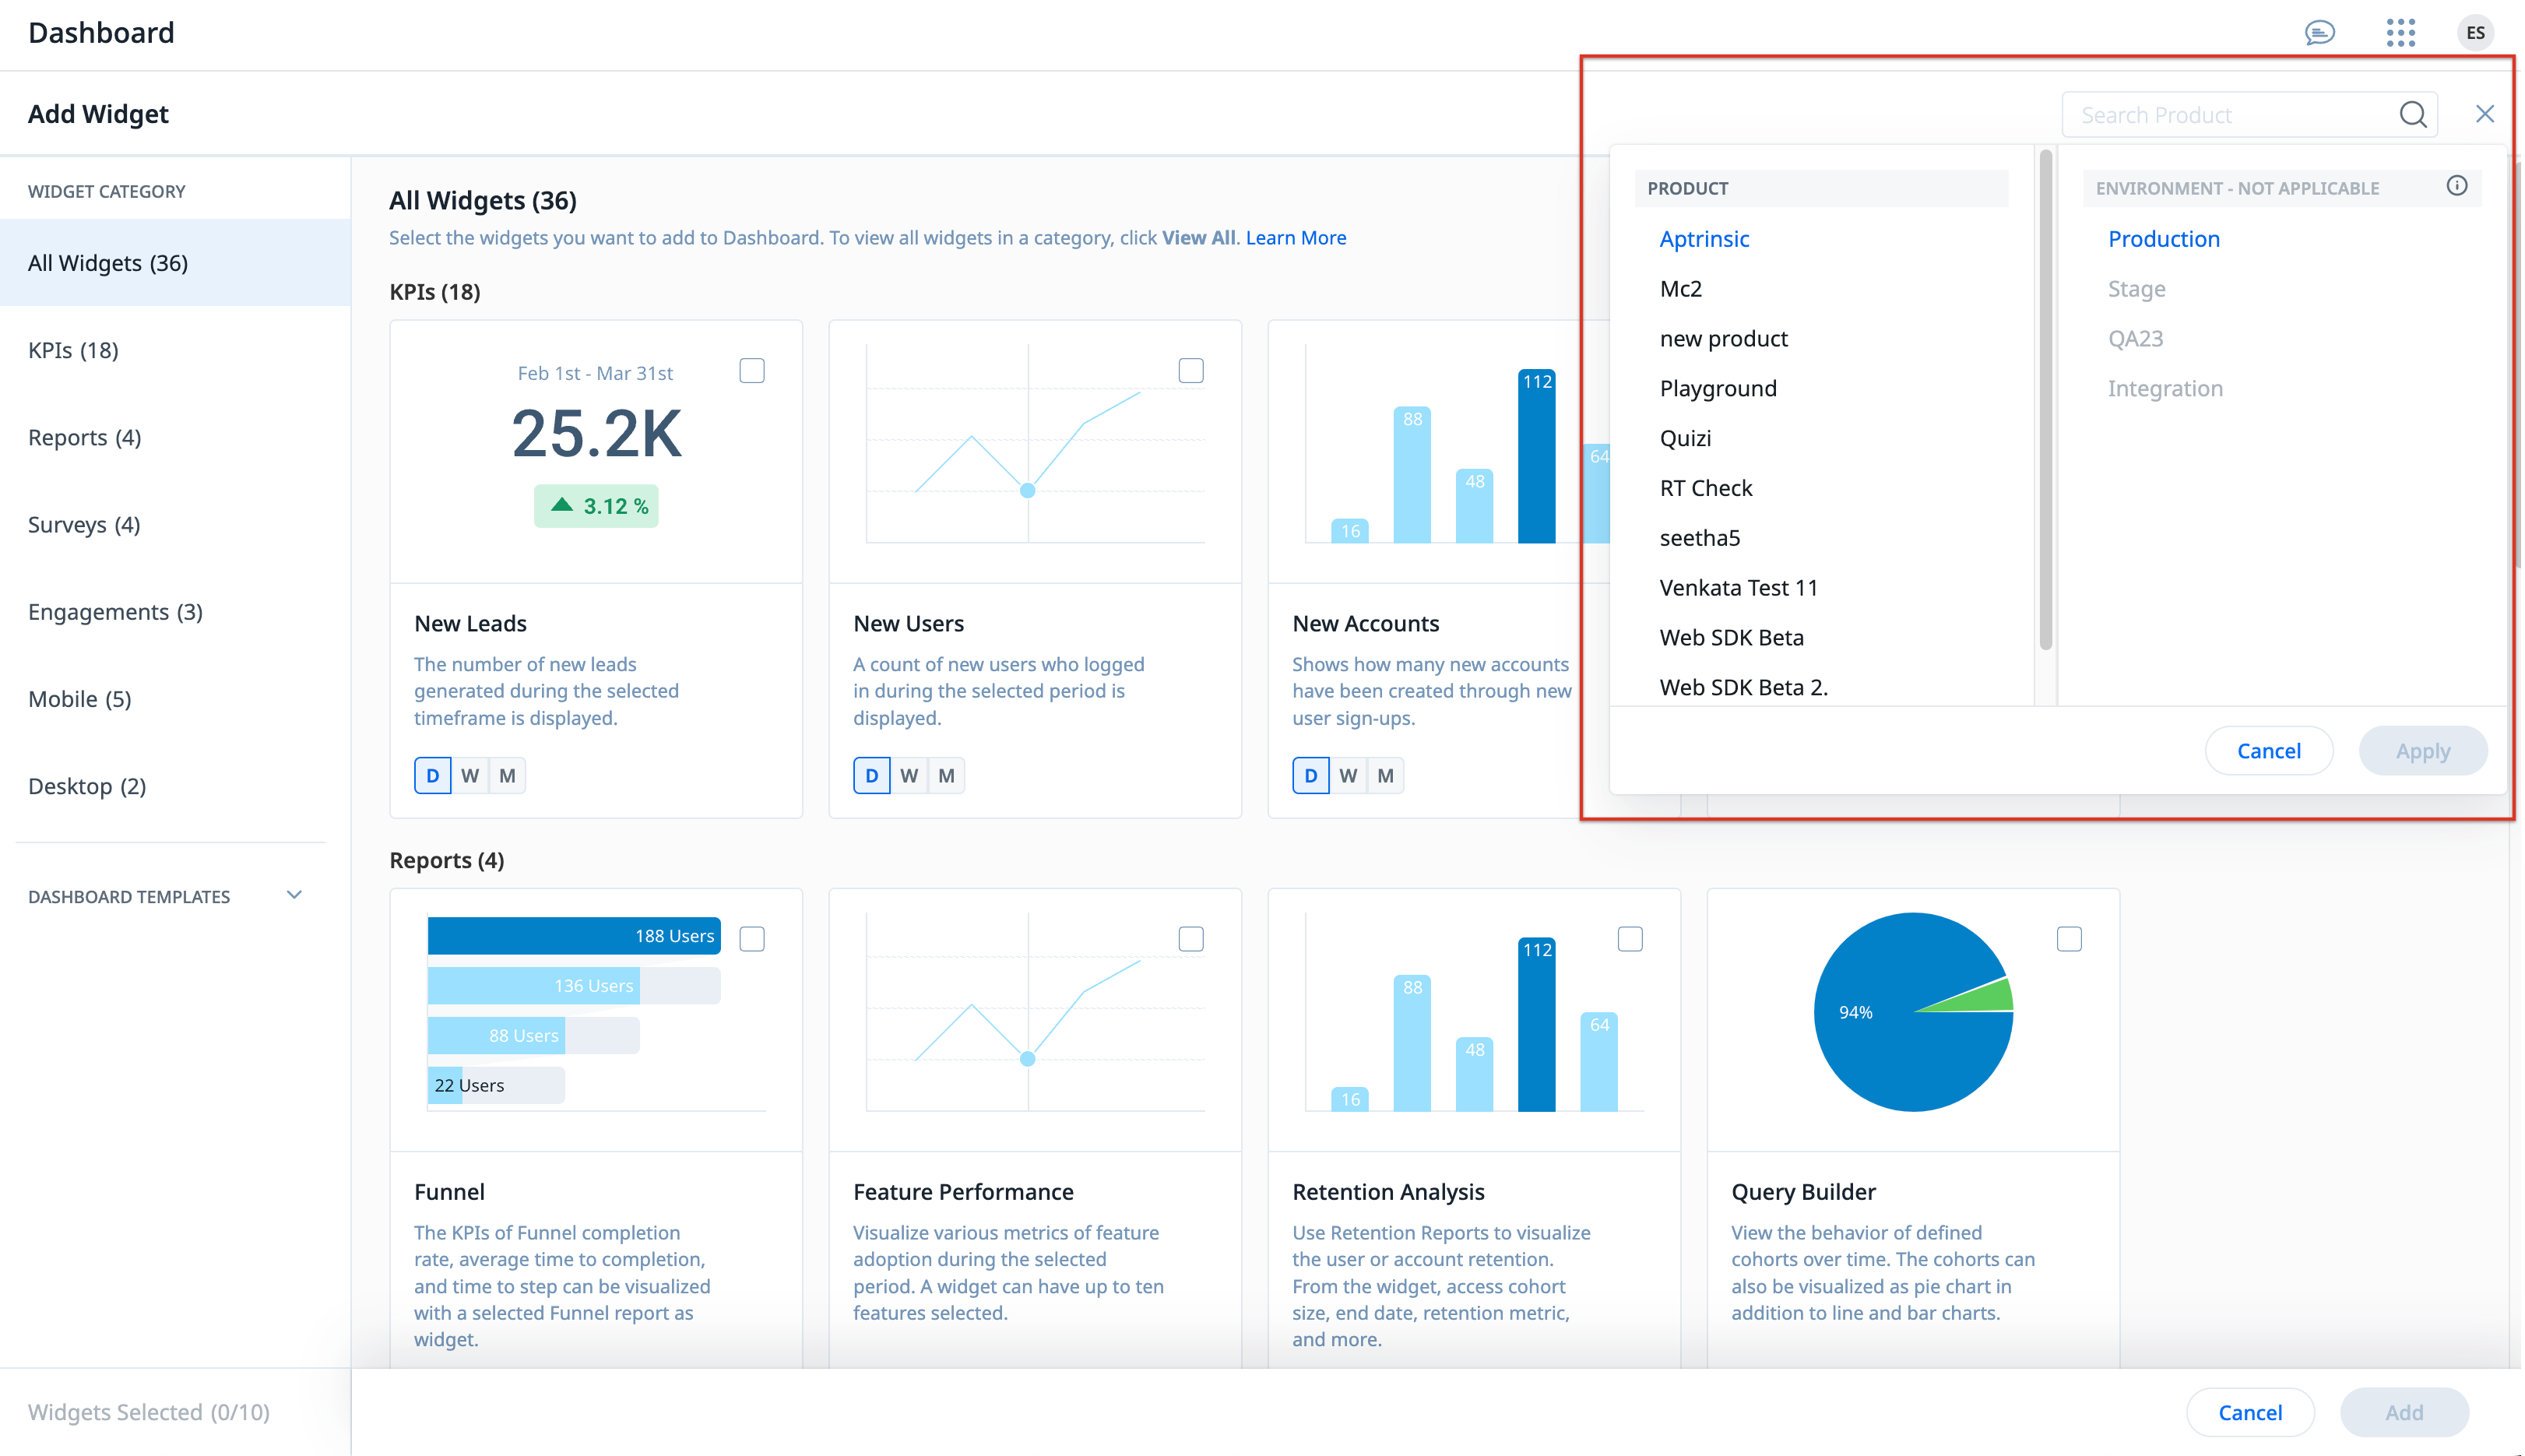
- In the Dashboard window, click Custom Dashboard.
- From the WIDGETS CATEGORY section, select the desired widgets to add them to your dashboard. For more information on widgets, refer to Widget Categories section in Widgets in Gainsight PX article.
 Notes:
- You can search for specific widgets or use the View All option to view all the widgets available in the category.
- You can add widgets from multiple categories.
- For each widget, hover over the widget and select the visualization type from the available options.
- Select the time granularity in Days, Weeks, or Months to display the data.
- (Optional) From the bottom-left corner of the screen, click Widgets Selected to preview the selected widgets from different widget categories.
- Click Create. The new private dashboard is created. To change the access permissions, refer to Set Access Permissions on Dashboard section.
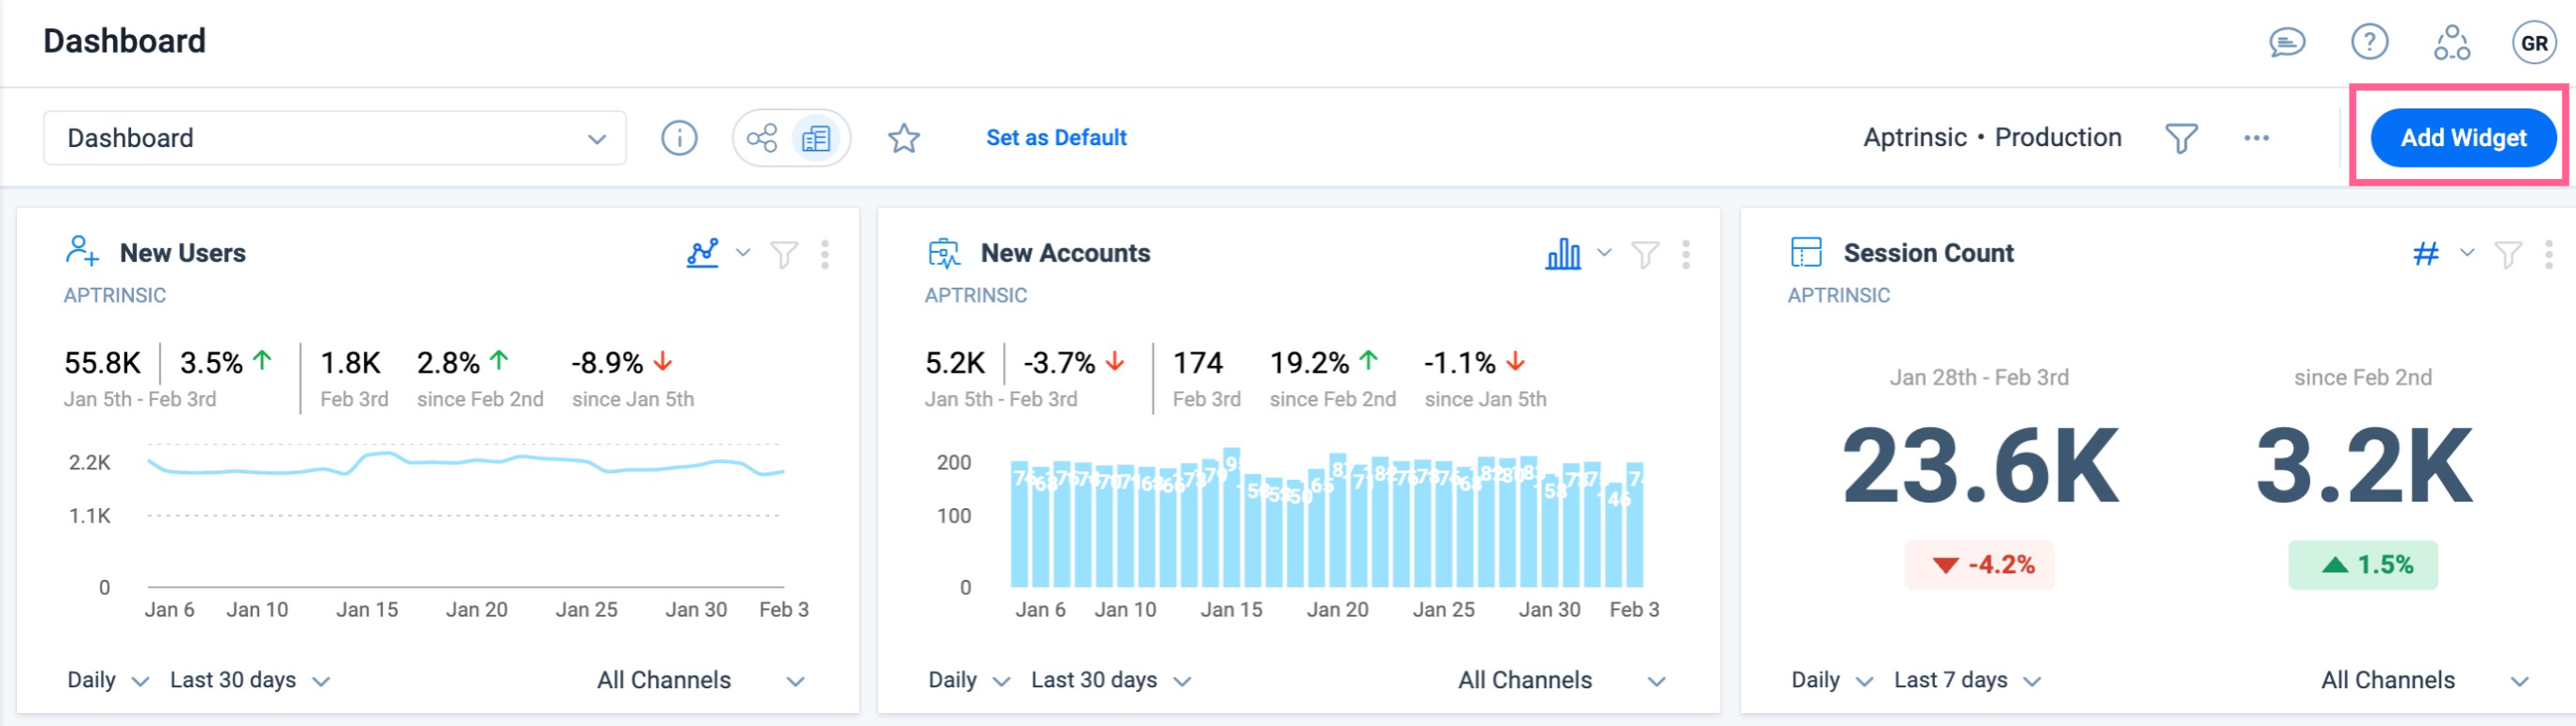
Mark Dashboard as Default
Click Set as Default to make a dashboard your default dashboard. Once a dashboard is set as default, you can view this dashboard every time you login to Gainsight PX or navigate to Dashboard.
_2.jpg?revision=1)
If there is no dashboard marked as default, the dashboard to be displayed is selected in the following precedence:
- If there is no default dashboard, last viewed favorite dashboard is displayed if it exists.
- If there is no default dashboard and a favorite dashboard, the dashboard last viewed by you is displayed.
- If none of the options mentioned above are available, the dashboard last viewed in the subscription is displayed.
Note: It is recommended to set a dashboard that you often use as your default dashboard.
Mark Dashboard as Favorite
Click the star icon to mark the dashboard as favorite. You can mark the existing and frequently used dashboards or a newly created dashboard as favorite. This helps you to navigate to the marked dashboards from the drop-down menu easily.
Widgets
A widget is a pre-configured report on a specific metric. Gainsight PX offers 21 widgets out of the box which may be added to Dashboards. Apart from the 21 widgets, Gainsight PX also offers five mobile widgets. You can use the mobile widgets in your Dashboard but data would be populated only after you configure Gainsight PX SDK.
Add Widgets to Dashboard
To add specific widgets to existing dashboard:
- Click Add Widget. The WIDGET CATEGORY window is displayed.
- Click on the required widgets. The selected widgets are added to the dashboard.
- (Optional) Repeat the above steps to add more widgets.
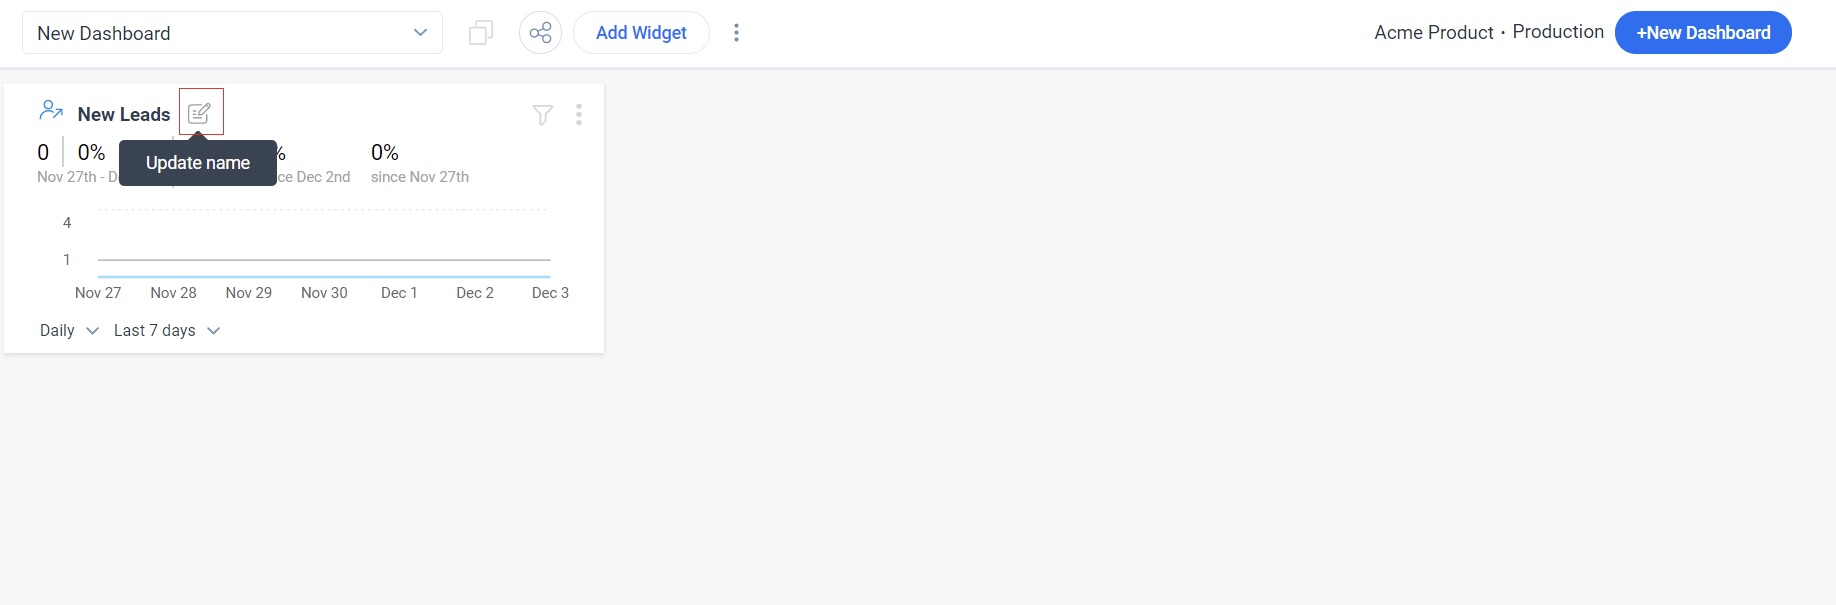
- (Optional) To modify the name of the widget, click update name icon, enter new name, and press the enter key.
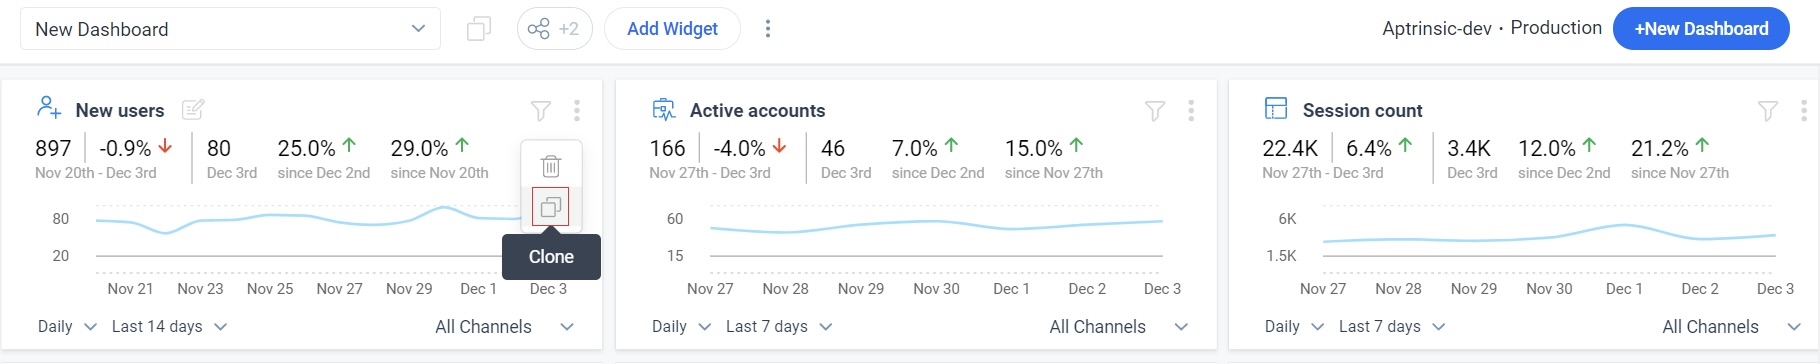
- (Optional) Click the actions button and then click the clone icon, to clone the widget.
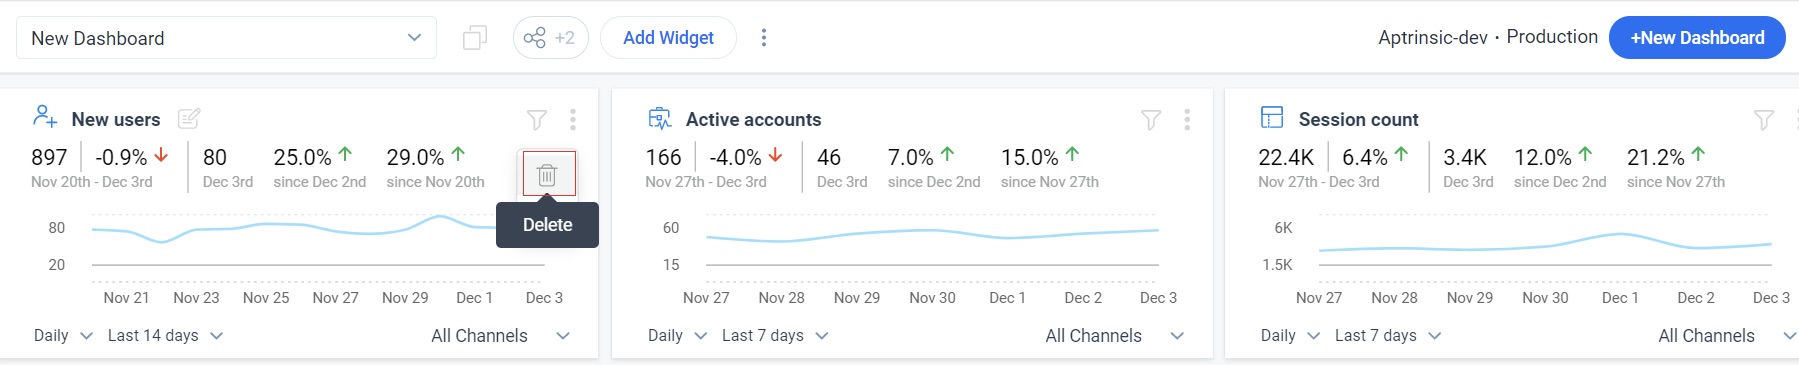
- (Optional) Click the actions button and then click the delete icon, to delete the widget.
Create Multi-Product Widgets
You can create Custom Dashboards and add audience widgets related to various products of your subscription into the same dashboard. You can choose a specific product while adding a widget to the dashboard. A custom dashboard with multi-product widgets helps in analyzing the performance of different products side by side.
Example Business Use Case:
Consider that you want to compare the number of active users in each of your product. You can create a custom Dashboard and configure multiple Active Users widgets powered by different products. This provides a comprehensive view of the data in one place.
To create a multi-product dashboard:
- Select a custom dashboard to which you want the widgets.
- Click Add Widget. The Select Widget window appears.
- Select the product from the dropdown options and click the required widget. The selected widget is added to the custom dashboard.
Compare Widget Data
The PX Dashboard's Comparison widget enables you to compare two widgets and analyze data changes. It offers a versatile and intuitive interface for comparing different scenarios of a single widget.

For more information, refer to the Configure Comparison Widget article.
View Widget Data
View the underlying user or account data for selected dashboard widgets directly from the dashboard. This allows you to analyze the records contributing to a widget's insights without exporting data or creating additional reports. You can view the underlying data for the following widgets:
- New Accounts
- Active Accounts
- New Users
- Active Users

In the detailed view, you can perform the following actions:
- Search for specific users using user identifier, email, first name, or last name, or accounts using account name or account ID.
- Apply additional filters to refine the displayed data.
- Export the filtered data as a CSV file.
- Create account or user CSV segments from the displayed data.
- Navigate to user profile activity by clicking the profile icon (first column of user-level records or the Account drill-drown screen of a particular account by clicking anywhere on a row from account-level records.
The detailed view honors all applied dashboard filters and time-range selections. Any filter changes performed in the view data screen does not automatically apply to the widget.

Export Widget Data
Widgets of a dashboard can be exported to PDF, PNG, or CSV to share insights, track trends, and communicate outcomes more effectively across your organization. Exported files contain information on all filters applied to the widgets.
To export a widget:
- Click the Actions icon from the top of the required widget.
- Select the Export as option. The following options are available:
- PNG
- CSV (only available for New Accounts, Active Accounts, New Users, and Active Users widgets)
- Preview the widget and all relevant details before exporting, to ensure accuracy and completeness.
- Click Export.
Note
- The CSV export option is only available for New Accounts, Active Accounts, New Users, and Active Users widgets.
- While PNG and CSV exports download directly, PDF exports open the print dialog of your browser. Ensure the Save as PDF option is selected in the Destination field before clicking Save.
- Larger CSV files are automatically delivered through email.
- Widget sizes in the export are standardized and may not reflect the original layout. For example, 1x1 Query Builder or Feature Performance widgets are rendered at full width. Review the export preview to ensure the layout meets your expectations before exporting.

Create Segments From Widgets
To eliminate the need to manually download and reupload CSV files, Dashboards lets you quickly generate user or account segments based on the data displayed in your widgets. You can create segments directly from the following widgets:
- New Accounts
- Active Accounts
- New Users
- Active Users

A new segment is created using the current widget data and any filters applied. You can view the newly created segment on the Segments page.
Note
- Both widget-level and dashboard-level filters are applied when creating a segment.
- The created segment appears with a status of In Progress until processing is complete.
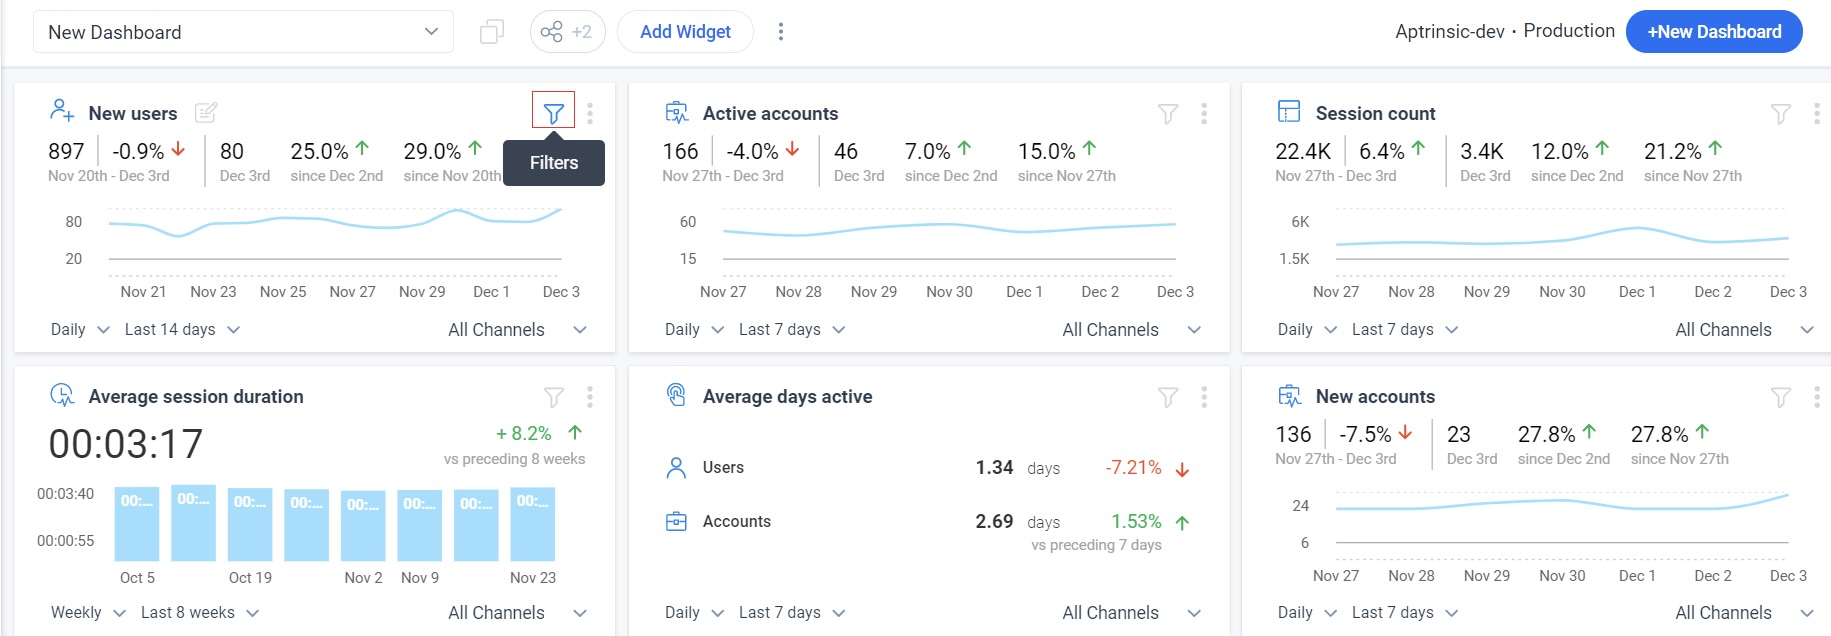
Set Filter Criteria for the Widgets
You can apply Global Filters at the Dashboard level. You can also customize the widgets by applying appropriate filters at the widget level.
Note: Each widget displays data for the selected Date range based on the applied Filters.
Create Global Filter at Dashboard Level
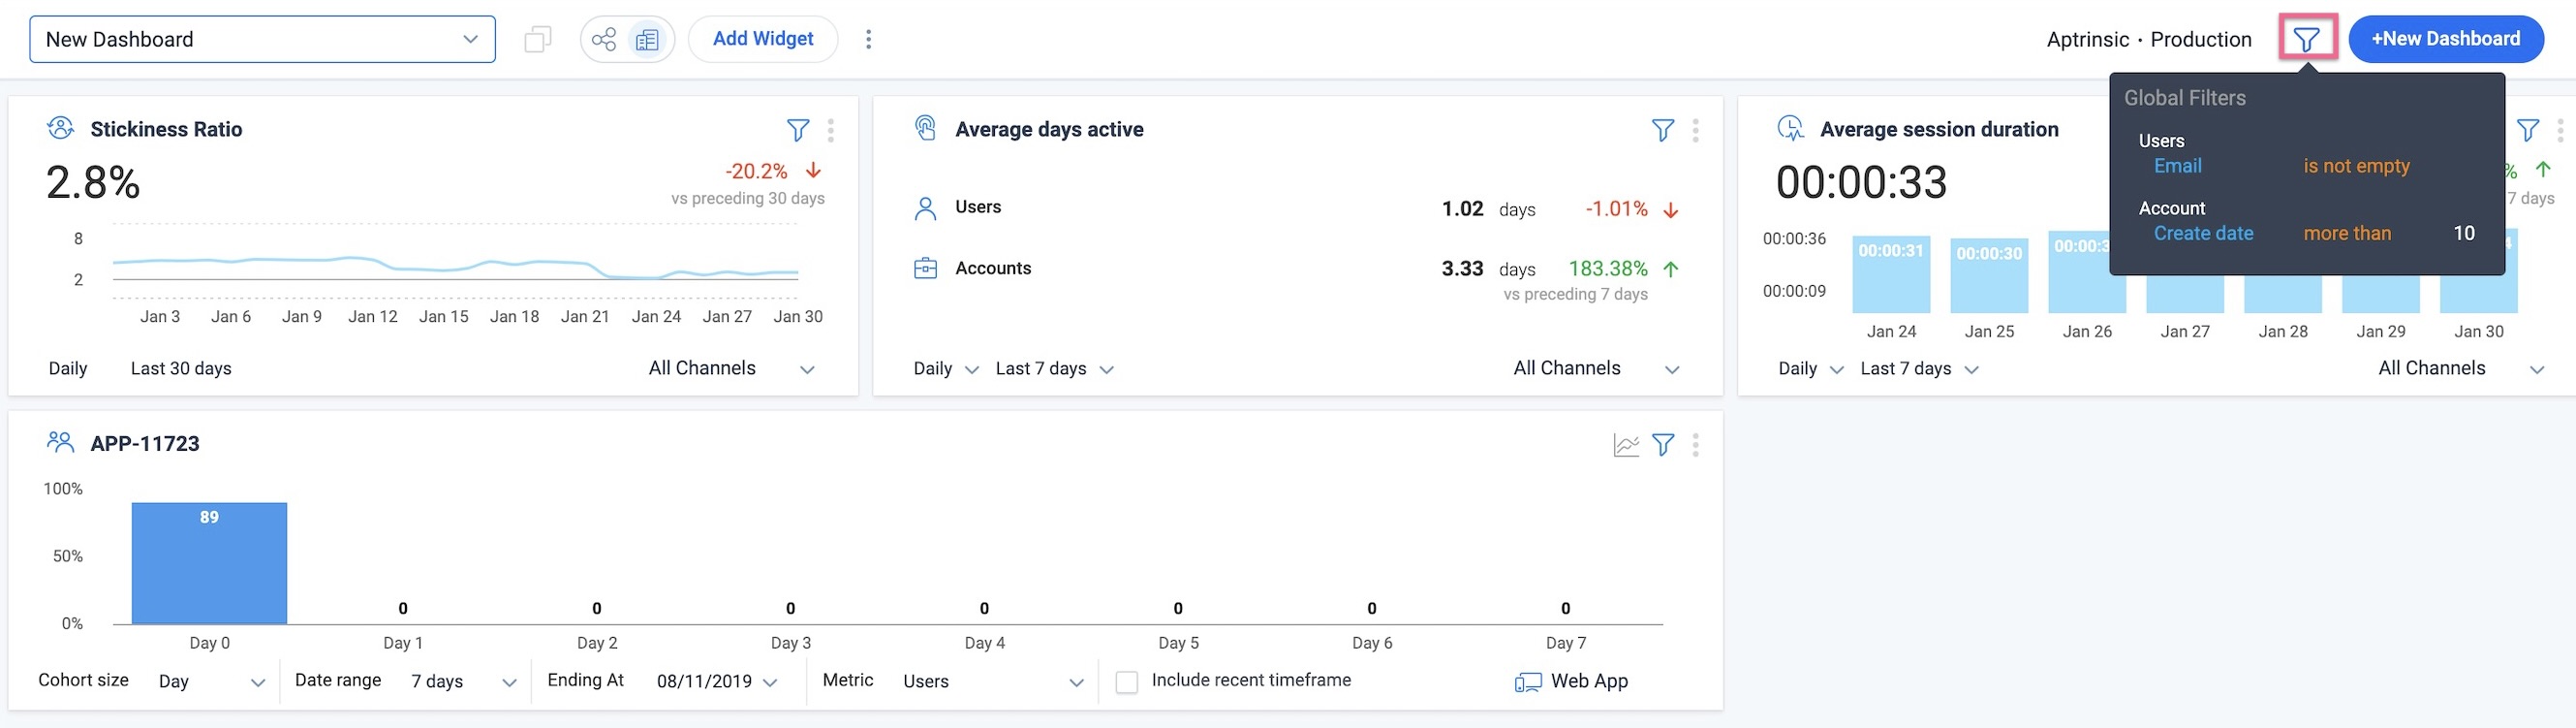
You can apply Global Filter for your custom dashboard. This helps you to apply the same filter to all the widgets in the custom dashboard at once. Following are the filters that can be applied as Global Filters:
- User
- Account
- Inferred Company
- Inferred Location
- Location
- Account Location
Notes:
- Hover on the Global Filter icon to view the details of the applied filters.
- Global filters or widget level filters cannot be applied to Funnel widgets in dashboards.
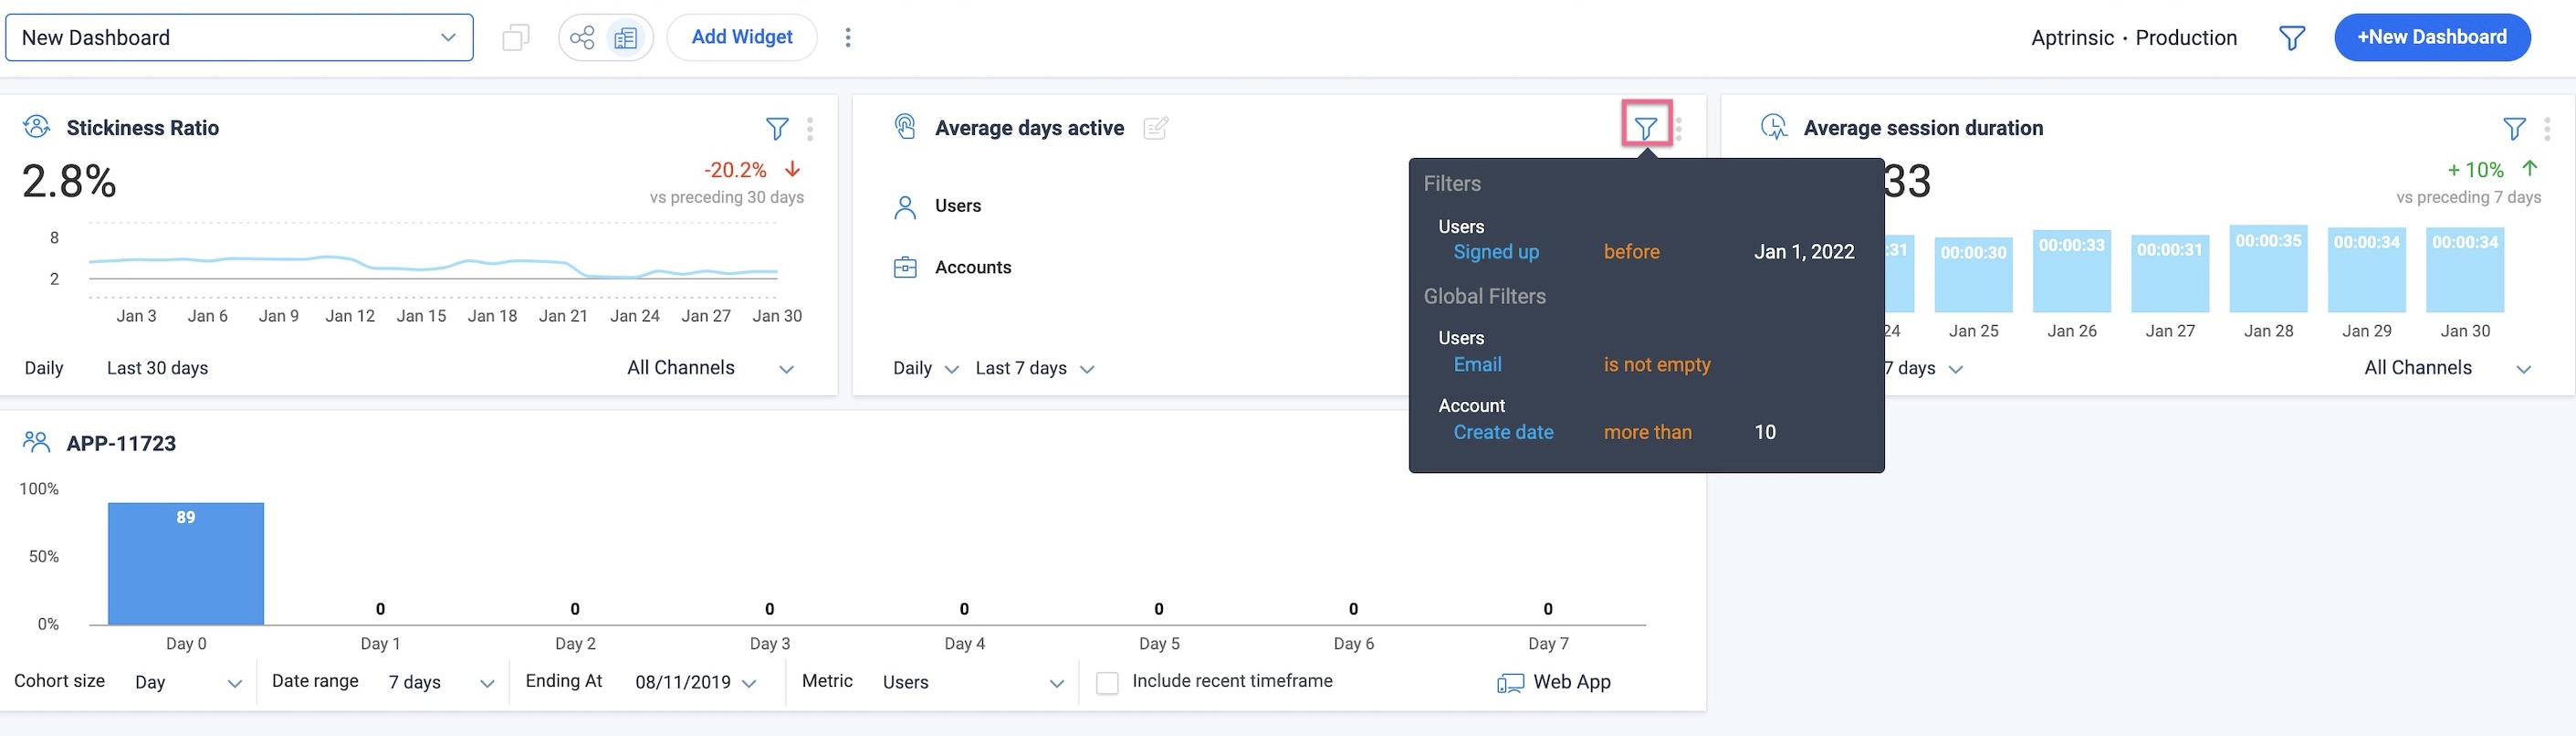
- Global and widget level filters when applied together use AND logic between the two sets of filters.
Create Customized Filters at Widget Level
Along with Global Filters, you can also apply widget-level filters as required.
To add the required filter criteria:
-
Click the filters icon.
Note: You can modify the widget name from the Filters page as well.
- In the Date range drop-down menu, select the number of days or a range of dates for which you wish to display data in the widget and click Apply.
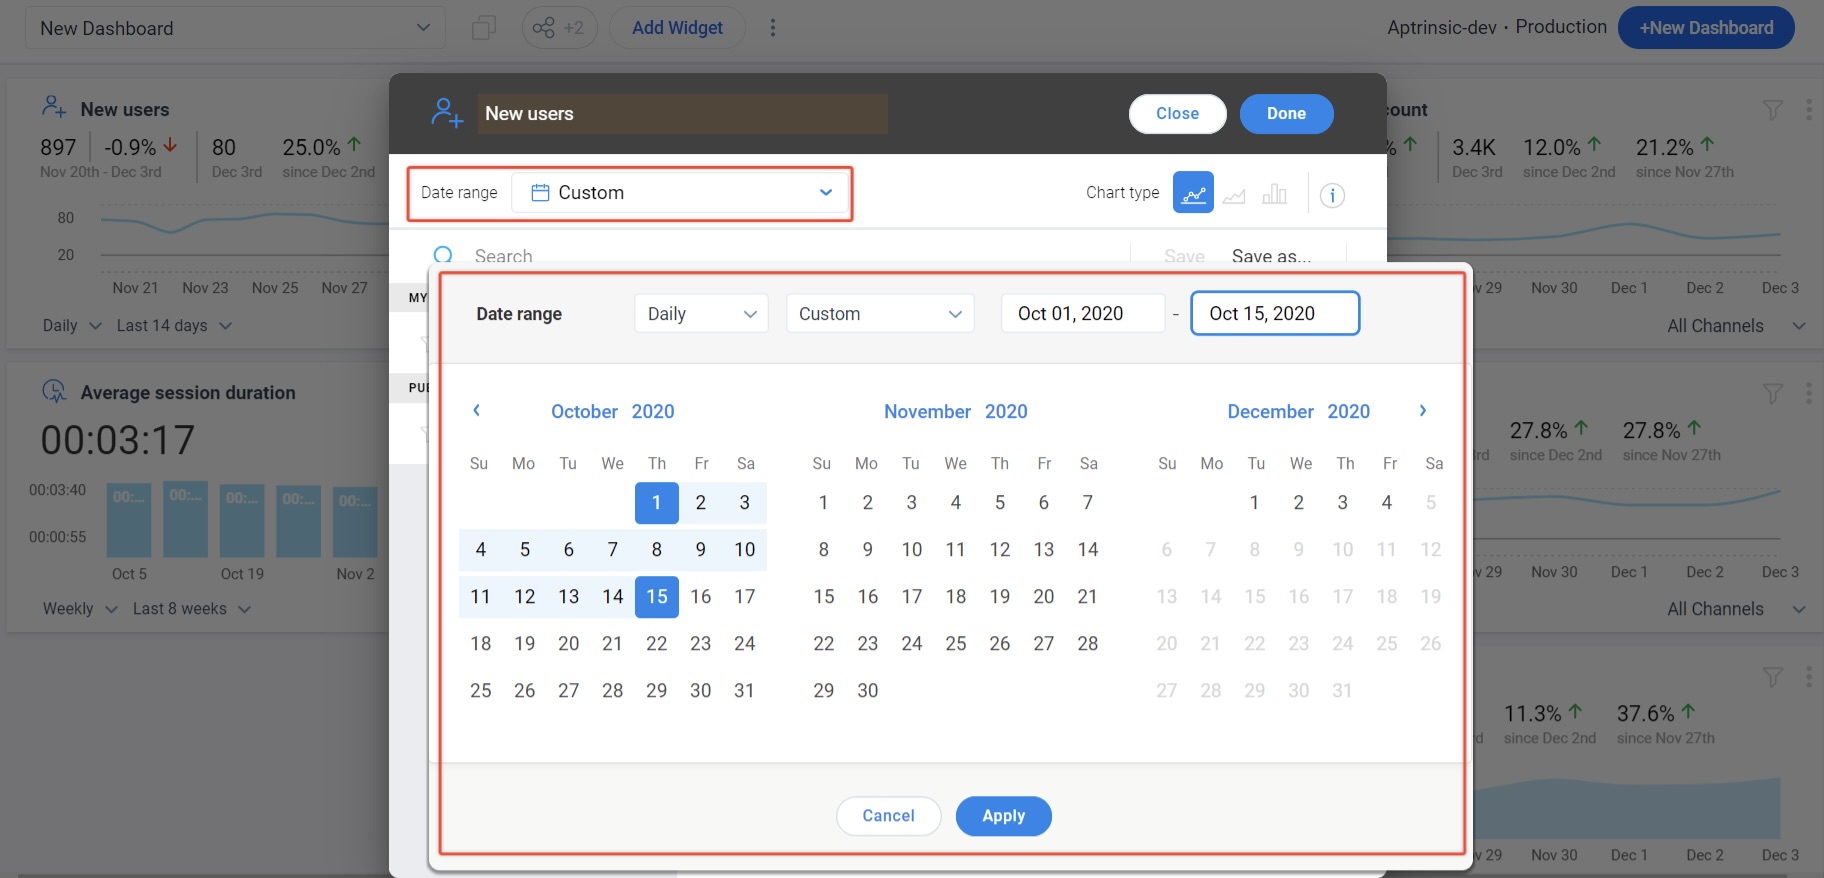
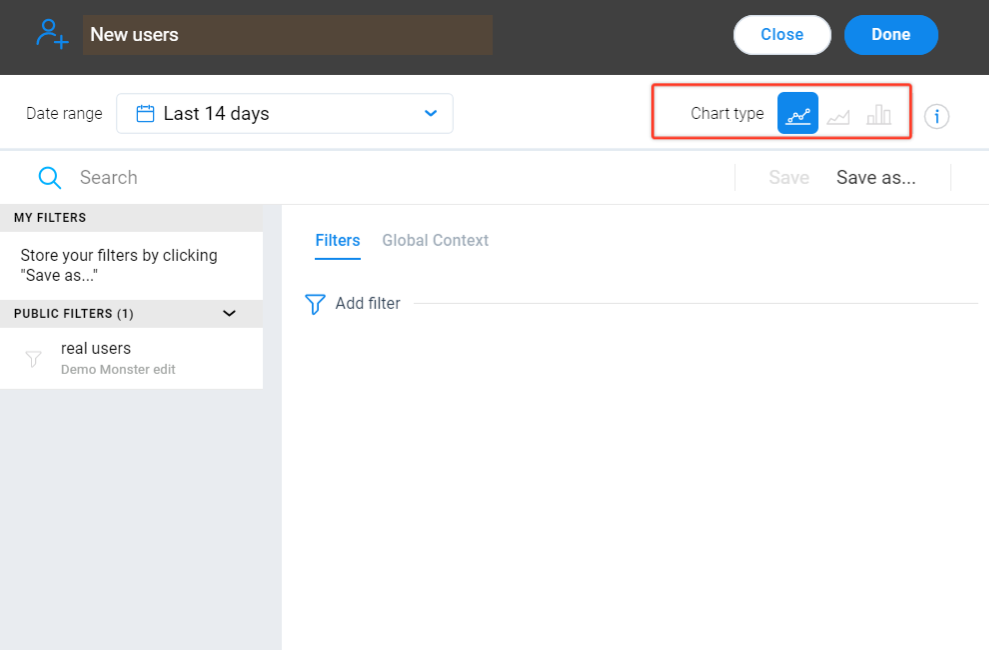
- In the Chart type field, select the type of visual data representation required in the widget.(Line chart/Area Chart/Bar Chart)
-
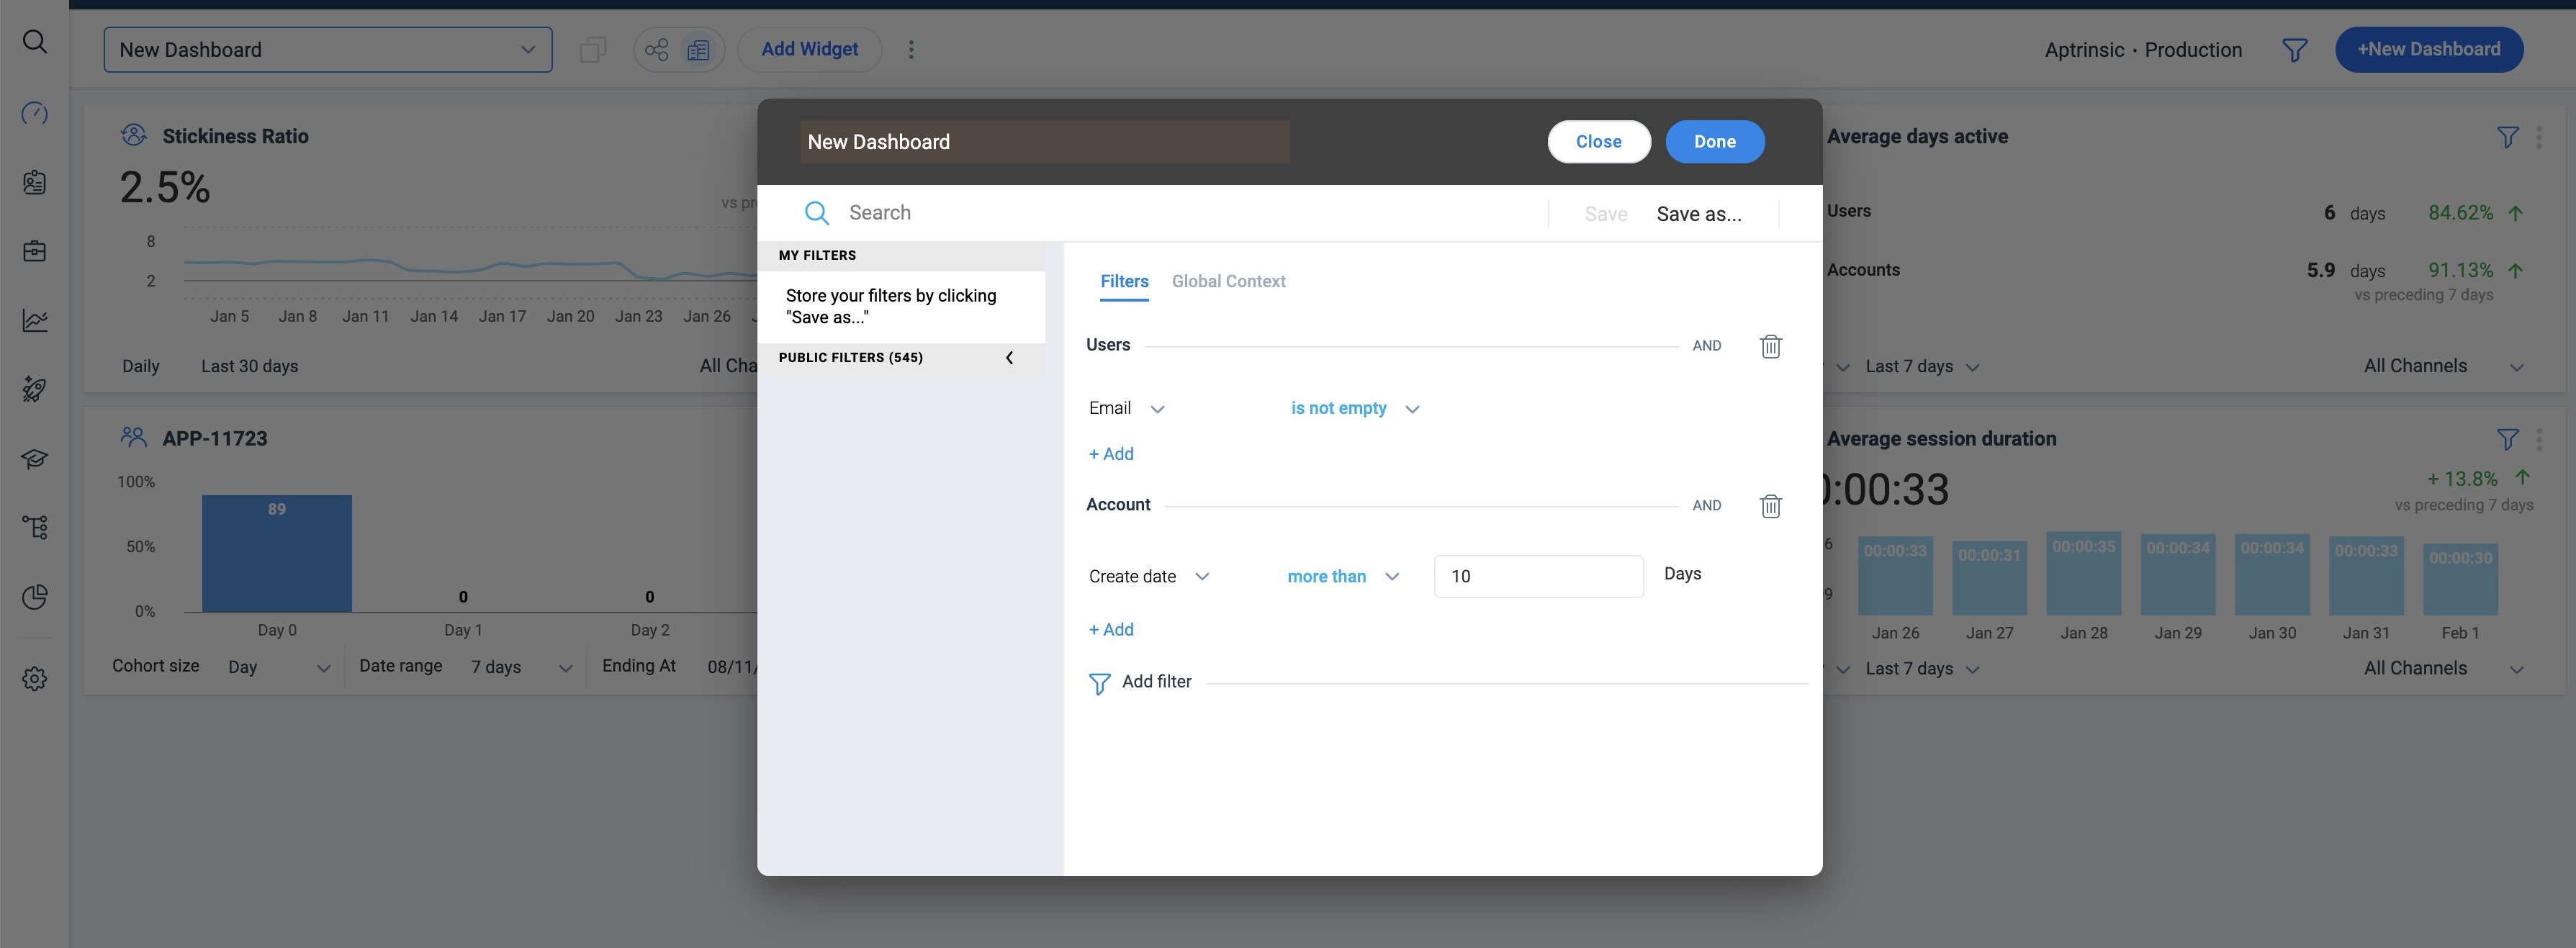
Click Add filter to add filters to the data displayed in the widget.
-
Configure a filter as required.
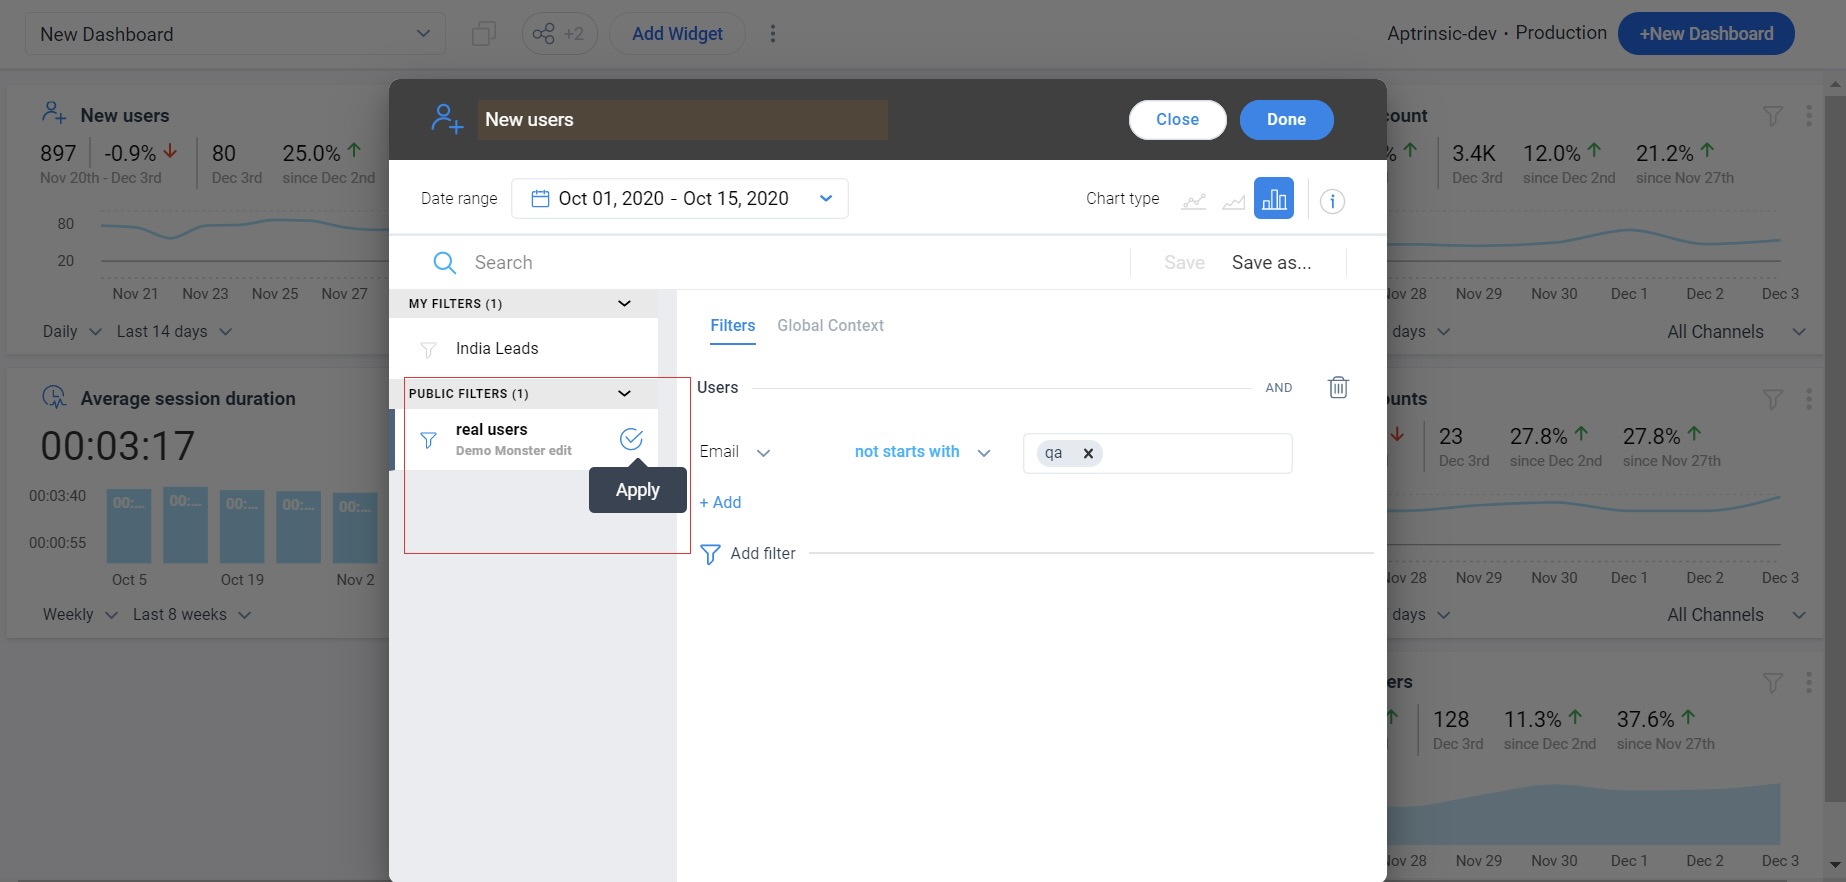
The below filter displays leads located in India and generated between Oct 1, 2020, to Oct 15, 2020.
When you apply multiple filters, by default the AND logic is applied. You can modify it to the OR logic.
-
(Optional) Click Save as and enter a name to save your filter.
When you save a filter, it appears by default in all widget filters under the MY FILTERS section. You can choose to apply the filter, rename it, or delete it.
- Click Done to save the widget.
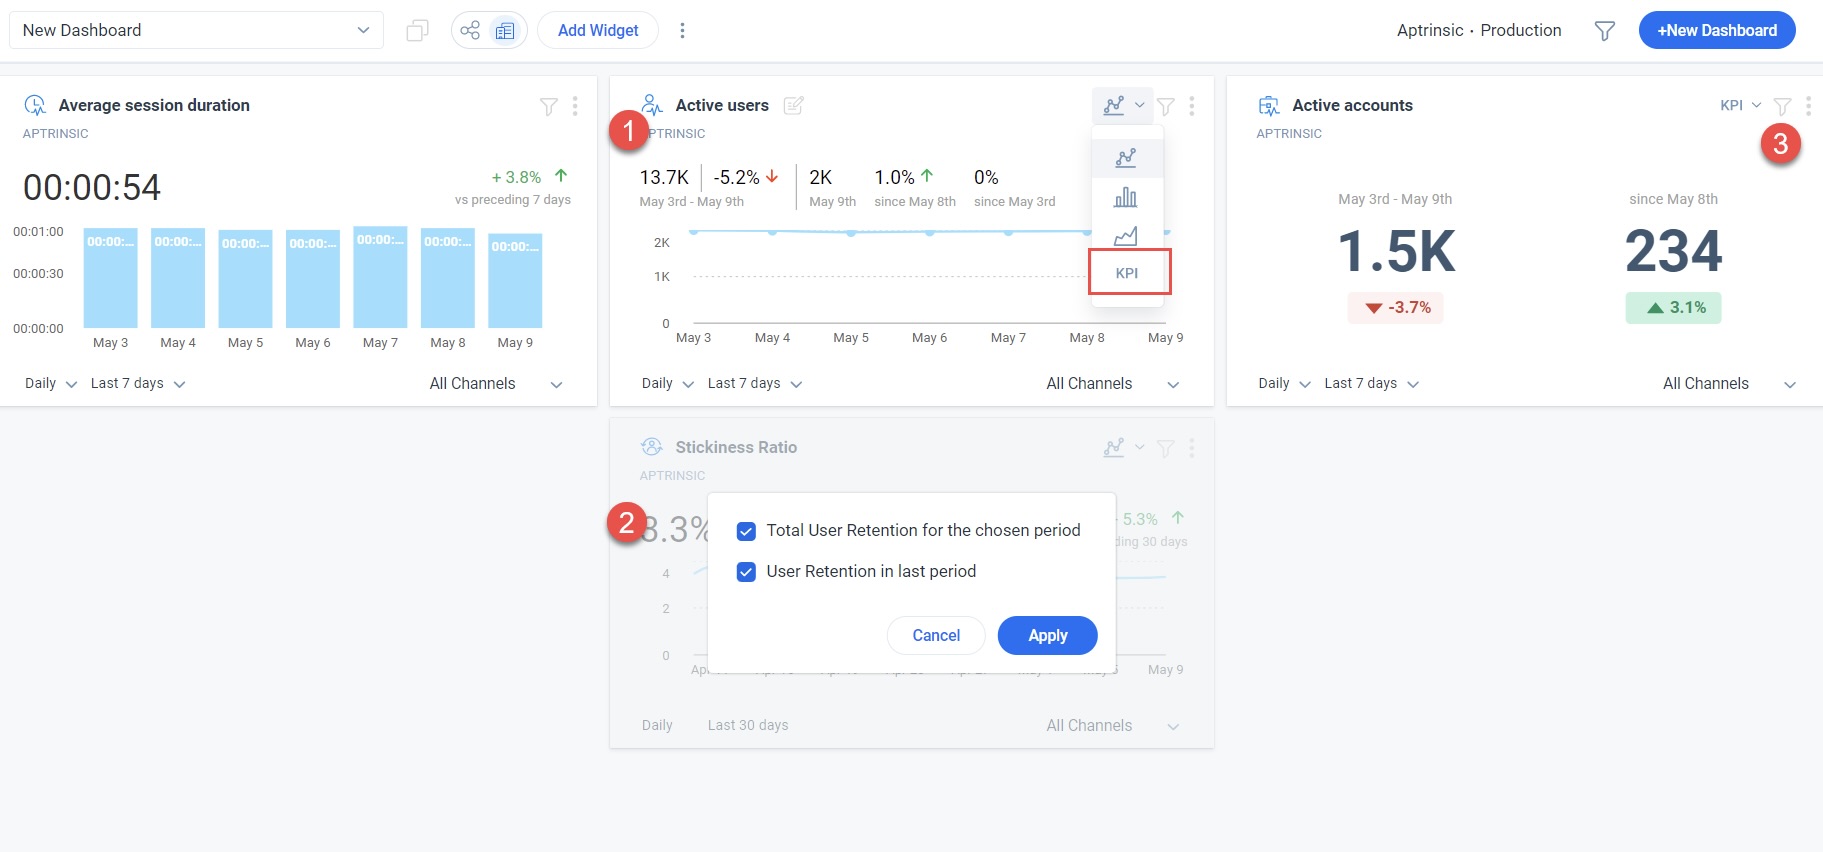
Set KPI Chart for Widgets
The widgets in the Custom Dashboards has a KPI chart option that helps you to choose the specific KPI values you want to track. The KPI values helps in easy visual tracking with larger fonts and clutter-free analysis of data from all additional information on the widget.
This capability is available in the following Audience widgets:
- New Users
- New Accounts
- New Leads
- Events Recorded
- Stickiness Ratio
- Active Users
- Active Accounts
To set the KPI chart view for widgets:
- Click the charts icon for the widget.
- Select the KPI option from the available chart options.
- Select the required data options.
- Click Apply. The data of the widget is displayed as a KPI chart.
Public Filters
The filters displayed under the PUBLIC FILTERS section appear in the widget configuration window of all the widgets.
Note: You cannot delete but modify these filters. Click the filter name to view the filters applied. Click the apply icon to apply the filter to your widget.
Channels
Apart from the dashboards created on your web application using the Web-App channel, Gainsight PX also allows users to create dashboards for your mobile application. Gainsight PX offers five Mobile widgets. Additionally, the Average Session duration and Session count widgets allow you to view data from both mobile and web applications.
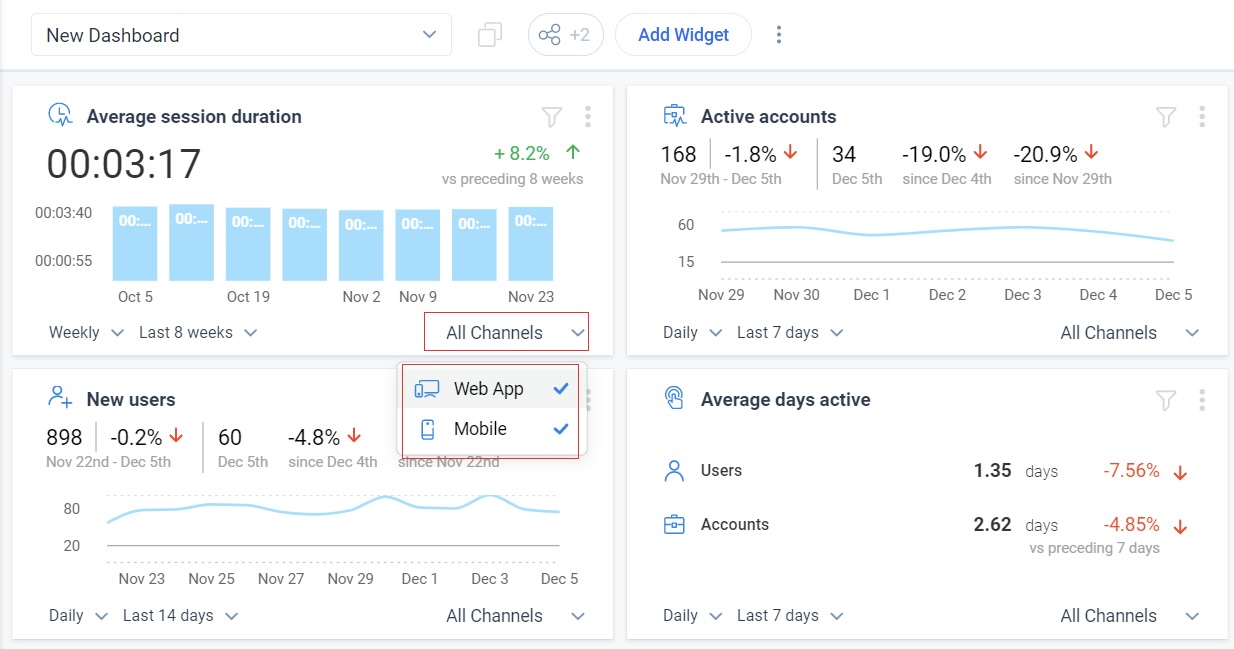
Note: Data is populated on the mobile widgets only after you configure Gainsight PX Android SDK on your mobile application. For more information on how to install Gainsight PX Android SDK, refer to the Install Gainsight PX SDK for Android article
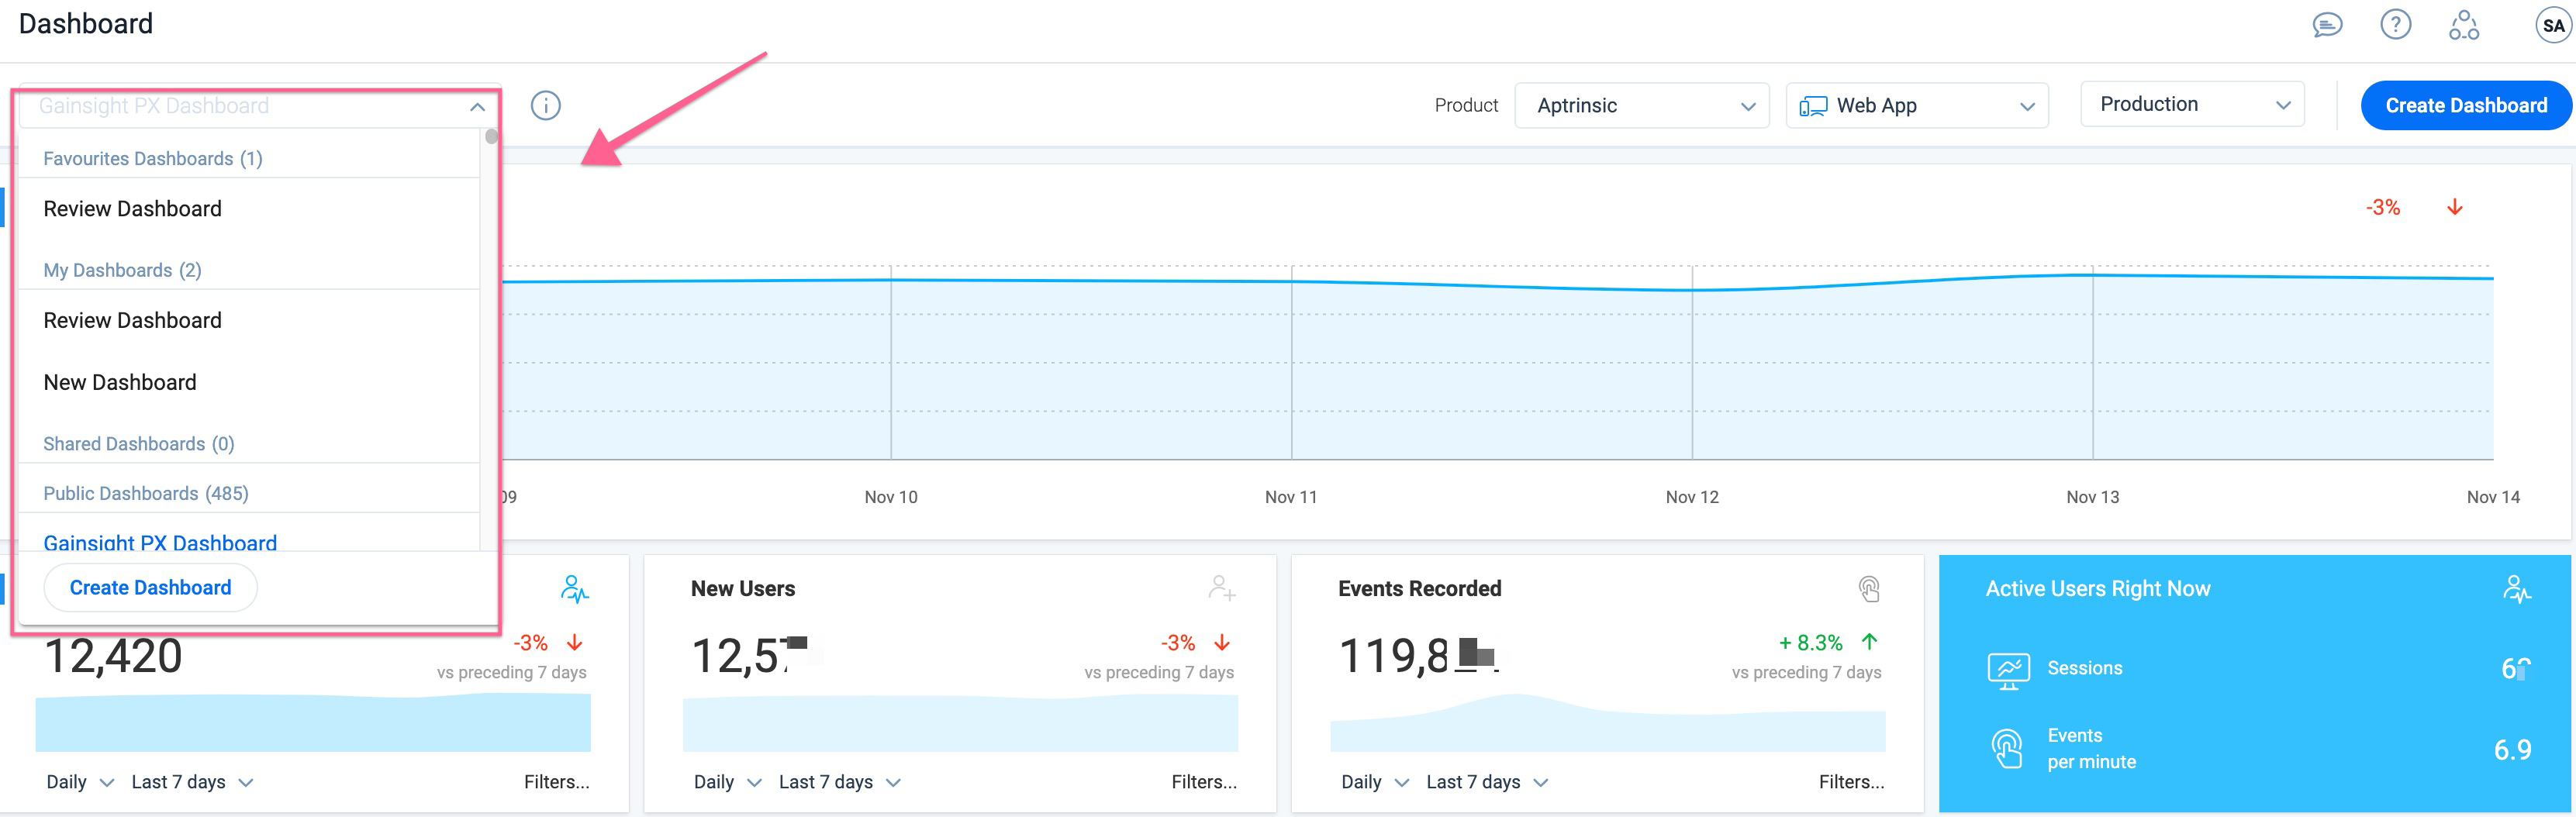
View Dashboard List
Expand the Create Dashboard drop-down menu to view all the listed dashboards. The menu is organized into the following categories for easy accessibility and smooth user experience.
- Favorite Dashboards: Dashboards marked favorite by the user.
- My Dashboards: Dashboards created by the user.
- Shared Dashboards: Dashboards shared with the user.
- Public Dashboards: Dashboards shared with everyone within the subscription.
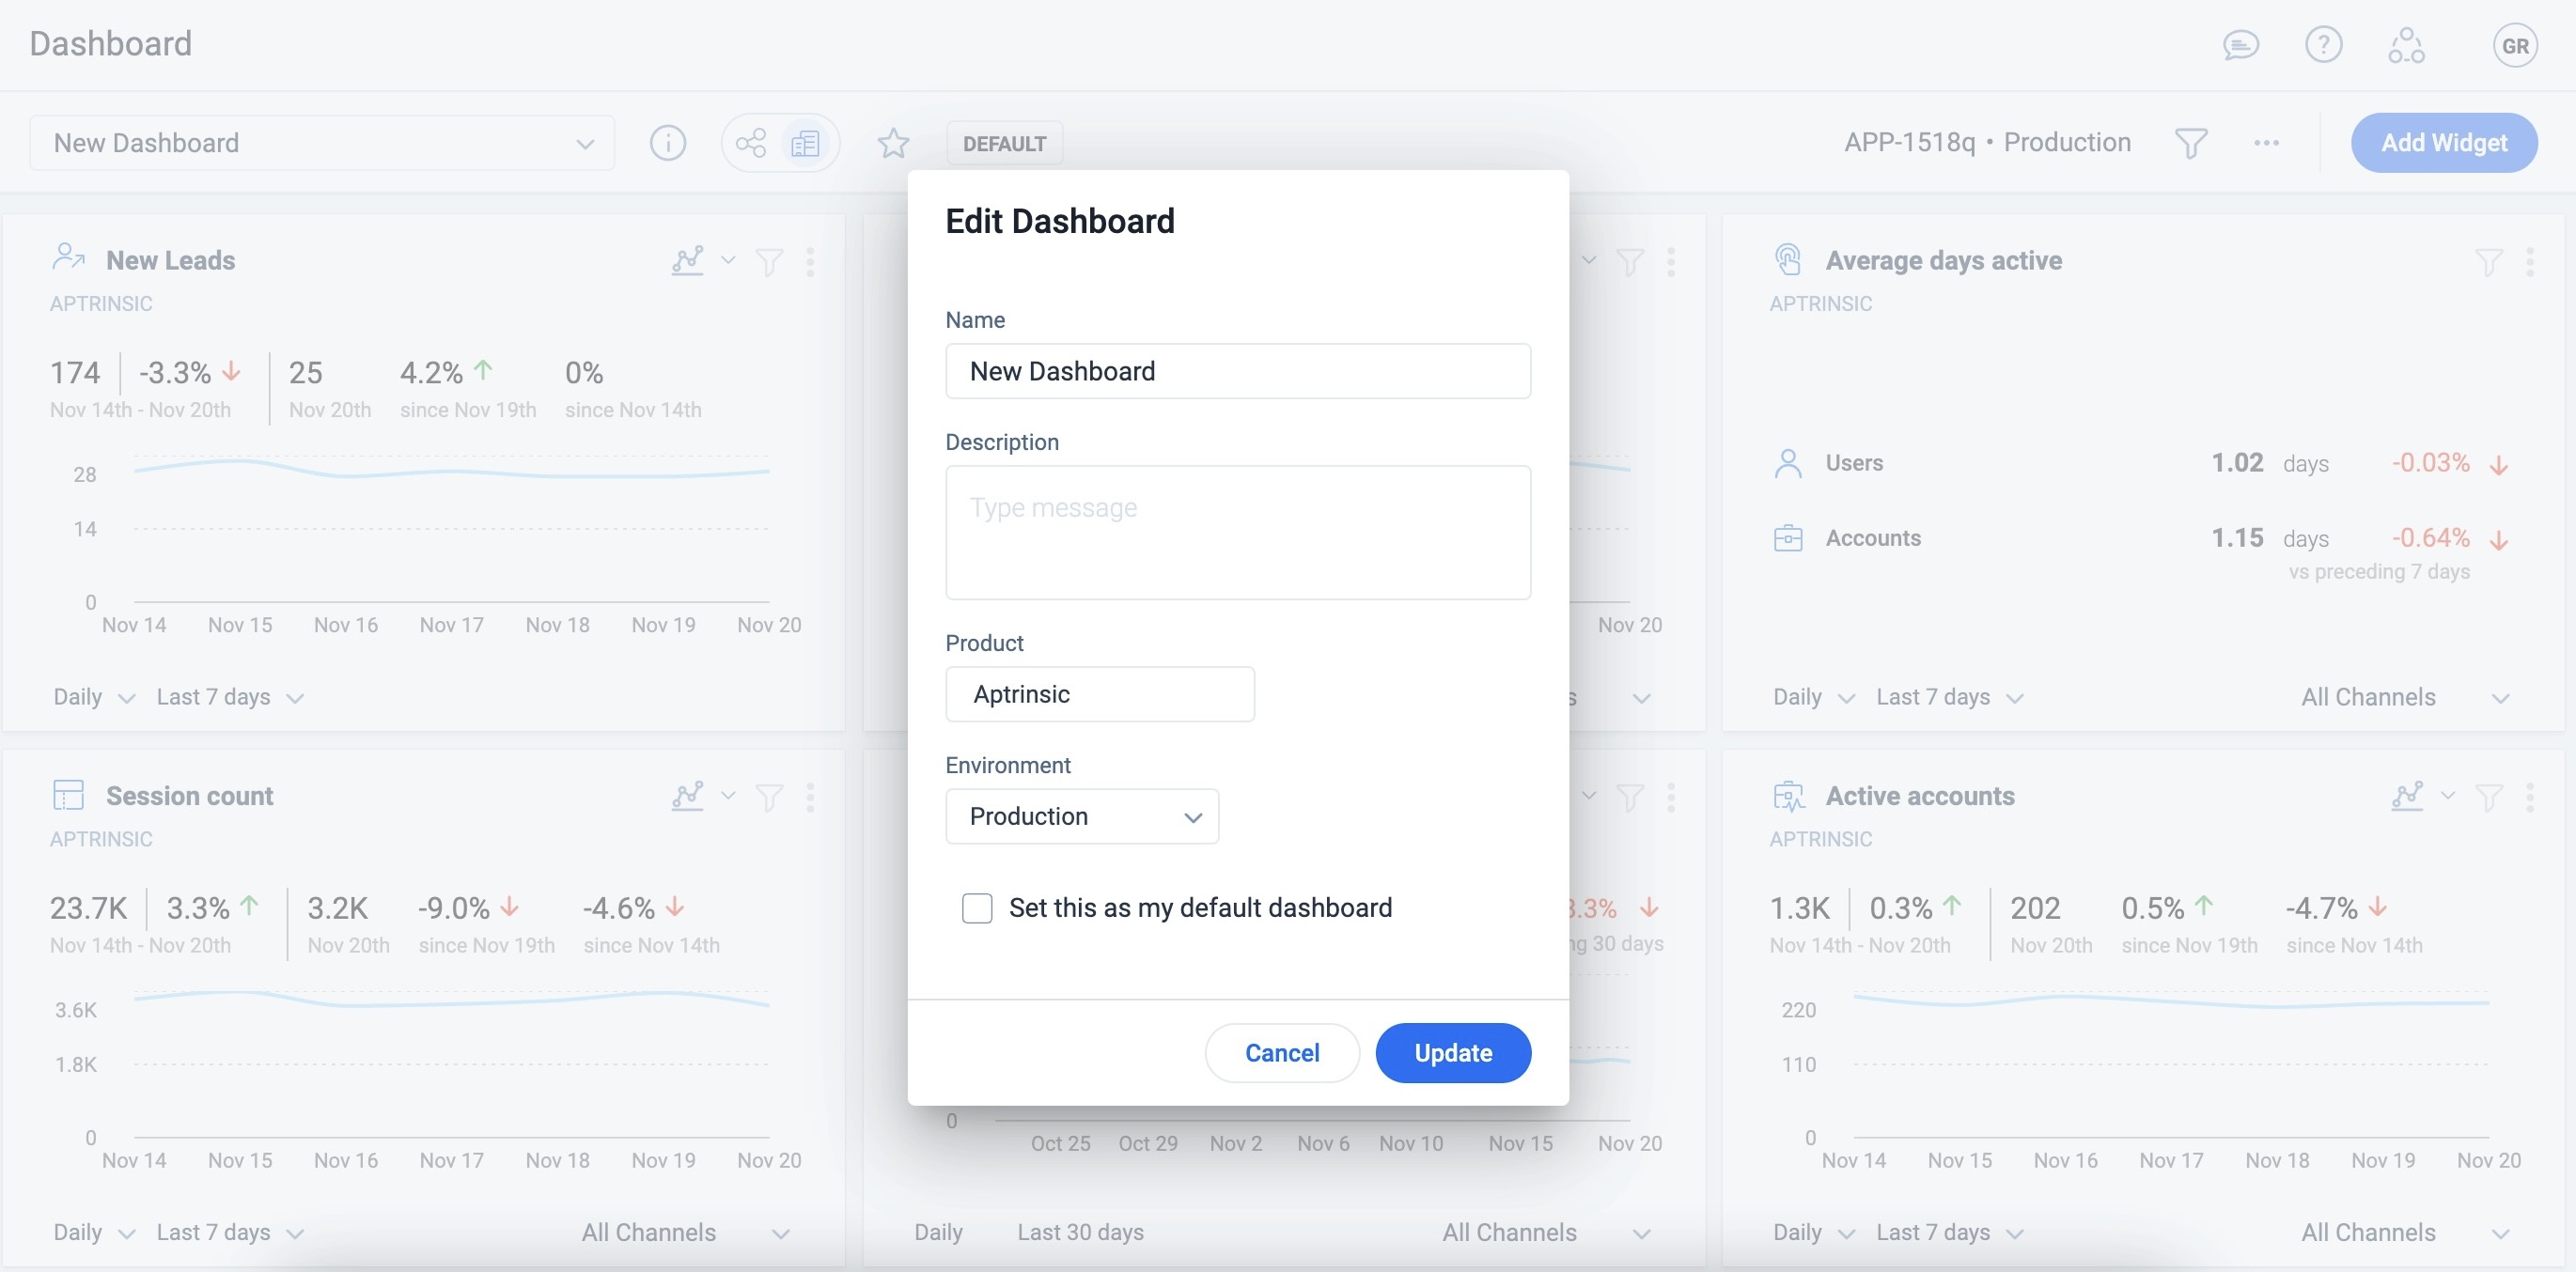
Edit Dashboard
This allows you to update configuration settings of any Dashboard.
To Edit Dashboard:
- Click on the actions menu and select Edit Dashboard. The Edit Dashboard window displays.
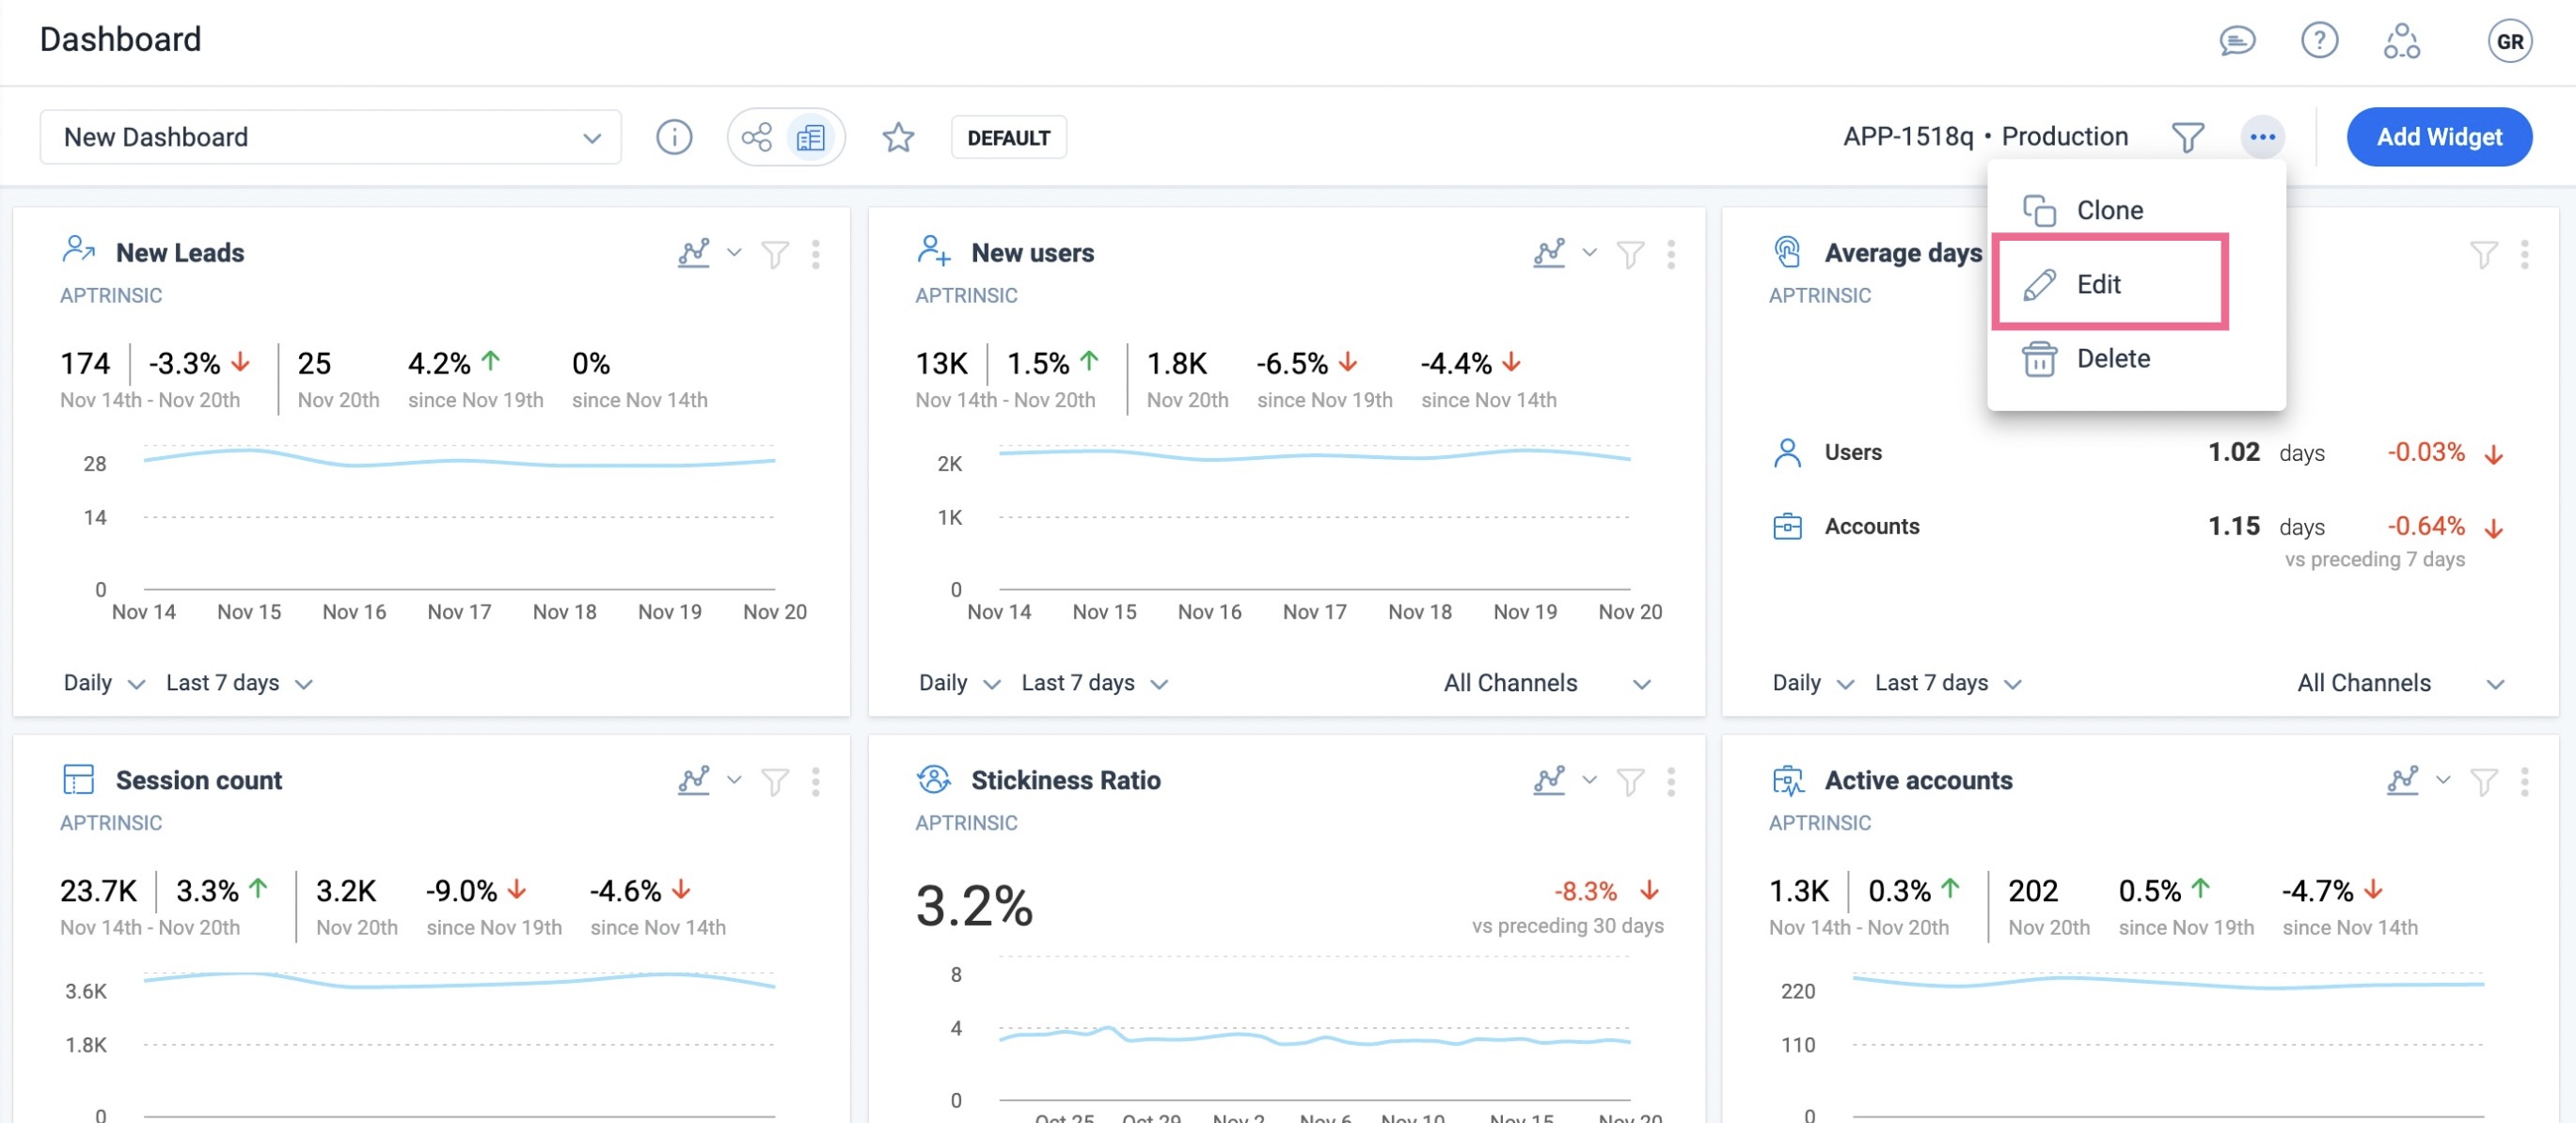
- Click Update after making relevant changes.
Export Dashboard
Dashboards in PX can be exported to PDF or PNG to share insights, track trends, and communicate outcomes more effectively across your organization. Exported files contain information on global filters applied to the dashboard, as well as filters applied to specific widgets.
To export a dashboard:
- Click the three-horizontal dots menu from the top of the dashboard.
- Select the Export as option. The following options are available:
- PNG
- Preview the entire dashboard and all relevant details before exporting to ensure accuracy and completeness.
- Click Export.
Note:
- The export option is only available once all widgets have finished loading.
- In addition to exporting the entire dashboard, you can also choose to export individual widgets for granular details. For more information, refer to the Export Widget section.
- While PNG exports download directly, PDF exports opens the print dialog of your browser. Ensure the Save as PDF option is selected in the Destination field before clicking Save.
- Widget sizes in the export are standardized and may not reflect the original layout. For example, 1x1 Query Builder or Feature Performance widgets are rendered at full width. Review the export preview to ensure the layout meets your expectations before exporting.

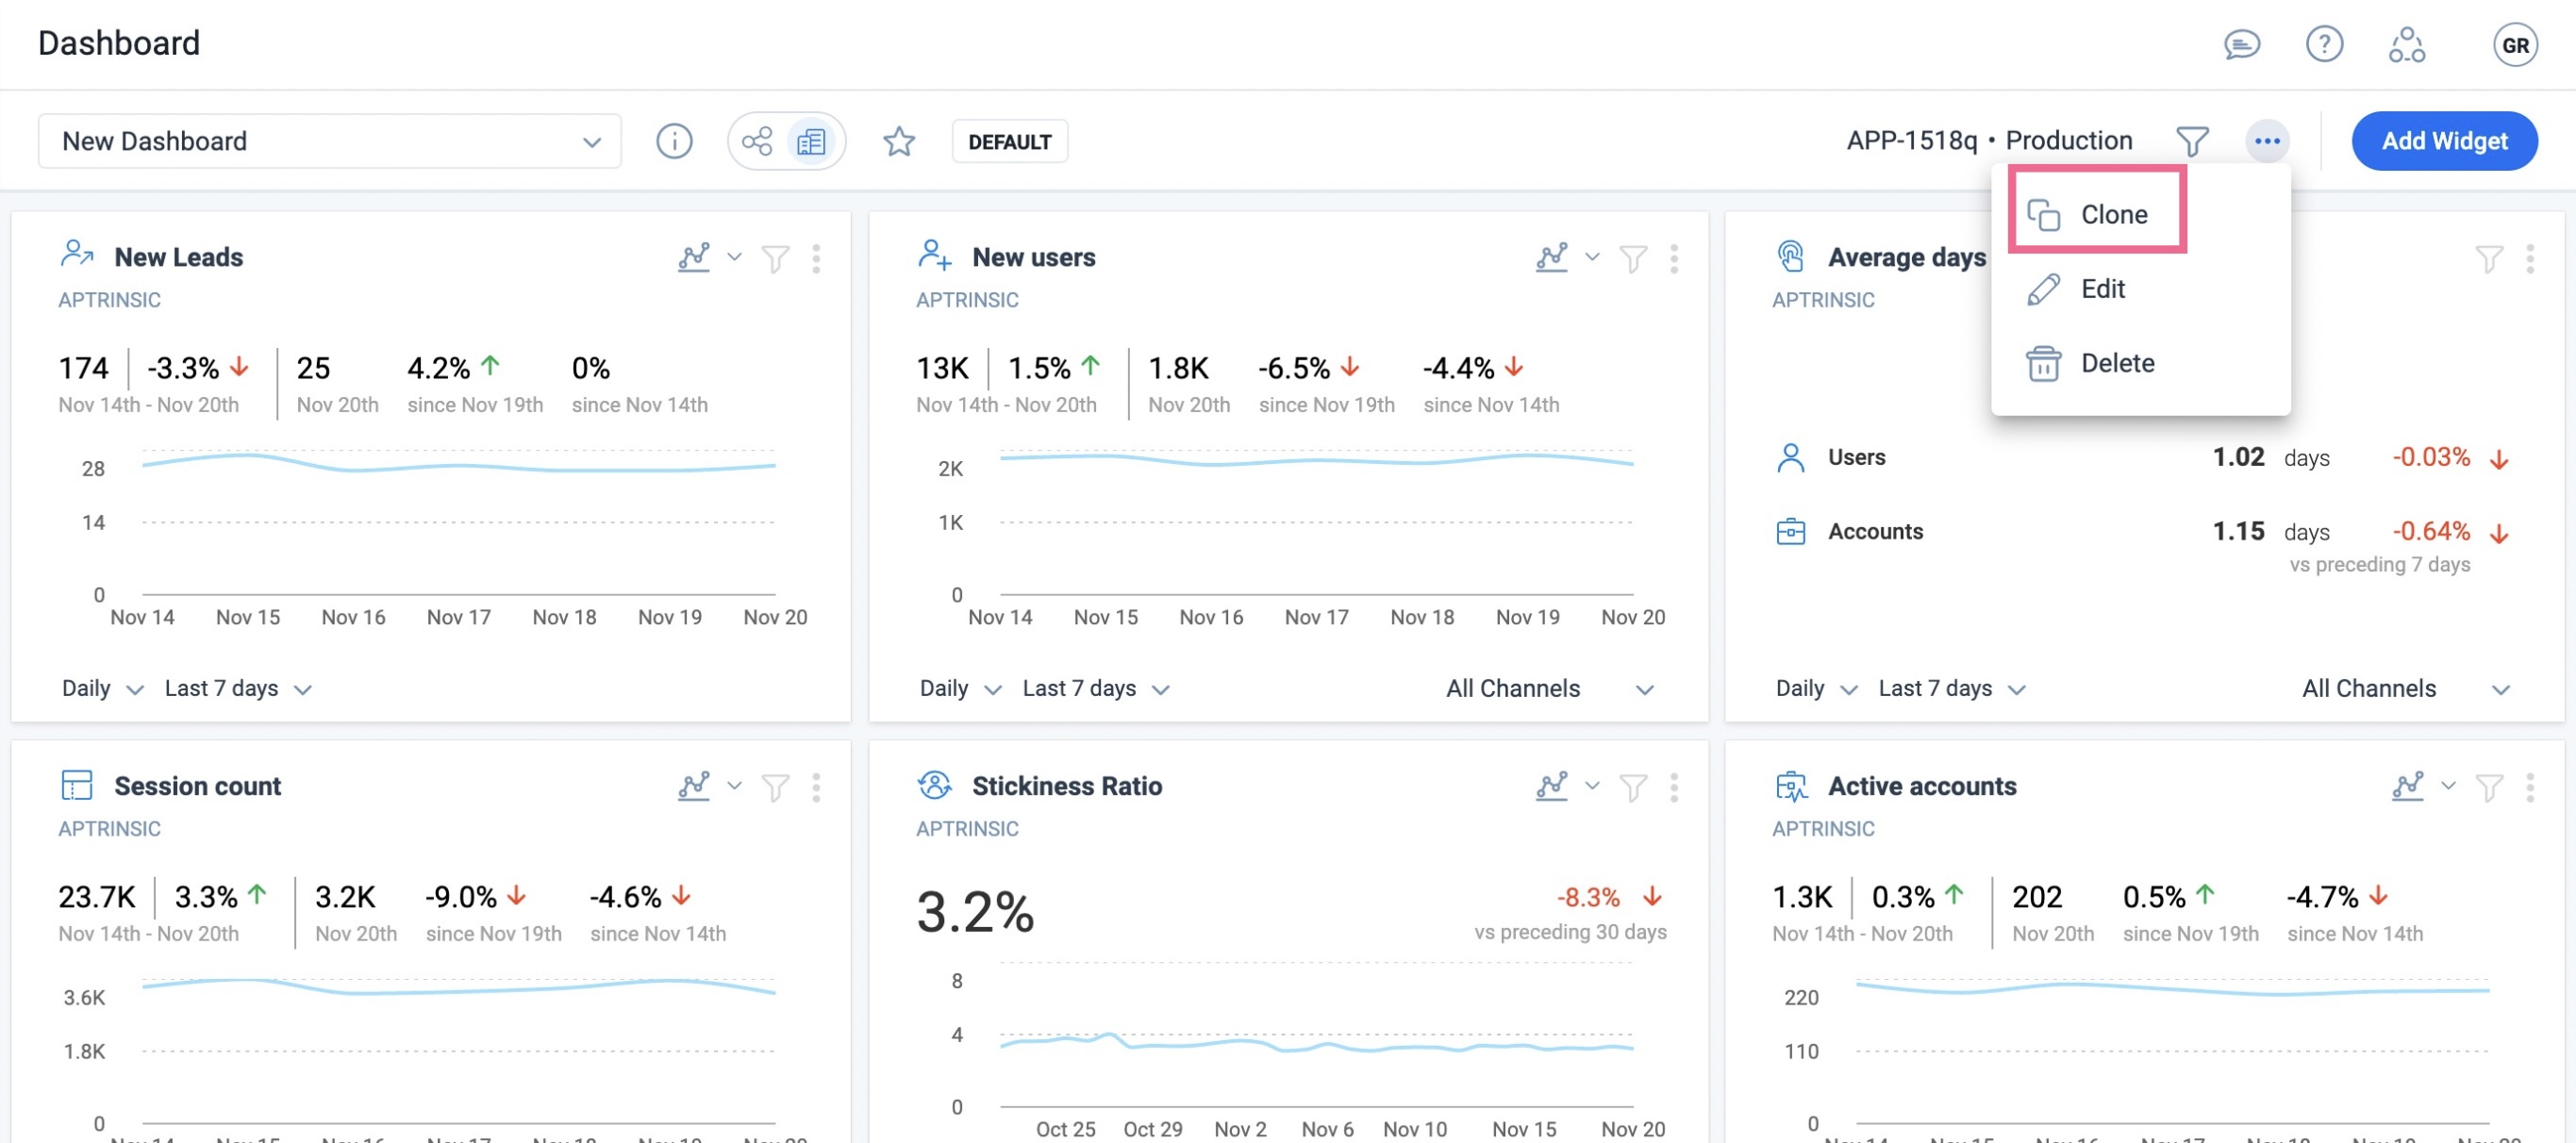
Clone Dashboard
Cloning allows you to copy any Dashboard. The cloned Dashboard has the same name as the original Dashboard. The word Clone is appended at the end.
Click the clone icon from the three dot horizontal menu to clone Dashboard. Another Dashboard will be created with the same name along with the ‘Clone’ tag under the MY DASHBOARDS section.
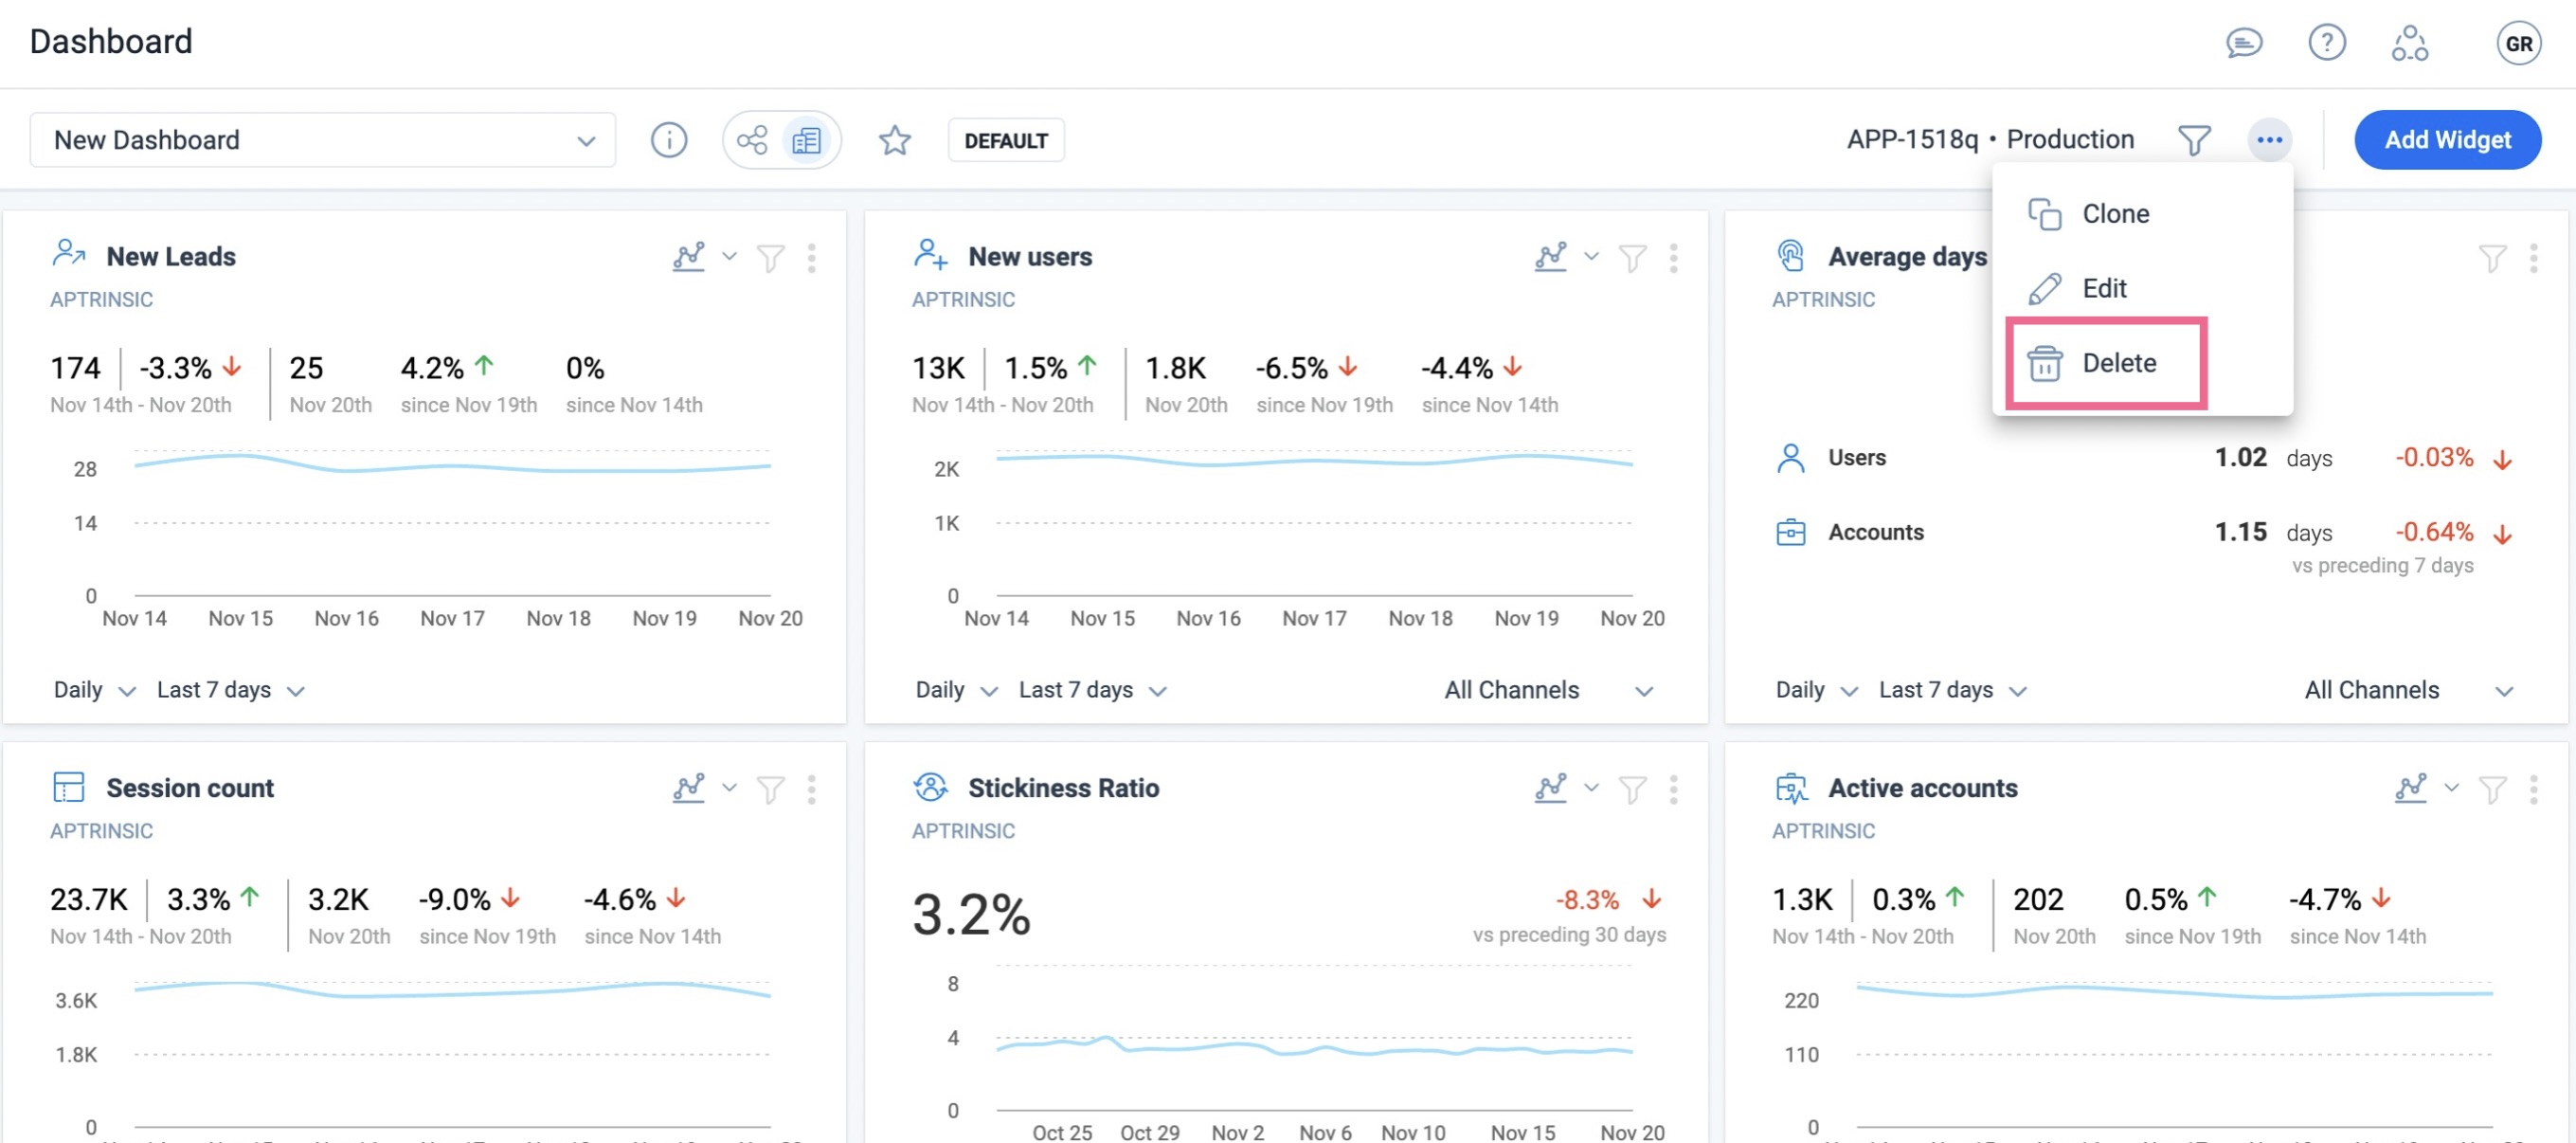
Delete Dashboard
Deleting a dashboard is very easy. Open the Dashboard and simply click Delete Dashboard from the three dot horizontal menu.
IMPORTANT: Clicking the delete icon will permanently delete the dashboard from the account and the deleted dashboard cannot be retrieved.
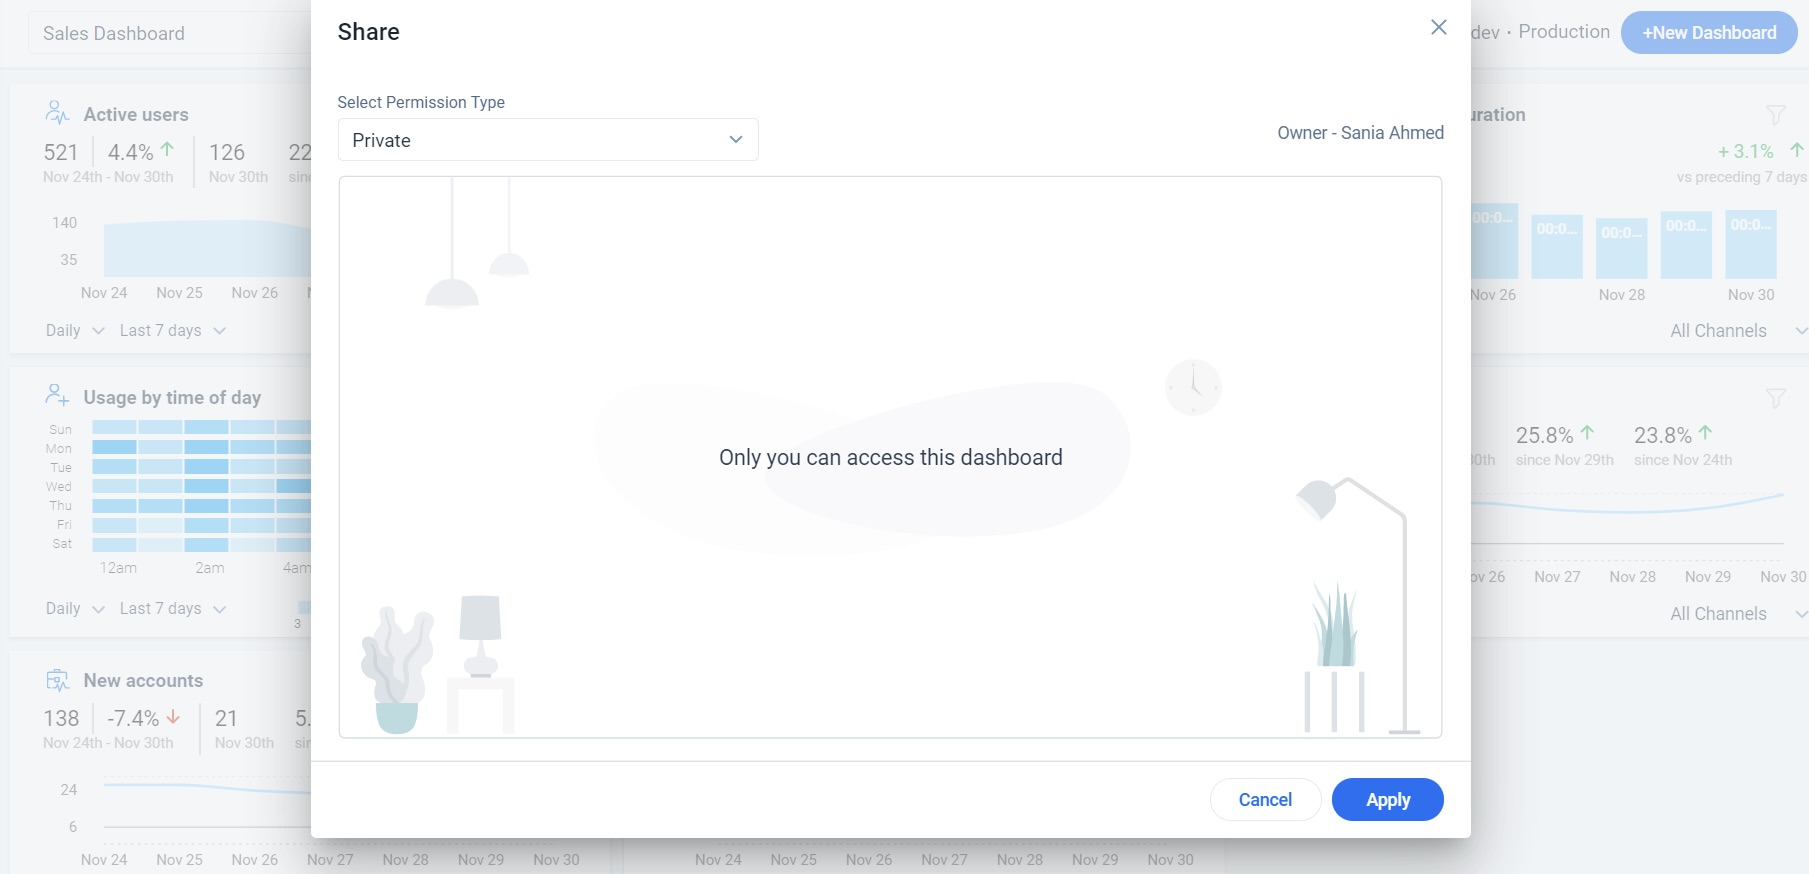
Set Access Permissions on Dashboard
Once you create dashboards, you can share them with users across the subscription by clicking the share icon. Users can view and edit the live dashboards to which they have access.
Gainsight PX offers the following three dashboard permissions.:
- Private
- Public
- Give Access to Specific Users
Private
All the dashboards created by you are listed under this category. Only you can view, edit, and delete the private dashboards. Set this permission type by selecting the Private option from the Select Permission Type dropdown.
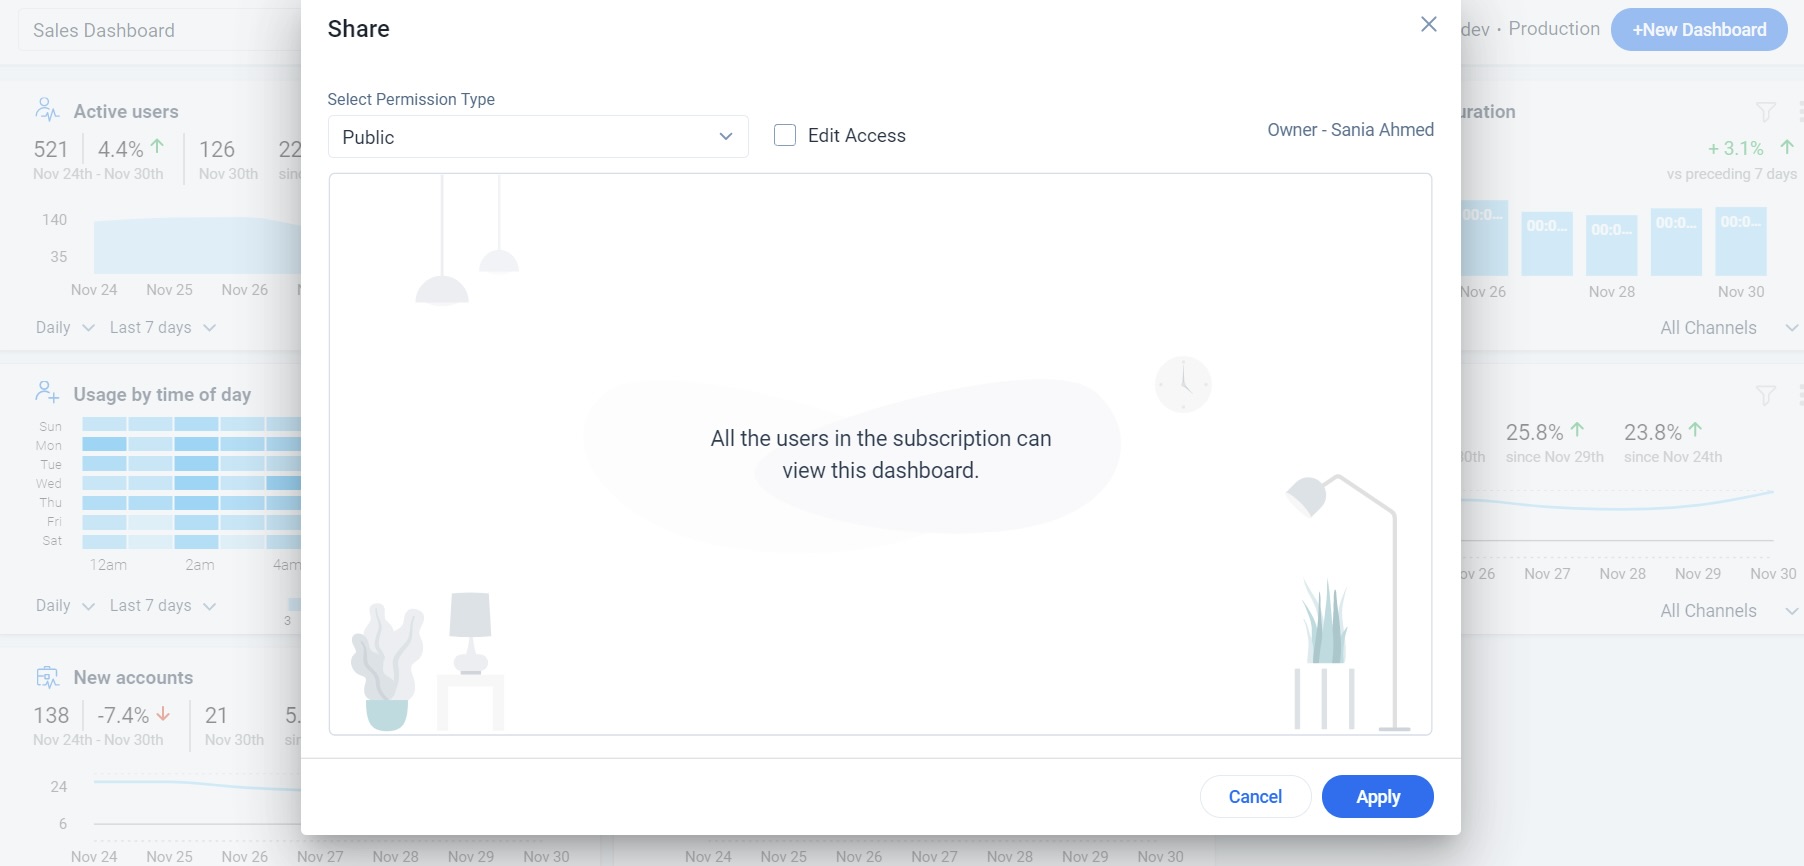
Public
Assign the Public permission to a dashboard if you want the dashboard to be accessible to all the users in the PX subscription. By default, a dashboard is created with Public permission. To change any other permission type of a dashboard to Public, select the Public option from the Select Permission Type dropdown.
Note: When you enable Edit Access, all the users in the subscription can edit the dashboard.
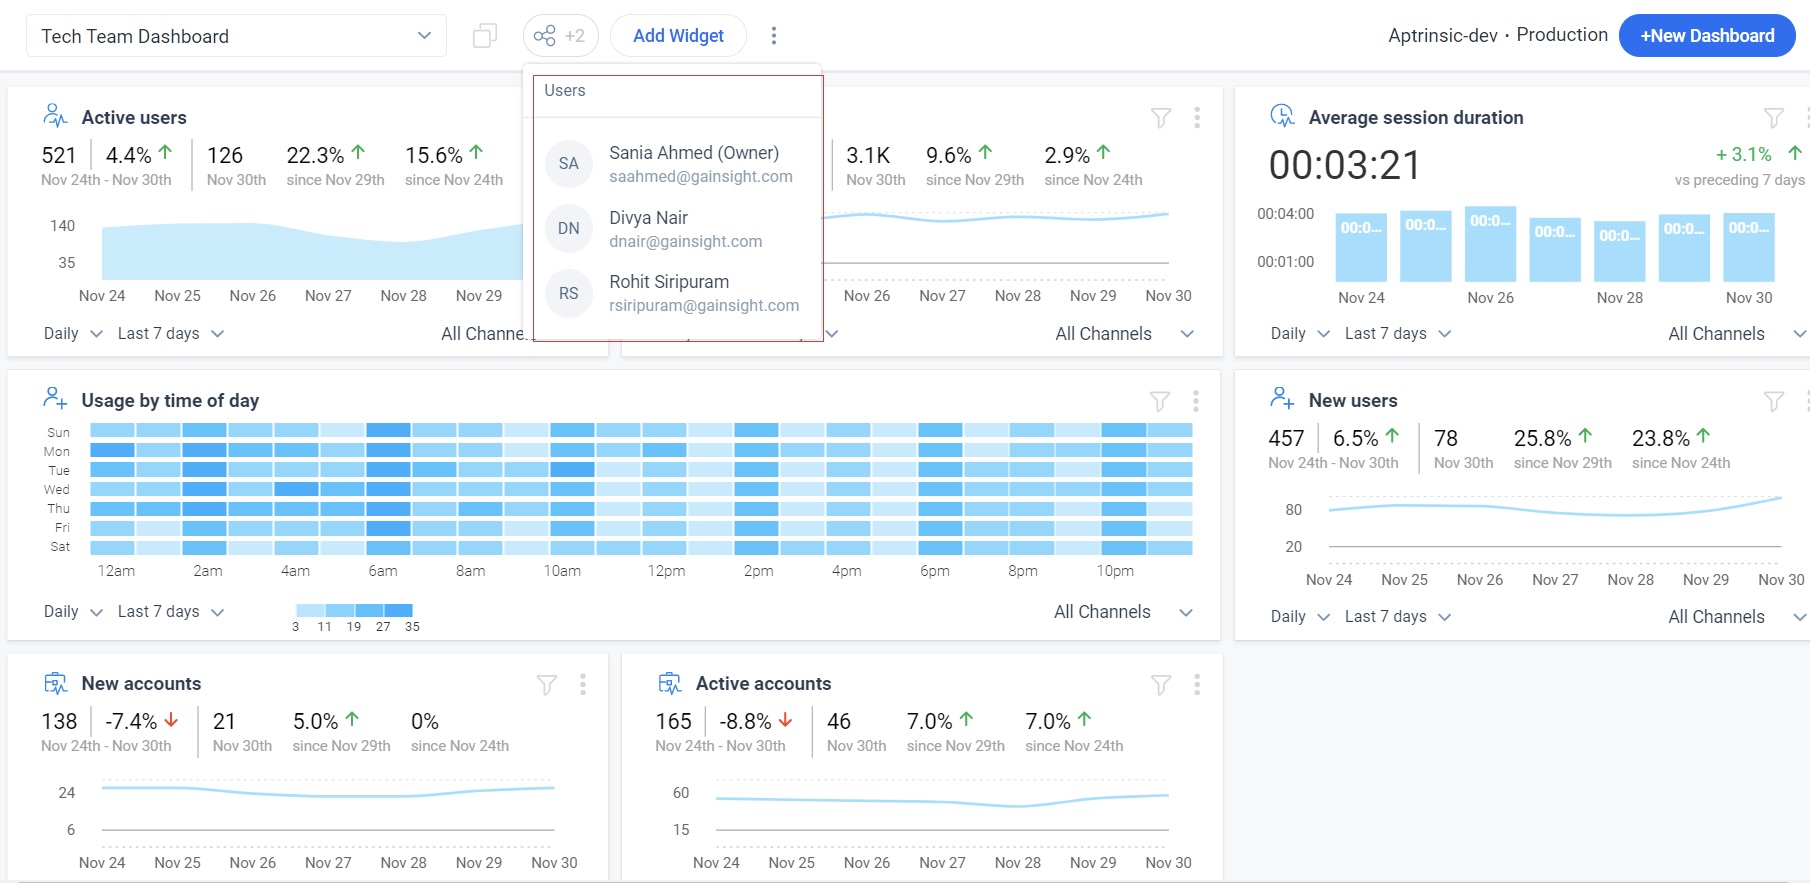
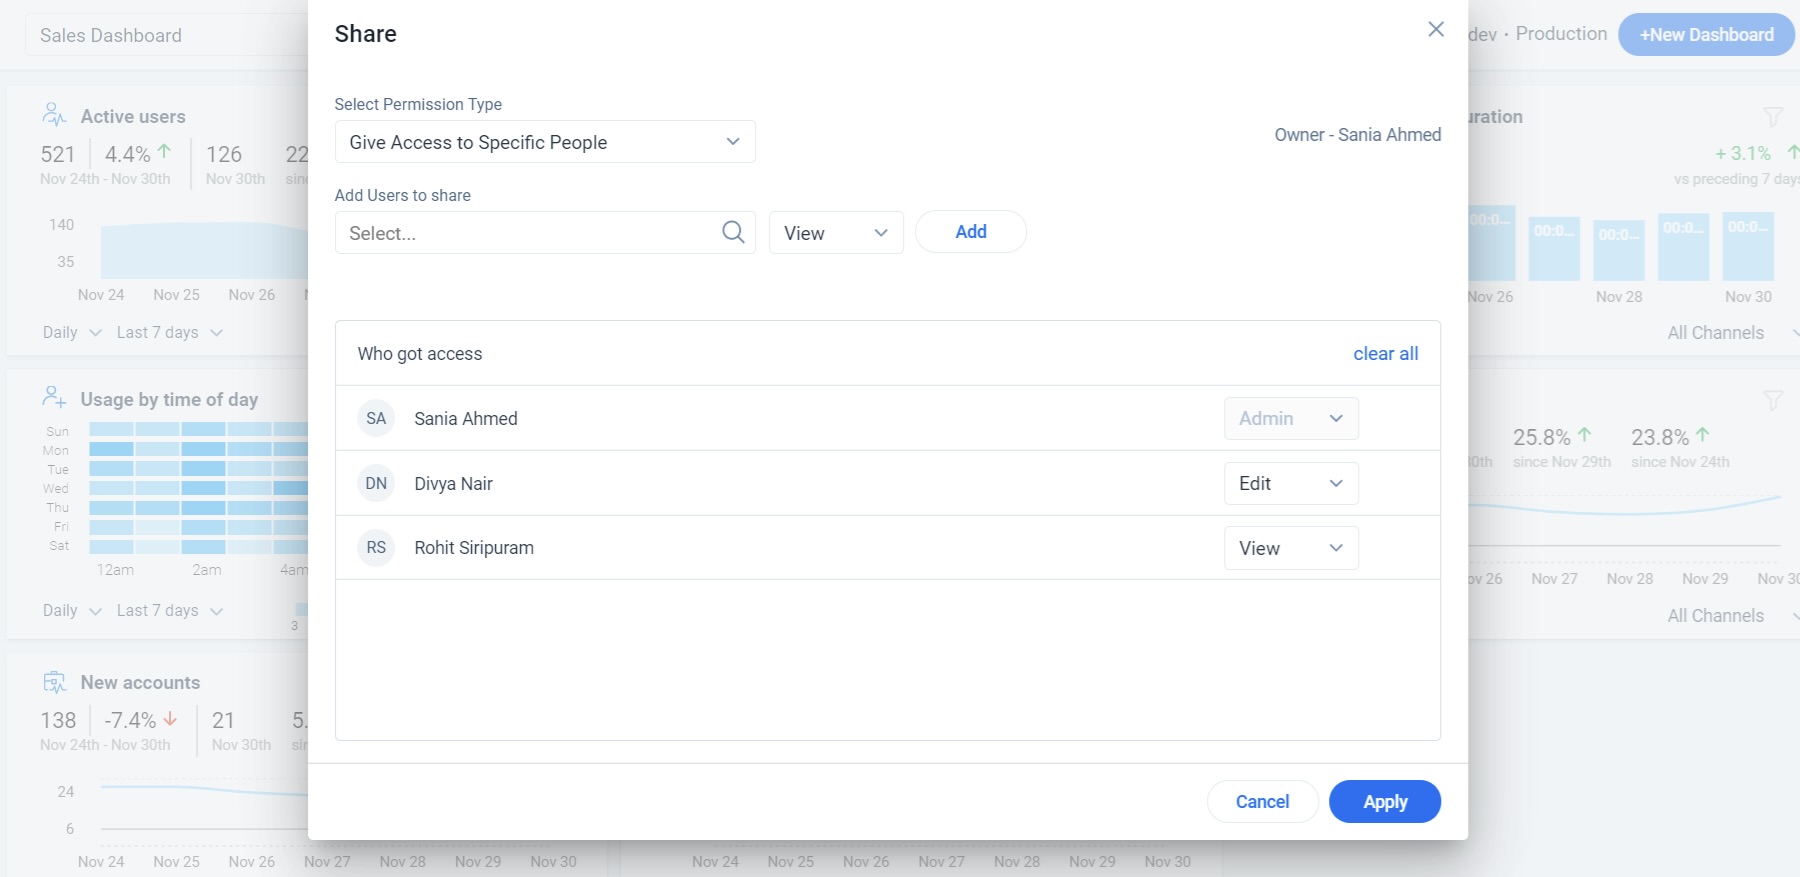
Give Access to Specific People
Assign access to specific people using this permission type. You can select the required users for sharing the dashboard from the Add Users to share dropdown. You can change view/edit access permission for each user and also delete any user from the shared list.
Note: The dashboard owner's name and permission details are displayed when you hover over the Share icon in the Dashboard Home page.