Report List View and Settings
Gainsight NXT
This article explains to admins how to use the options available in the Report List and Settings pages.
Introduction
The Report Builder feature is categorized into two pages, the Report List and Settings. The Report List view page contains all the existing reports, folders, list view options and allows you to create new reports. The Settings has options to enable/disable the report data downloads, chart editor settings, color palette settings, and custom colors.
To access Report Builder, navigate to Insights > Report Builder:
Report List Options
The options in the Report List page are categorized into three sections:
- Report List View and Options
- Folders
- Pagination
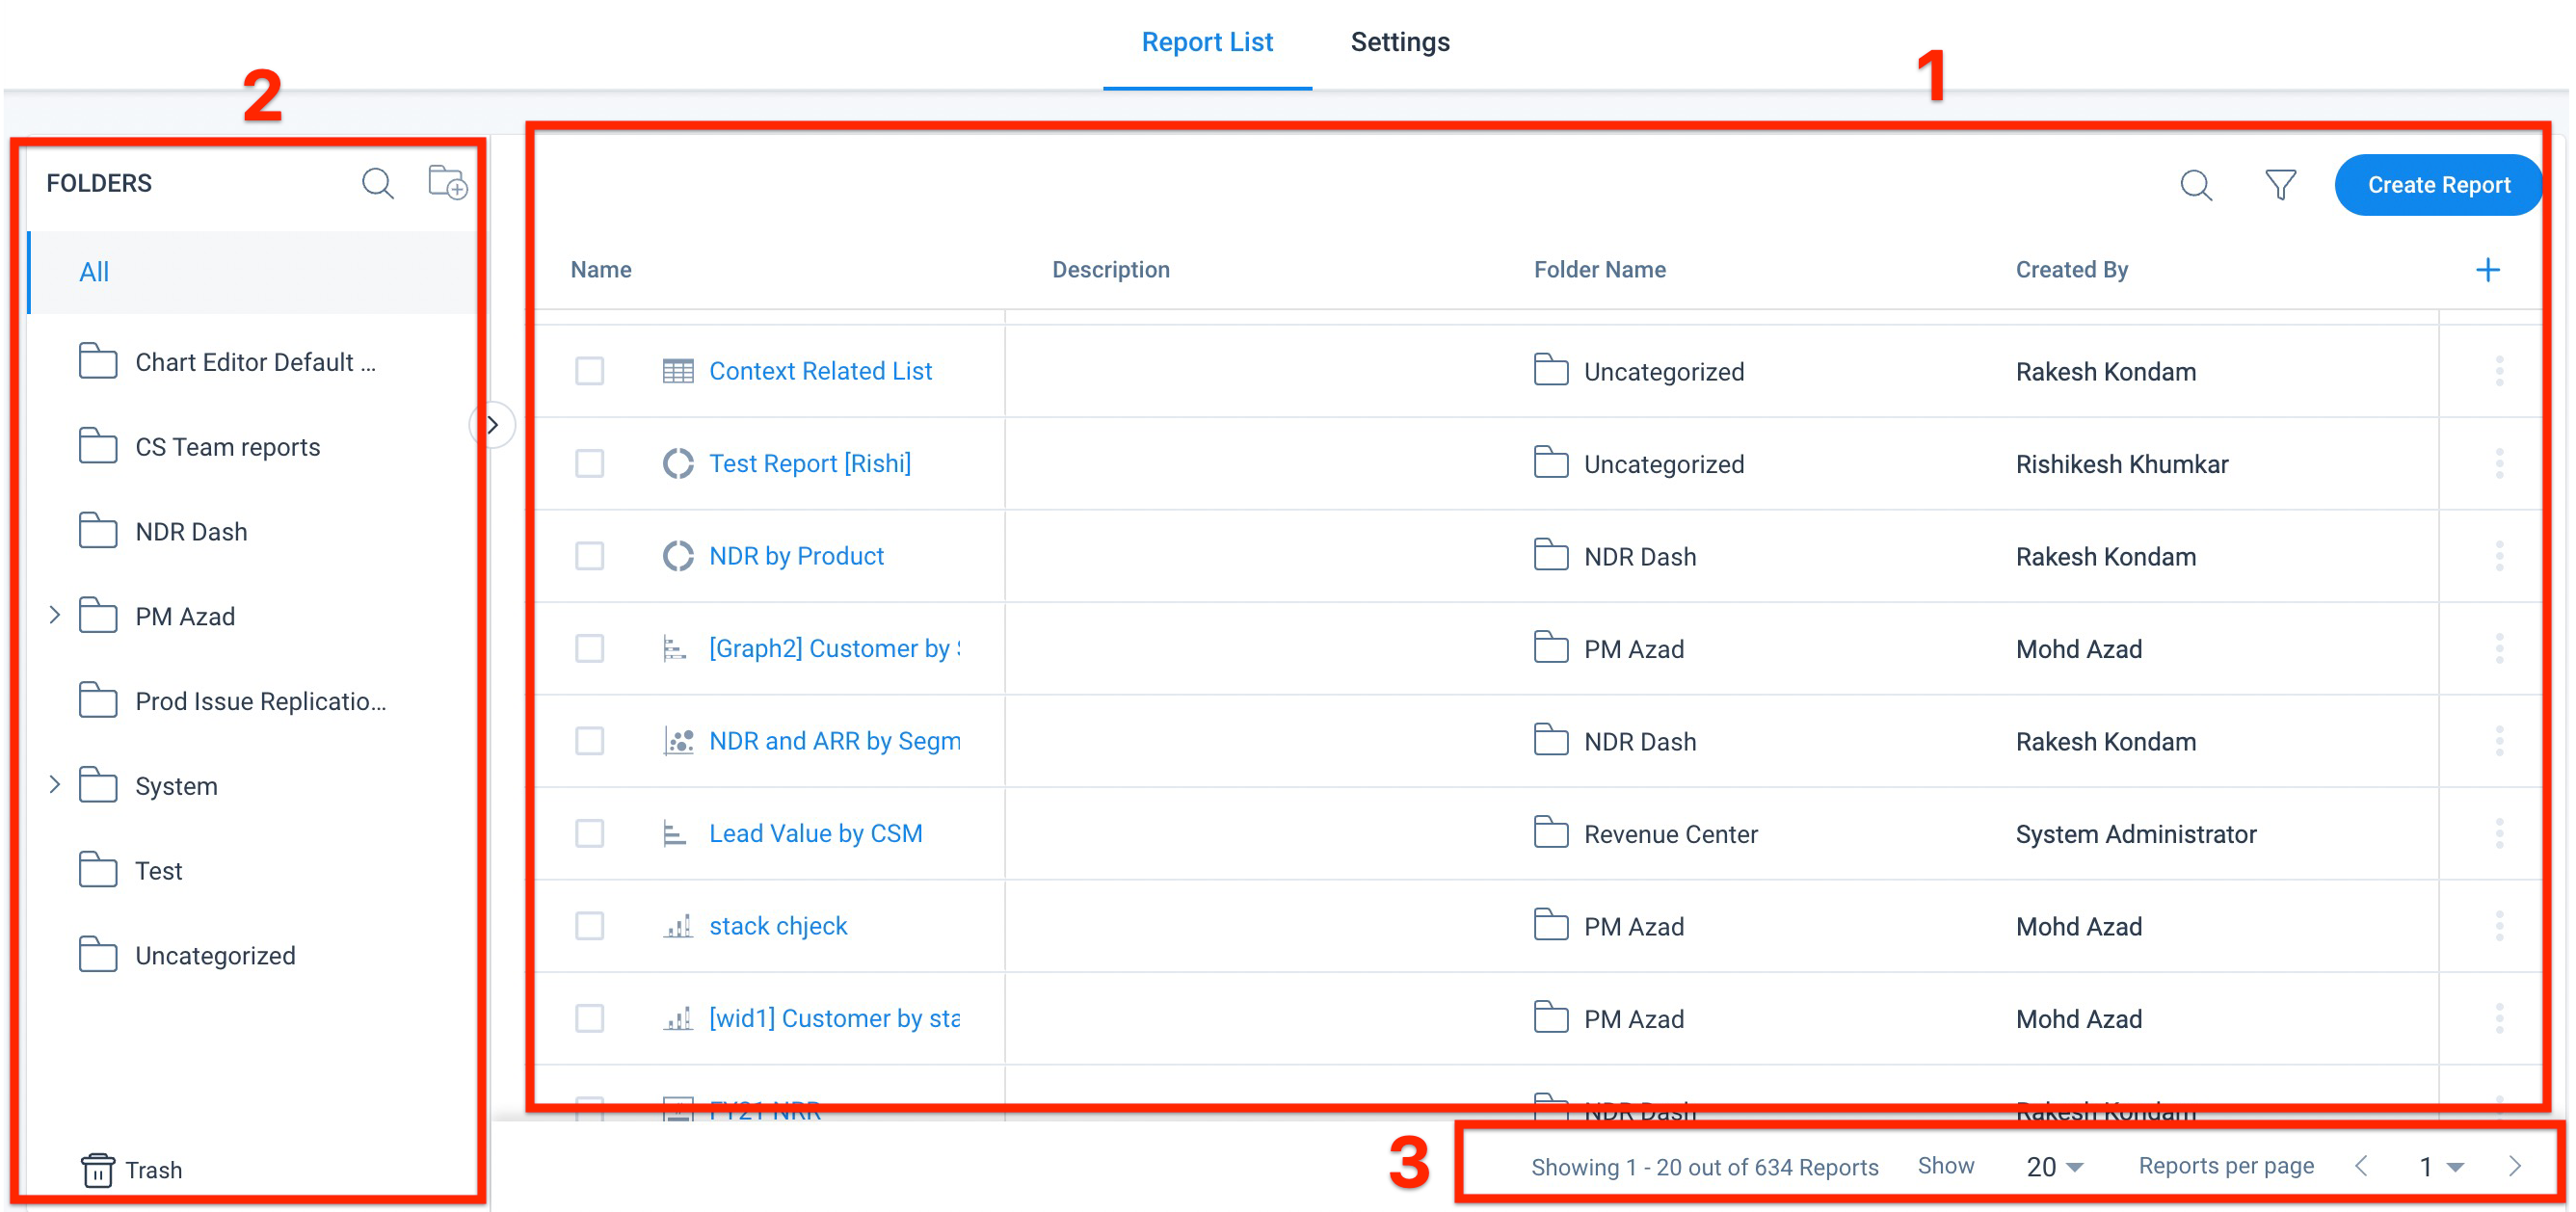
List View and Options
The Report List page displays all the existing reports from all the folders. The options available under Reports are:
-
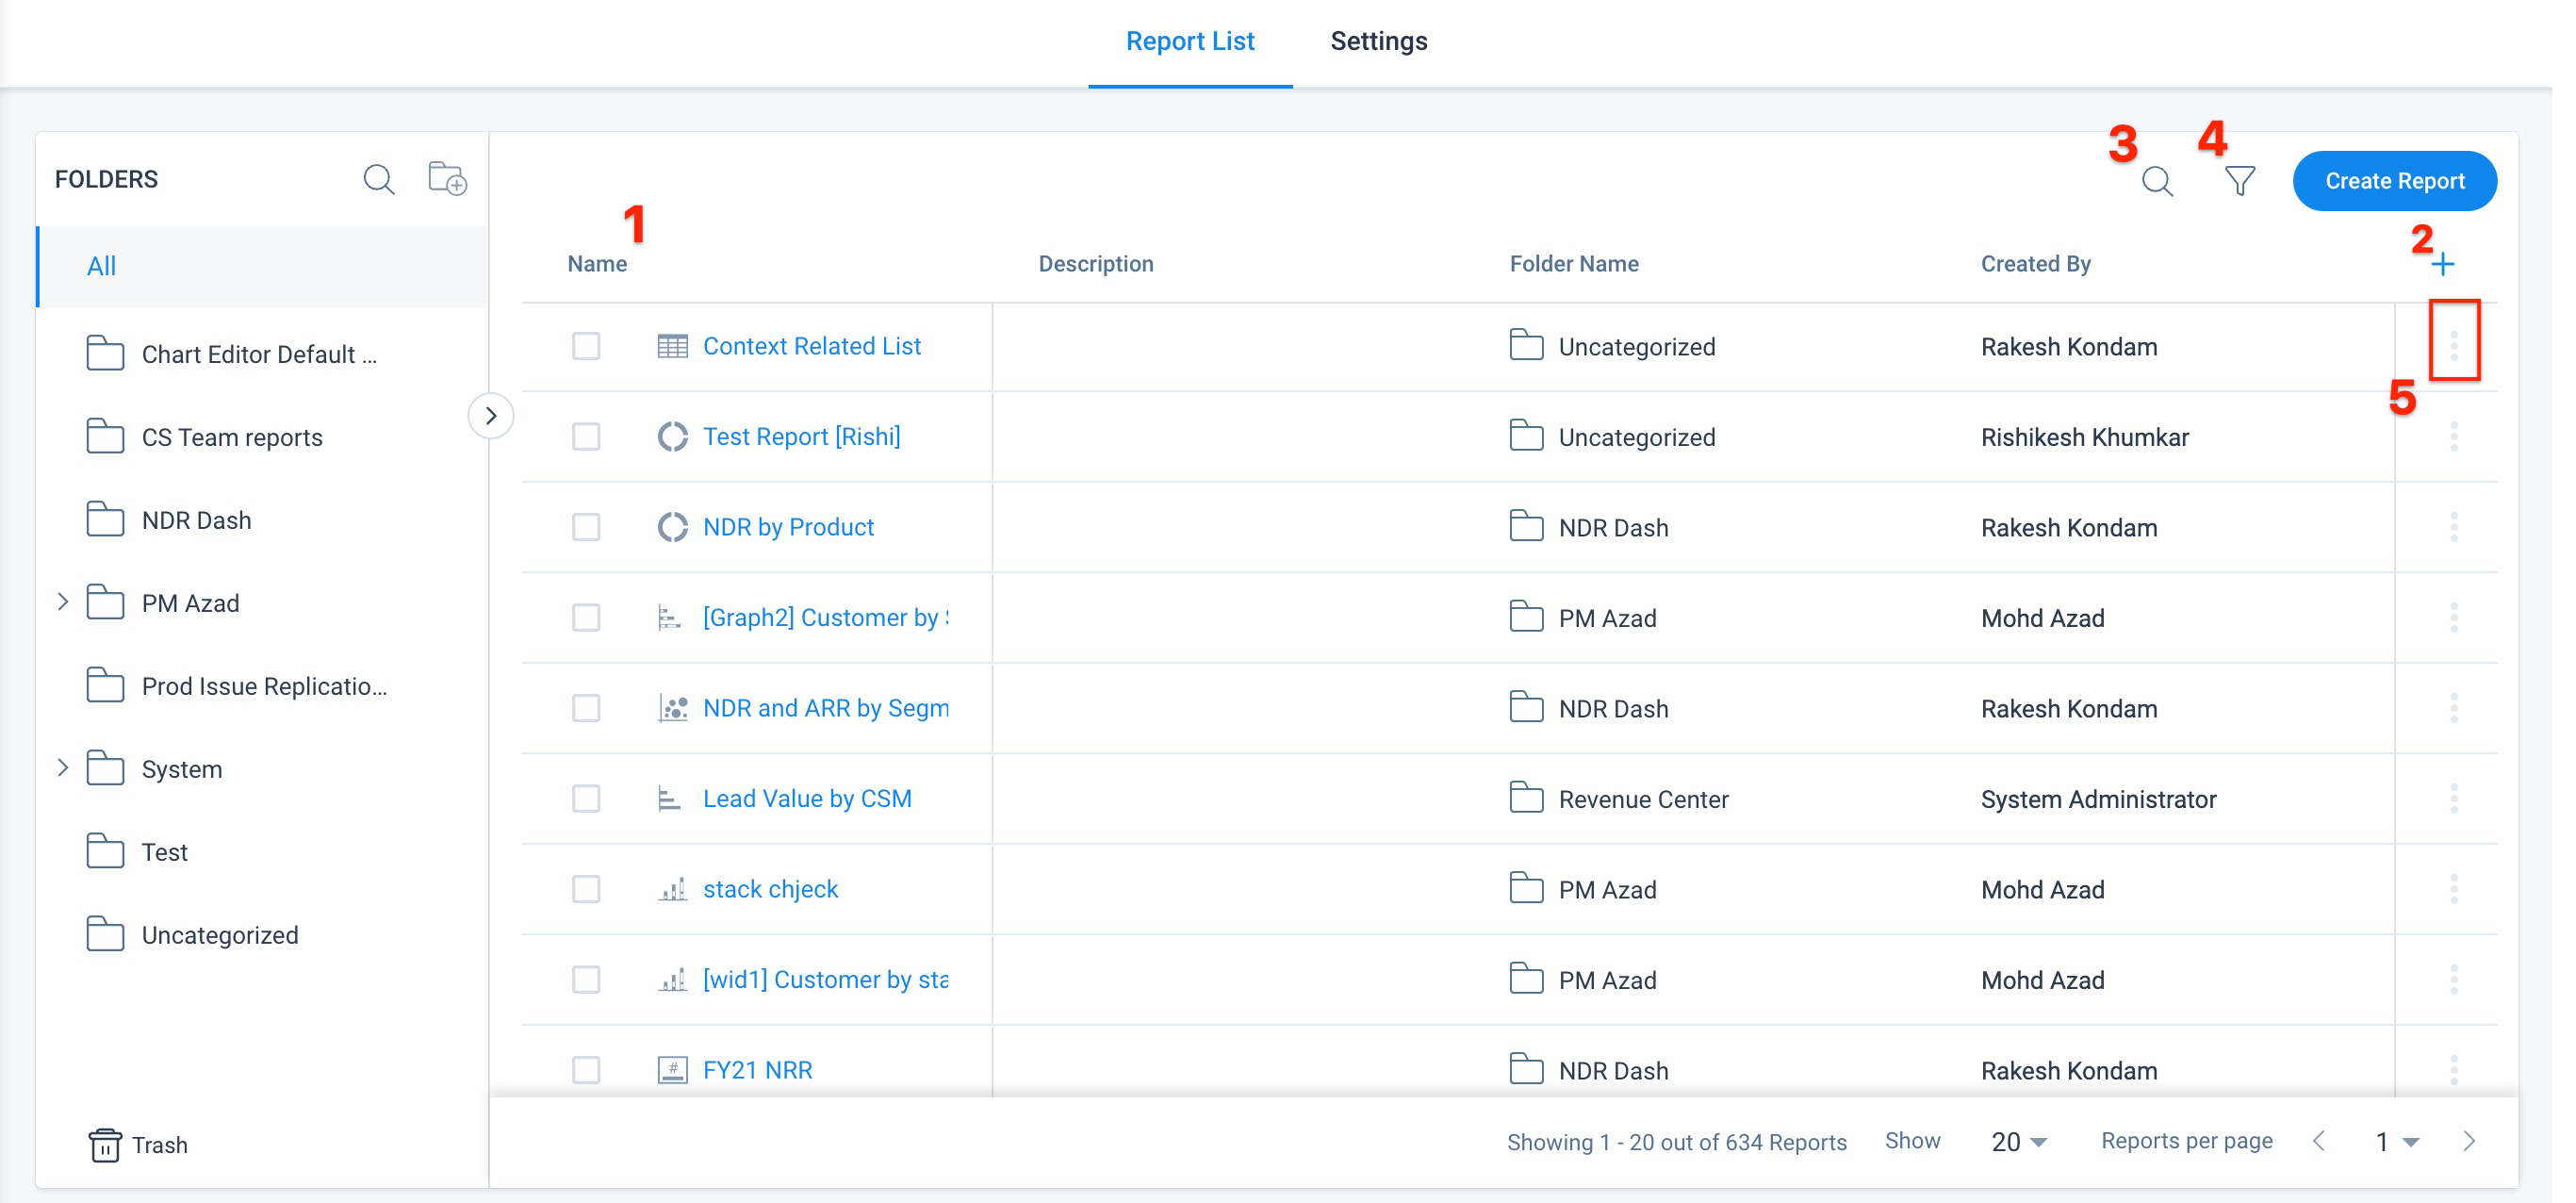
Name: The Name field displays the name of the reports along with the visualization type. Click the Report Name of your choice to view or edit the report.
- Settings: Click the + icon next to the Filter icon to customize the Report List View. You can Search, Select single or multiple fields, and click Apply to add them to the report list view.
Following fields are available under Settings option. Select and add the required fields to the Report List View:
- Name: The display name of the Report. This field is selected by default and you cannot deselect it.
- Description: It displays the details about the report a user-entered while creating it.
- Folder Name: It displays the Folder Name of the report.
- Created By: it displays the Name of the user who created the report.
- Created Date: it displays the Created date of the report.
- Modified By: it displays the Name of the last user who modified the report.
- Modified Date: it displays the Last modified date of the report.
- Used In: it displays the name(s) of the dashboard(s) that specific report is used in. Hover on the specific report to see the name(s) and list of dashboard(s).
- Source Object: it displays the Source Object name of the report.
- Deleted: it displays the delete status of the report, either True or False. If the report is deleted, it displays True in the Trash folder.
-
Search: Enter the Report Name to see the search results.
- Filters: can be applied on reports based on Source Object, Created By, and Modified By criteria.
To apply a filter on Source Object:
- Click the Filter icon.
-
From the Field dropdown list, select Source Object.
-
From the Operator dropdown list, select either in or not in.
-
From the Select Items dropdown list, select or search the required source object(s).
- Click Apply.
To apply a filter on Created By or Modified By:
-
Click the Filter icon.
-
From the Field dropdown list, select either Created By or Modified By, based on your requirement.
-
From the Operator dropdown list, select either equals or not equals
-
From the Select User dropdown list, select either Current User, All Users or Other User. Enter the User Name in the Search box, if you have selected Other User.
- Click Apply.
Notes:
- Add more filters by clicking the + icon next to the Value text box.
- Delete a filter by clicking the X icon.
- Remove all filters by clicking the Clear button.
-
Context Menu: Click Context Menu to view the following actions:
- Edit Report: it allows you to Edit the selected report.
- Rename Report: it allows you to Rename the selected report.
- Delete Report: it deletes the selected report and the report is moved to the Trash folder.
-
Checkbox: Select the checkbox for one or more reports to move or delete.
Notes:
- You can sort and rearrange columns as required.
- If a report is used in a dashboard, you cannot delete it.
Folders
Folders manage and organize the reports created in your org. By default, you can see All and Uncategorized folders. You can create folders and subfolders under All, as well as edit and delete folders/subfolders. If a report is not categorized or moved to a specific folder, the report remains Uncategorized.
All: It displays the list of reports available under all the folders and subfolders.
Uncategorized: All of the reports that are not categorized under a separate folder appear here.
Note: The reports within the System folder cannot be deleted or updated.
Create Folder
To create Folders:
- Click the Add new folder icon. The Add Folder window appears.
- In the Folder Name text box, enter the Folder Name as required.
- Select the Parent Folder from the displayed list of folders. For example, you can select Home to create a Folder (or) Select an existing folder, if you want to create a Sub-folder.
- Click Save.
Edit/Delete Folders
To Edit or Delete folders:
-
Click the Folder Name you wish to edit/delete.
-
Click the Pencil icon to edit the folder name, and click ✓.
- Click the Delete/Trash icon, if you want to delete a folder.
Notes:
- Folders cannot be created under Uncategorized category.
- Only 2 (Base + 1) levels of subfolders under Home can be created.
- Drag and drop a folder (that has no subfolders) into another folder.
- Expand or collapse the folder section to see all the folders in sublevels.
- Enter the folder name in the Search box to see the search results.
- Folders containing report(s) cannot be deleted.
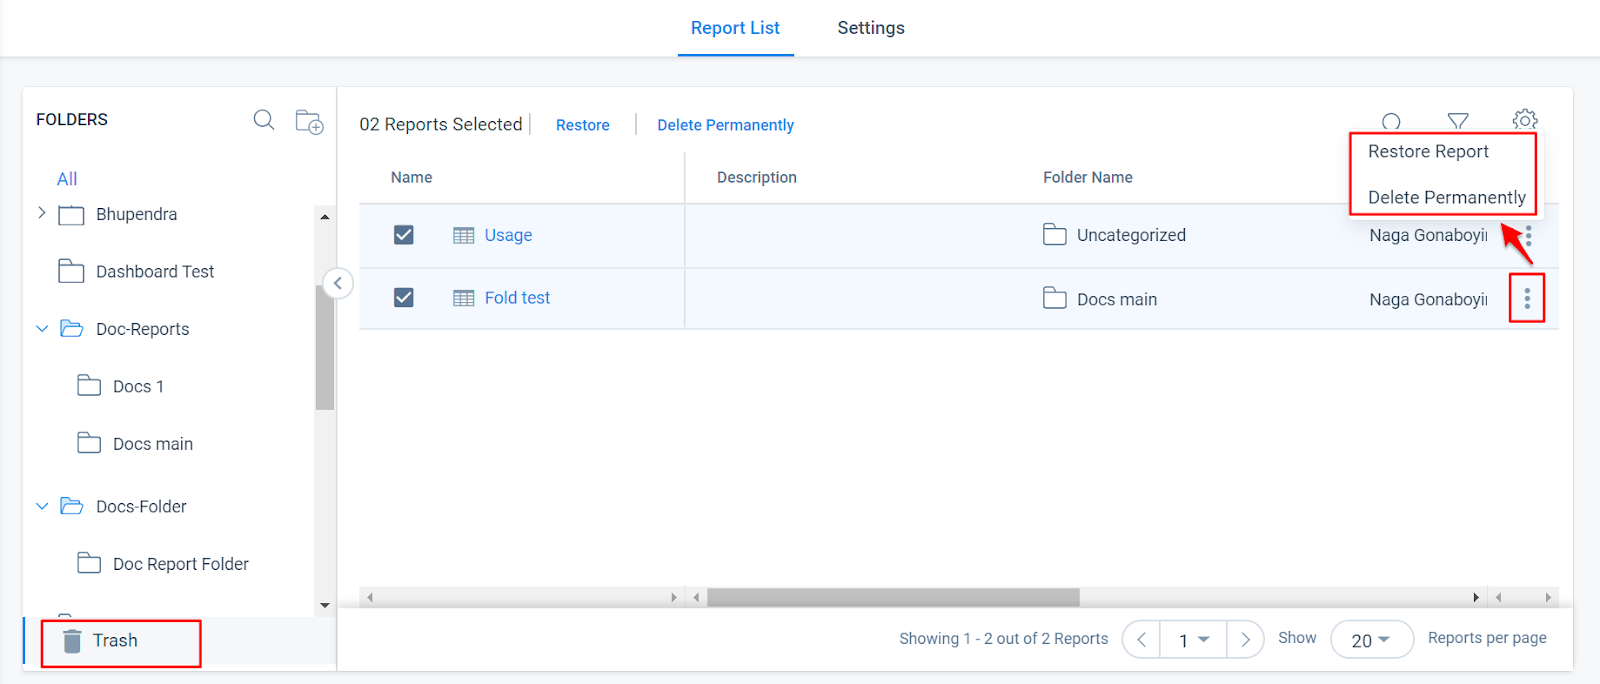
Trash
If you have deleted any report(s) from the list page, you can still find them in the Trash folder. Deleted reports are stored up to 90 days in the Trash folder, and you can either Restore or Delete a report permanently from the trash folder.
Pagination
If you have many reports, use the pagination tool at the bottom right corner of the screen to navigate through different pages and view multiple reports, in a set of 20, 40, or 60 on a single page, based on your selection.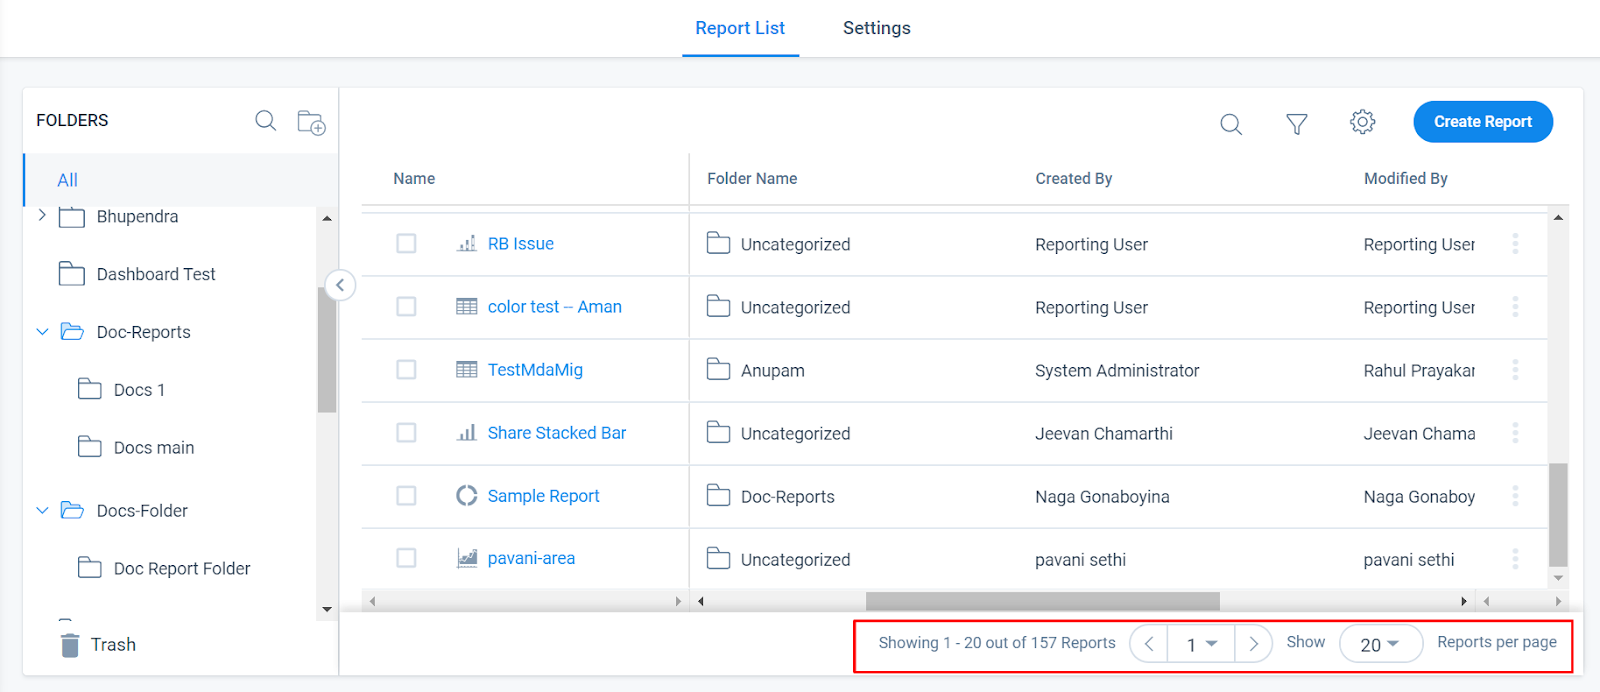
Setting Options
The options in the Settings page are categorized into four tabs:
- General Settings
- Chart Editor Settings
- Color Palette Settings
- Custom Colors
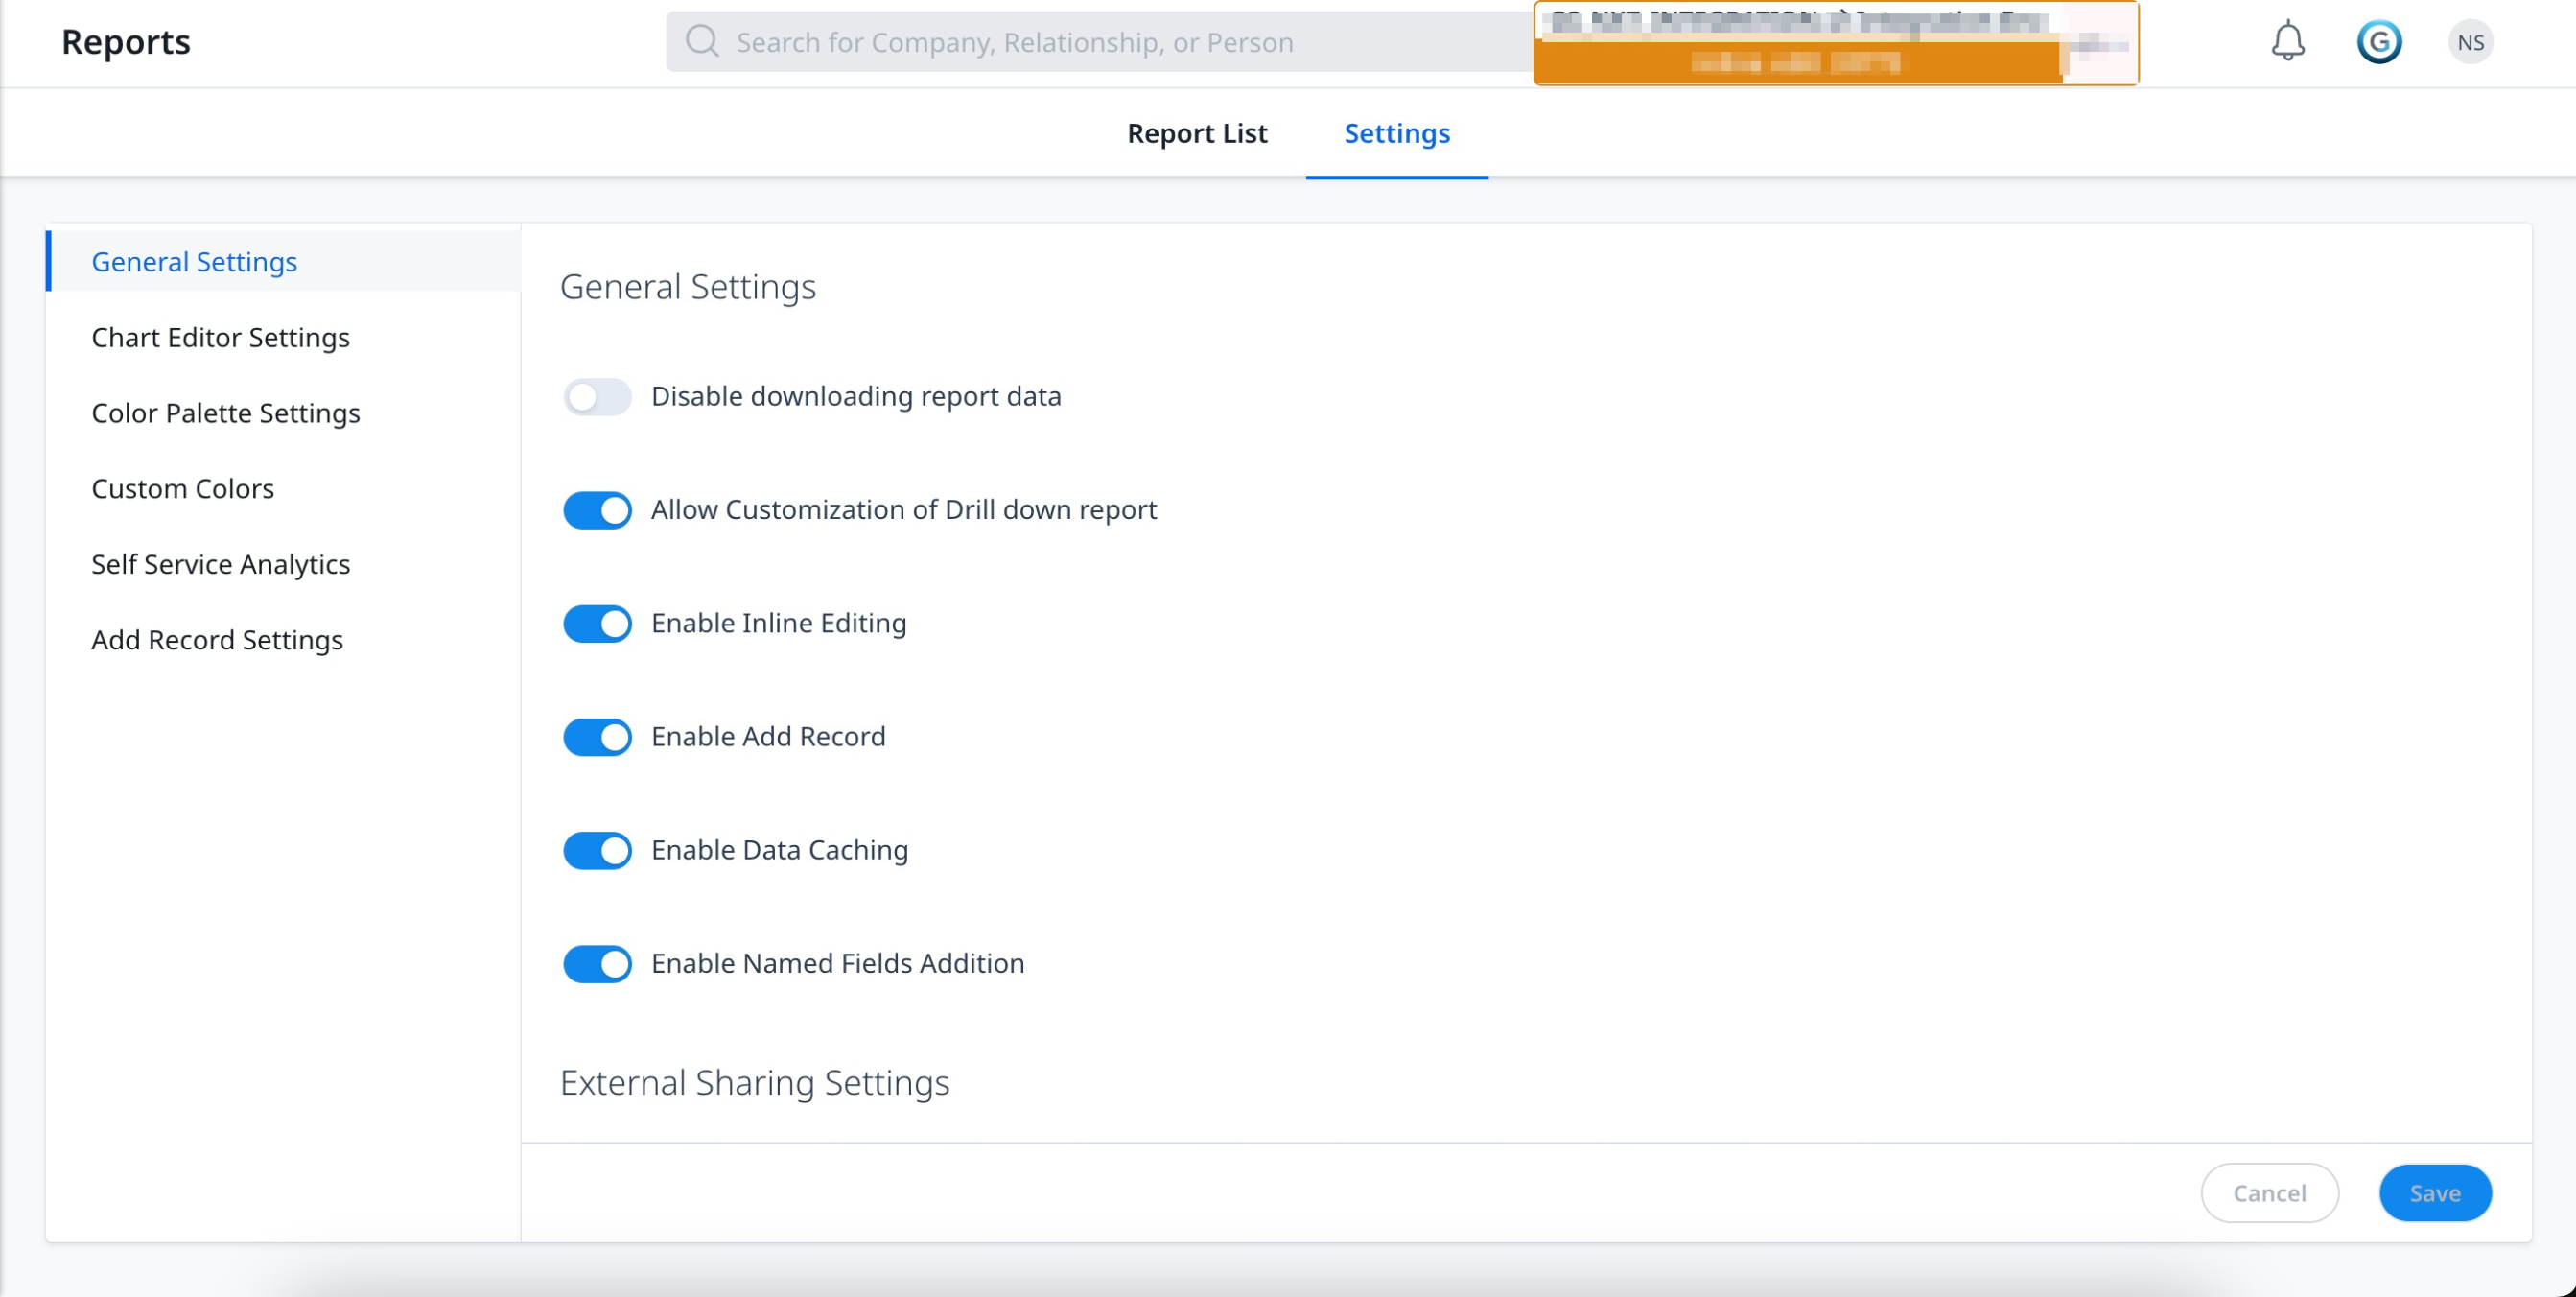
General Settings
The General Settings tab allows you to enable/disable the report data downloads and lazy loading of report widgets. Here, you can configure the following settings:
General Settings
- Disable downloading report data: Enabling this toggle restricts the report data downloads from everywhere. For example, if you do not want a CSM to download a Report, toggle ON this option.
- Allow Customization of Drill down report: Enable this to allow users to customize the drill-down report.
- Enable Inline Editing: Turn on this toggle to enable Inline Editing for the new reports.
- Enable Add Record: Turn on this toggle to enable add and edit record for new and existing reports for low-volume custom objects.
- Enabling Data Caching: Turn on this toggle for report data caching for faster performance. This means when a user runs the same report multiple times in a day and reopens it again can save the report fetching time.
- Enable Named Fields Additions: Turn on this toggle for lookup fields to display named fields in the report. The named field assigned to the lookup field in Data Management is displayed.
Note: By default, the Inline Edit, Add Record, Data Caching, and Named Field Additions toggles are turned on.
External Sharing Settings
- Disable downloading report data: enabling this toggle restricts the report data downloads from the externally shared links.
CRM Settings
Honor SFDC Permissions
The Honor SFDC Permissions toggle option controls how Salesforce object-level and field-level permissions are applied when fetching report data.

When the toggle is turned on:
Report data is fetched using the logged-in user’s Salesforce permissions. If the user does not have access to a Salesforce object or field, the report displays an error or restricts access accordingly.
When the toggle is turned off:
Report data is fetched using the Salesforce Integration (OAuth) User context. The application applies the object-level and field-level permissions configured for the Integration User. The logged-in user’s individual Salesforce permissions are not evaluated for report access.
Salesforce security enforcement is applied in both cases. The difference lies in whether permissions are evaluated based on the logged-in user or the Integration User.
If the Integration User does not have access to certain objects or fields, related report data may be restricted.
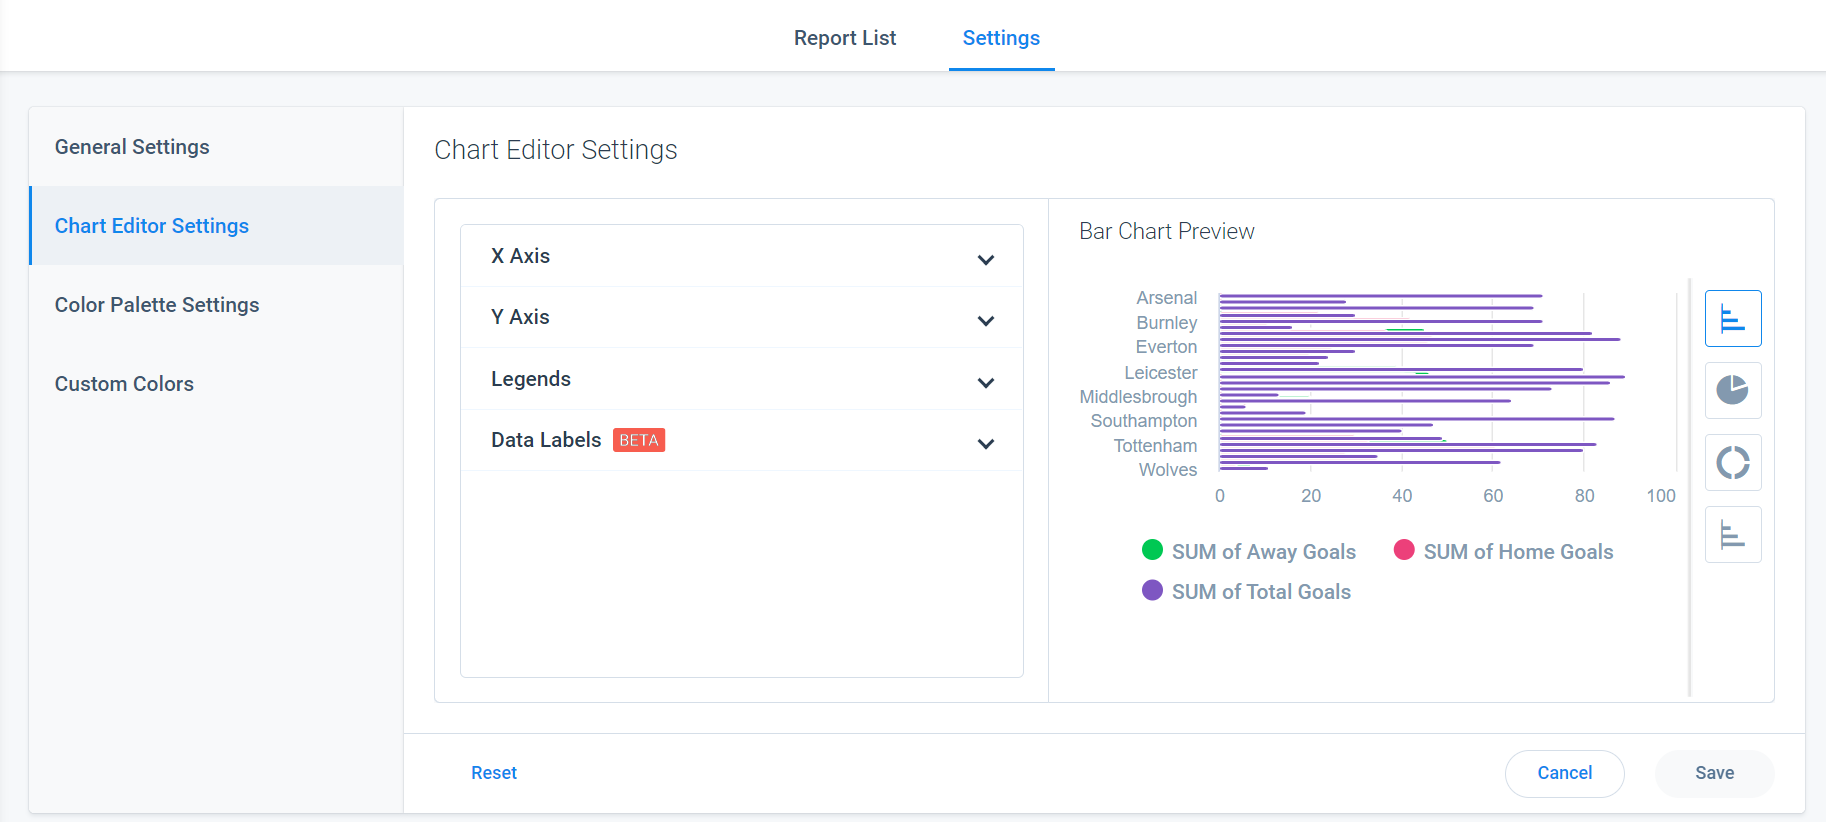
Chart Editor Settings
Chart Editor Settings allow admins to set the default settings of all reports. Once you set these settings, they are applicable for all the new reports. For more information on how to configure Chart Editor Settings, refer to the Chart Settings and Chart Editor article in the Additional Resources section at the end of this article.
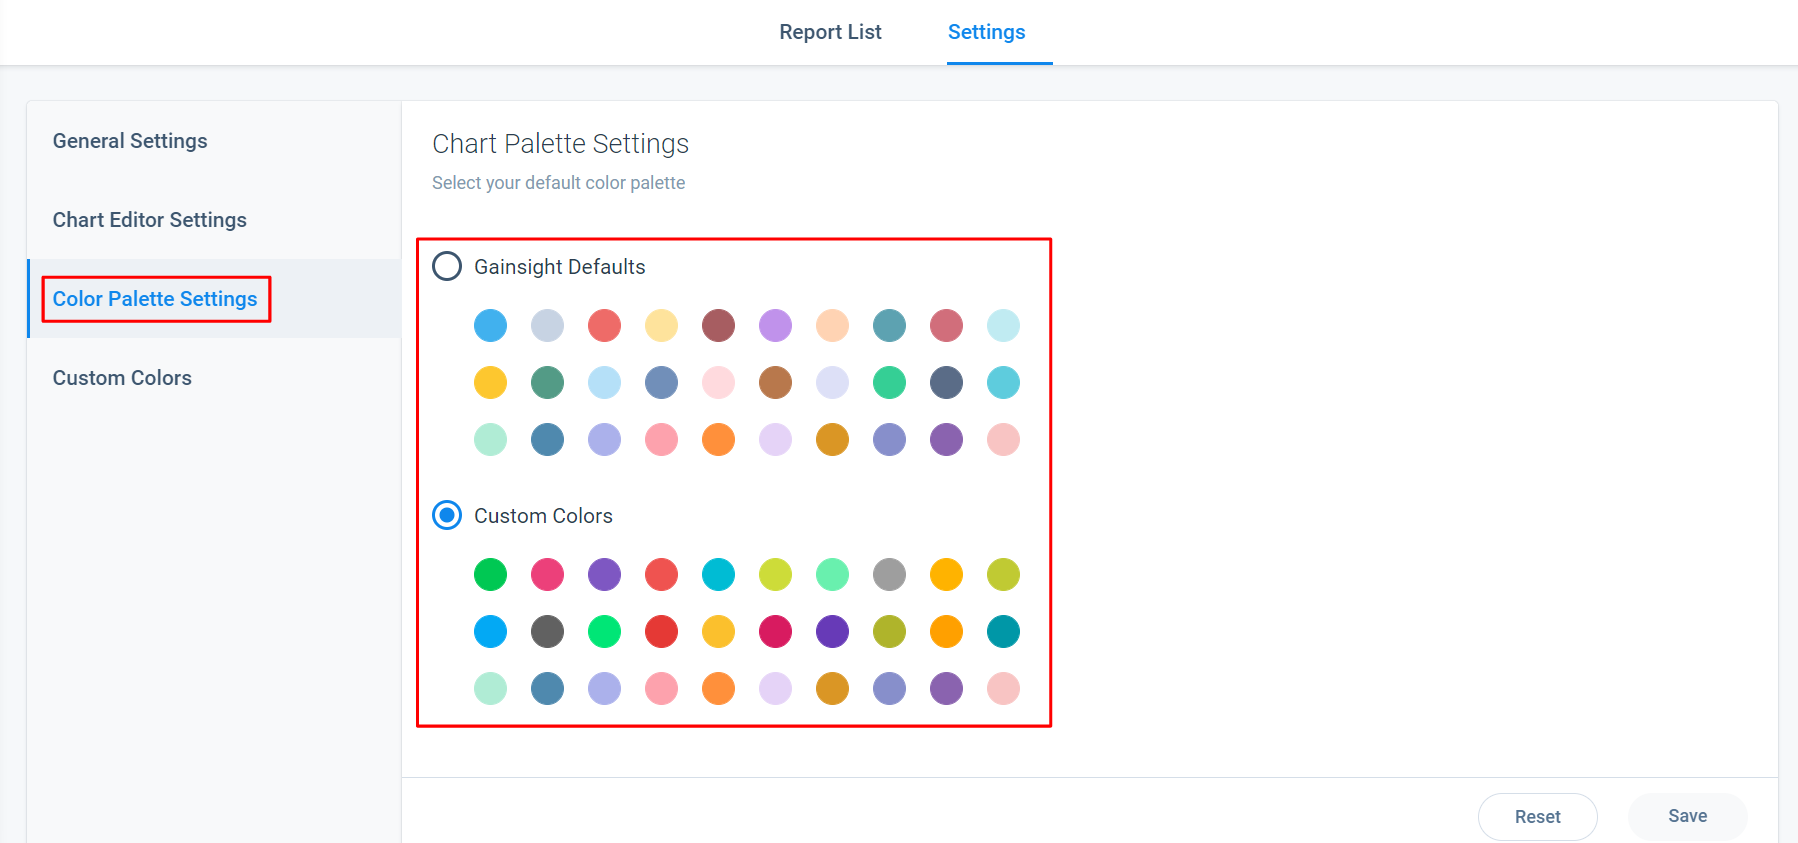
Color Palette Settings
You can choose the Gainsight Defaults color palette which has the best possible colors, once selected, it assigns the sequence of colors used in reports (or) you can use Custom Theme to customize the colors, as per your branding. For more information on how to configure Color Palette Settings, refer to the Color Setting in Reports article in the Additional Resources section at the end of this article.
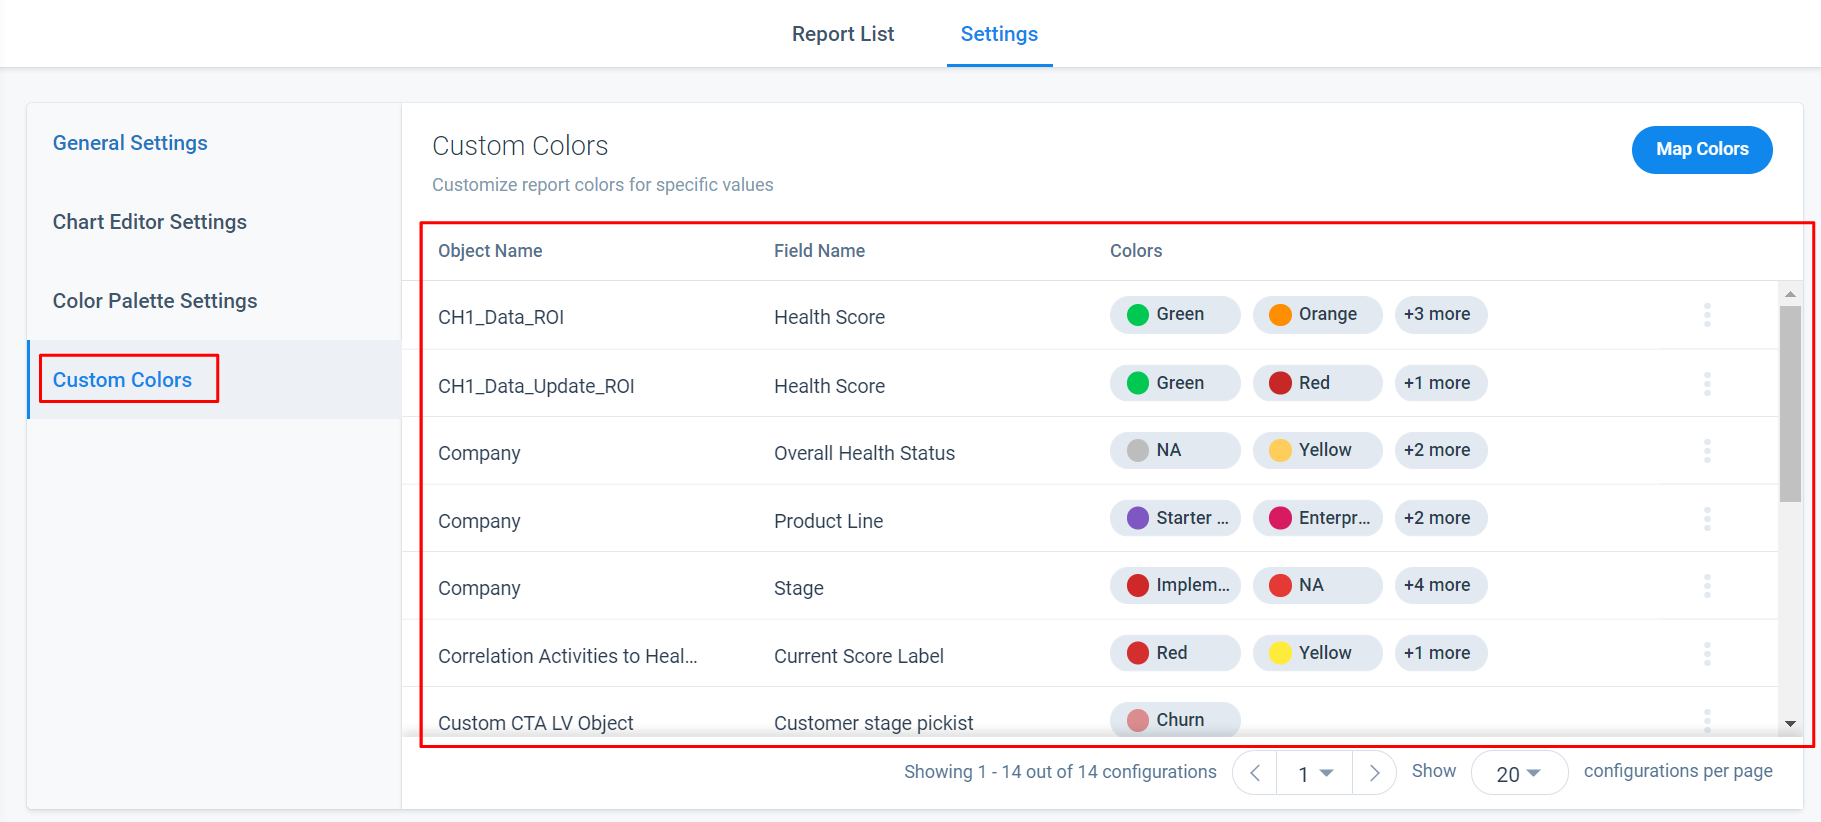
Custom Colors
Custom Colors allow admins to change the colors of the specific field values. Using Custom Colors, you can set colors for a specific field object under a source object.
The color palette defined in Gainsight Defaults does not understand data. There is always a meaning in the data and you might want colors to represent that data. For example, you want Risk CTA's to be shown in Red whereas Lifecycle CTA's in Blue. Leverage this custom colors option to add that meaning once, and it will reflect across all the reports which use the same field and value. For more information on how to configure Custom Colors, refer to the Color Setting in Reports article in the Additional Resources section at the end of this article.
Create or Edit Reports
Click Create Report to build a new report. To edit an existing report, click the report name of your choice from the reports list, and you will be navigated to the editing screen. For more information on how to create and edit reports, refer to the How to Build Basic Reports article in the Additional Resources section in this article.