Configure Dashboards
Gainsight NXT
This article explains how admins can set up new Dashboards on the Dashboard Builder page.
Overview
The Dashboard Builder feature allows admins to display custom dashboard pages with different sets of reports in a Dashboard, for different functions. For more information on how end users can use dashboards, refer to the Dashboards Overview article in the Additional Resources section at the end of this article.
Create and Configure Dashboard
To create a new Dashboard:
Navigate to Administration > Dashboard Builder > [click Create Dashboard]. The Dashboard Layout page appears.
The layout page has two sections:
- Adoption Explorer, Renewal Center, Reports, Scorecard Widgets and Standard Widgets pane
- Dashboard layout pane
Admins can add Reports, Adoption Explorer, Standard, and Scorecard Widgets into the Dashboard layout pane, edit, resize, reposition, and delete in the layout pane as required.
.jpg?revision=1)
Standard Widgets
Gainsight currently offers three Standard Widgets, which can be added to the Dashboard page.
-
Image Widget: Use this widget to upload images such as company logos, or display external shared dashboards or display screenshots of analysis or charts. The maximum size of the Image can be 5MB. The following formats can be uploaded:
- .jpeg
- .jpg
- .gif
- .png
- .bmp
- .svg
- .webp
- .ico
- Rich Text Widget: This is a fully customizable text widget. Use this widget to provide Section Headers or Accompanying Texts for the Dashboards.
- Web Page Widget: This widget can be used to embed any third party content such as YouTube videos, a publicly hosted document, a visual force page or any app that works with iframe.
Note: Not all websites can be embedded; some products actively block embedding.
Configure Image Widget
To configure Image Widget:
-
Drag and drop the Image Widget. The Image Widget configuration page appears.
-
Click the + icon in the middle of the preview window to add an image. A dialog box appears.
-
Navigate to the location of the image you want to upload and select the image.
-
The selected image appears in the preview window. Click the checkbox Fit to the box. This will break the aspect ratio and force fit the image to the size of the box.
-
Click Save.
-
Click Cancel, to exit and cancel all changes made in the Image Widget configuration page.
Configure Rich Text Widget
To configure Rich Text Widget:
-
Drag and drop the Rich Text Widget. The Rich Text Widget configuration page appears.
-
Type in the required information such as section header, summary or brief information on dashboards as needed.
-
Click Save.
Configure Web Page Widget
To configure Web Page Widget in a Dashboard:
-
Drag and drop the Web Page Widget. The Web Page Widget configuration page appears.
-
Enter the URL of the web page in the Please Enter The URL text box. The embedded content will load in the preview window.
-
Click Save.
Note: To embed Tableau Dashboards in Dashboard Builder, append the following text after the "?":
&:embed=y&:showVizHome=no&:embed=true
For more information, refer to Tableau's Embed Dashboards and Embedding Tableau Public Views in iFrame articles.
Report Widget
The Reports dropdown list displays all the Folders with the reports created in Report Builder.
Configure Report Widget
To configure Report in a Dashboard:
-
Click the Report dropdown.
-
From the Folder, access the required report.
-
Drag and drop the report from the left pane to the Layout pane. Once added, you can see that the metadata in the reports loads automatically. You can also perform the following actions if required.
-
Click on the report loaded to see the Drill-down Report.
-
Click the Pencil icon to edit the reports. You will navigate to the Report Builder page.
-
Click the Link icon on the report widget.
-
Paste the URL link in the Navigation URL text box.
-
Click Save. The Report Title is now linked to the URL.
-
Click the Report Title to navigate to the linked URL.
-
For more information on Reports and Folders, refer to the Reports List View article in the Additional Resources section at the end of this article and for more information on how to create a report, refer to the How to Build Basic Reports article in the Additional Resources section at the end of this article.
Scorecard Widgets
The Scorecard Widget dropdown displays all the Habit Reports and Mass Edit Reports created in Scorecards.
-
Habit Reports: A Scorecard Habits report allows you to review your customer’s health scores. This report displays score trends with reference to your configured grading scheme.
-
Mass Edit Reports: A Scorecard Mass Edit report allows users to view the health scores of multiple Companies or Relationships at once in a tabular format.
Configure Scorecard Widget
To configure Scorecard Widget in a Dashboard:
-
Click the Scorecard Widgets dropdown.
-
From the Habit Reports or Mass Edit Reports folder, access the required report.
-
Perform steps 3-6 from the Configure Report Widget section in this article.
For more information on how to create Scorecard widgets, refer to the Scorecard Widgets Overview article in the Additional Resources at the end of this article.
Adoption Explorer (Usage Reports in AE Layouts)
The Adoption Explorer dropdown list displays all the usage report widgets created in the Dashboard Settings page. For more information on how to create Adoption Explorer widgets, refer to the Dashboard List View and Settings article in the Additional Resources section at the end of this article.
Configure Adoption Explorer Widget
To configure Adoption Explorer Widget in a Dashboard:
-
Click the Adoption Explorer dropdown.
-
Drag and drop the widget from the left pane to the Layout pane.
-
Click Save Layout.
Note: You can also perform the following actions in the Preview mode if required.
-
From the Report dropdown in the widget, you can select the required usage report.
-
Click the All Usage Date dropdown to select the usage data timeframe.
-
Click the Enlarge button to view that Usage Section in an enlarged view.
-
Click Change Visualization to select the required visualization type.
-
Click the Context menu to Toggle Legends and to Export the widget data.
Renewal Center Widgets
The Renewal Center dropdown lists all the widgets available for Renewal Center. You can drag and drop the widgets onto the Dashboard Layout Pane. The selected widgets will be visible to the CSMs once the dashboard layout is saved.
You can choose from the following widgets:
- Renewal Metrics: It summarizes renewal metrics such as Renewal Forecast, Gross Renewals, Net Renewals etc. for quick reference.
- Renewal waterfall: Renewal Waterfall chart provides renewal-related insights falling within the selected time period, in a graphical format. The chart displays both the actual and forecasted values.
- Churn Chart: Churn data is displayed as a pie chart.
- Renewals Due By Health: Renewals Due By Health chart enables executives to understand renewals in the context of health and forecast category, especially where there is misalignment.
- Late Renewals: The Late Renewal chart gives a categorized view of the opportunities with Close Date after the renewal Due Date.
For more information on Renewal Center widgets, refer to the Renewal Center User Guide article.
My Portfolio Widget
This widget helps CSMs manage their accounts by listing all the Companies and Relationships at one place. Admins need to drag and drop the My Portfolio widget from the Standard Widgets section and add it to the layout while creating dashboards. You can show or hide the Company and Relationship tabs for end-users.
Note: This widget is also available while creating global filters for Dashboard.
To configure the My Portfolio widget:
- Drag and drop My Portfolio widget on the layout.
- Click the settings icon.
- Click the Company tab and activate the View Company Records toggle. If this toggle is not enabled, the Company tab will not be visible to CSMs on the My Portfolio widget.
- Click the Relationship tab and activate the View Relationship Records toggle. If this toggle is not enabled, the Relationship tab will not be visible to CSMs on the My Portfolio widget.
- Once the toggle(s) have been activated, you can use the search bar to look for the fields that have already been added to the Company or Relationship tab.
- To add new fields to the Company or Relationship tab, click Add Fields button on the Company/Relationship tab.
- Select the fields that you want to add.
- Click Apply.
- (Optional) To make any field editable, select the respective checkbox under the Editable column.
- (Optional) To remove any field, hover on the field. Click the delete icon that appears.
- Click Save.
Edit/Resize/Reposition/Delete
You can Edit, Resize, Reposition, and Delete the Reports and Widgets based on the requirement.
-
To edit the widget or report, click the Pencil icon. The respective widget/report configuration page appears.
-
To resize the widgets or reports, hold and drag the widget or reports at the bottom right corner. The widgets and reports are responsive in nature, hence you can resize and simultaneously view the data adapt to the size.
-
To reposition the widget or report after adding it to the layout pane, hold and drag the widget anywhere within the layout pane.
-
To delete the widget or report, click the Trash icon.
Limitation: Dashboards can currently display up to 30 widgets.
Additional Functions
After adding the required Widgets and Reports, the following additional functions can be performed in the Dashboard configuration page.
![Additional [2].png](https://support.gainsight.com/@api/deki/files/18453/Additional_%255B2%255D.png?revision=1)
-
Undo and Redo: Allows you to undo and redo any action/change performed while configuring the dashboard. You can perform up to five undo operations.
- Auto Arrange: Helps you to automatically arrange the widgets in the layout pane by reducing the spaces between widgets.
-
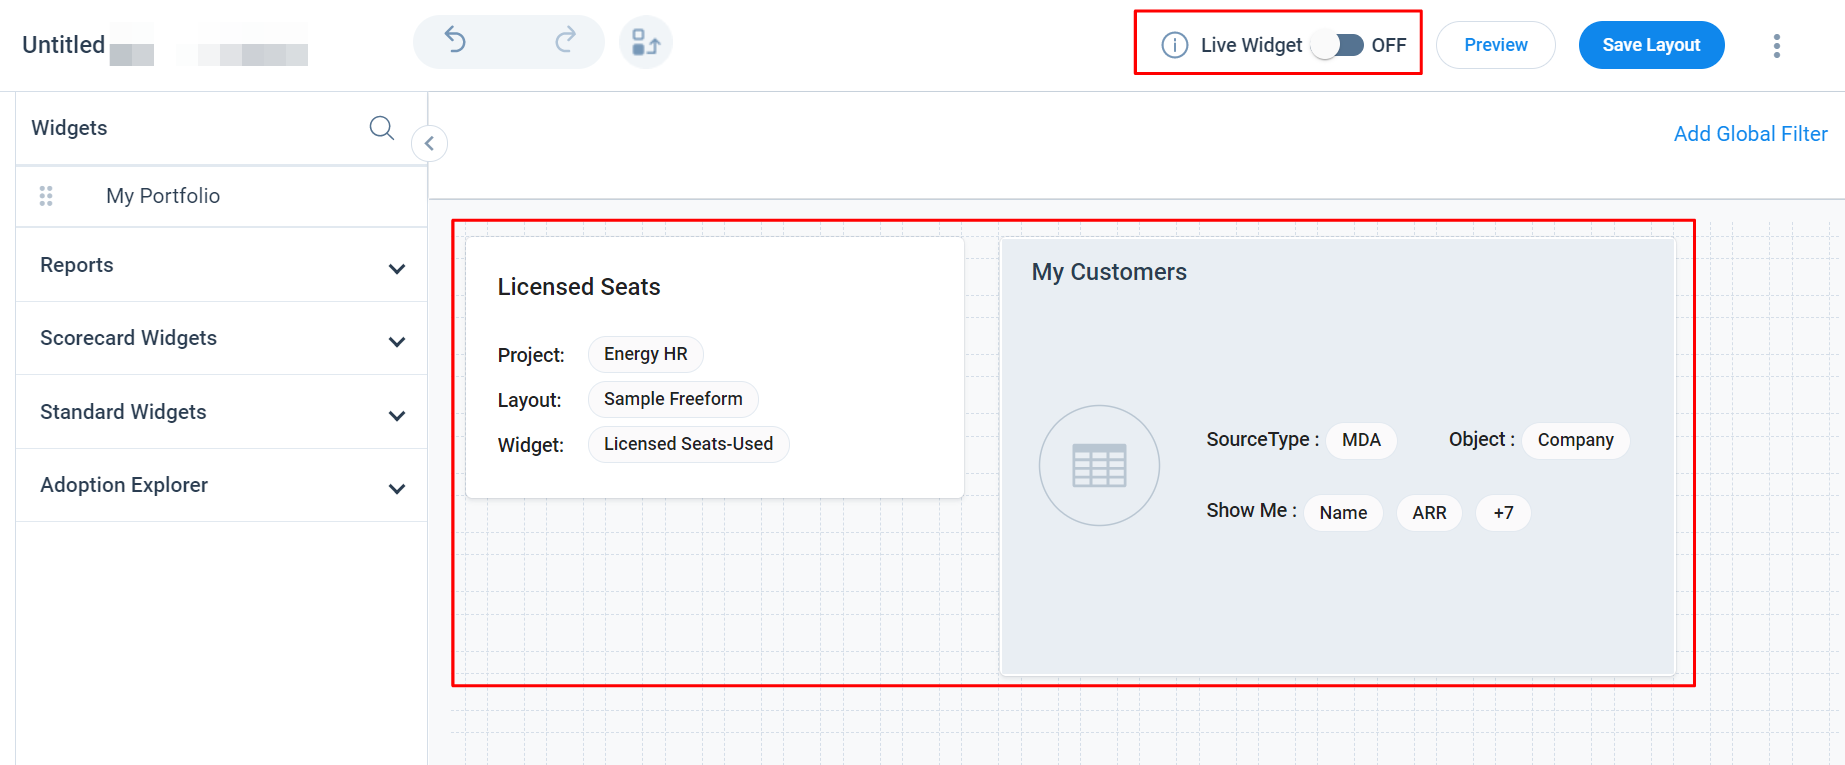
Live Widget: The rendering of the widgets can be Turned On or Off by toggling the Live Widget button. When the widget rendering is Off, the following details are displayed in the widgets.
- Web Page Widget: The linked URL is displayed.
- Reports: Following details on the widget are displayed:
- Source Type: MDA or Salesforce.
- Object: Source object added in the Report Configuration stage.
- Show Me: Fields such as ARR, MRR, Name or other such fields added in the Report configuration stage.
- Group By: Fields such as Stage, or Industry or other such fields added in the Report Configuration stage.
-
Usage Reports: Following details on the widget are displayed:
-
Project: Name of the Adoption Explorer project .
-
Layout: Name of the layout.
-
Widget: Name of the widget.
-
Note: Turning the widget rendering off in the configuration page, does not affect the Dashboard display in the Dashboard page.
-
Preview: Click the Preview icon. The Preview page displays the three different resolutions (Tablet, Laptop and Monitor) for viewing the dashboards. Click Back to Layout Builder to navigate back to the dashboard layout page.
Note: Preview is enabled only when the dashboard layout is Saved. -
Click Save Layout. If there are any empty spaces in the layout, it allows you to Save As Is (saves the layout with spaces) or Adjust and Save (auto adjust the spaces). If there are no empty spaces in the layout, the Save Dashboard page appears.
-
Dashboard Name: Enter the name of the dashboard in the Dashboard Name text box.
-
Select Folder: By Default, Uncategorized folder is selected.
Note: Alternatively, you can select a specific folder to save by selecting the list of Folders from the Select Folder dropdown list. -
Description (optional): Enter the Description of the dashboard as required.
- Click SAVE.
-
-
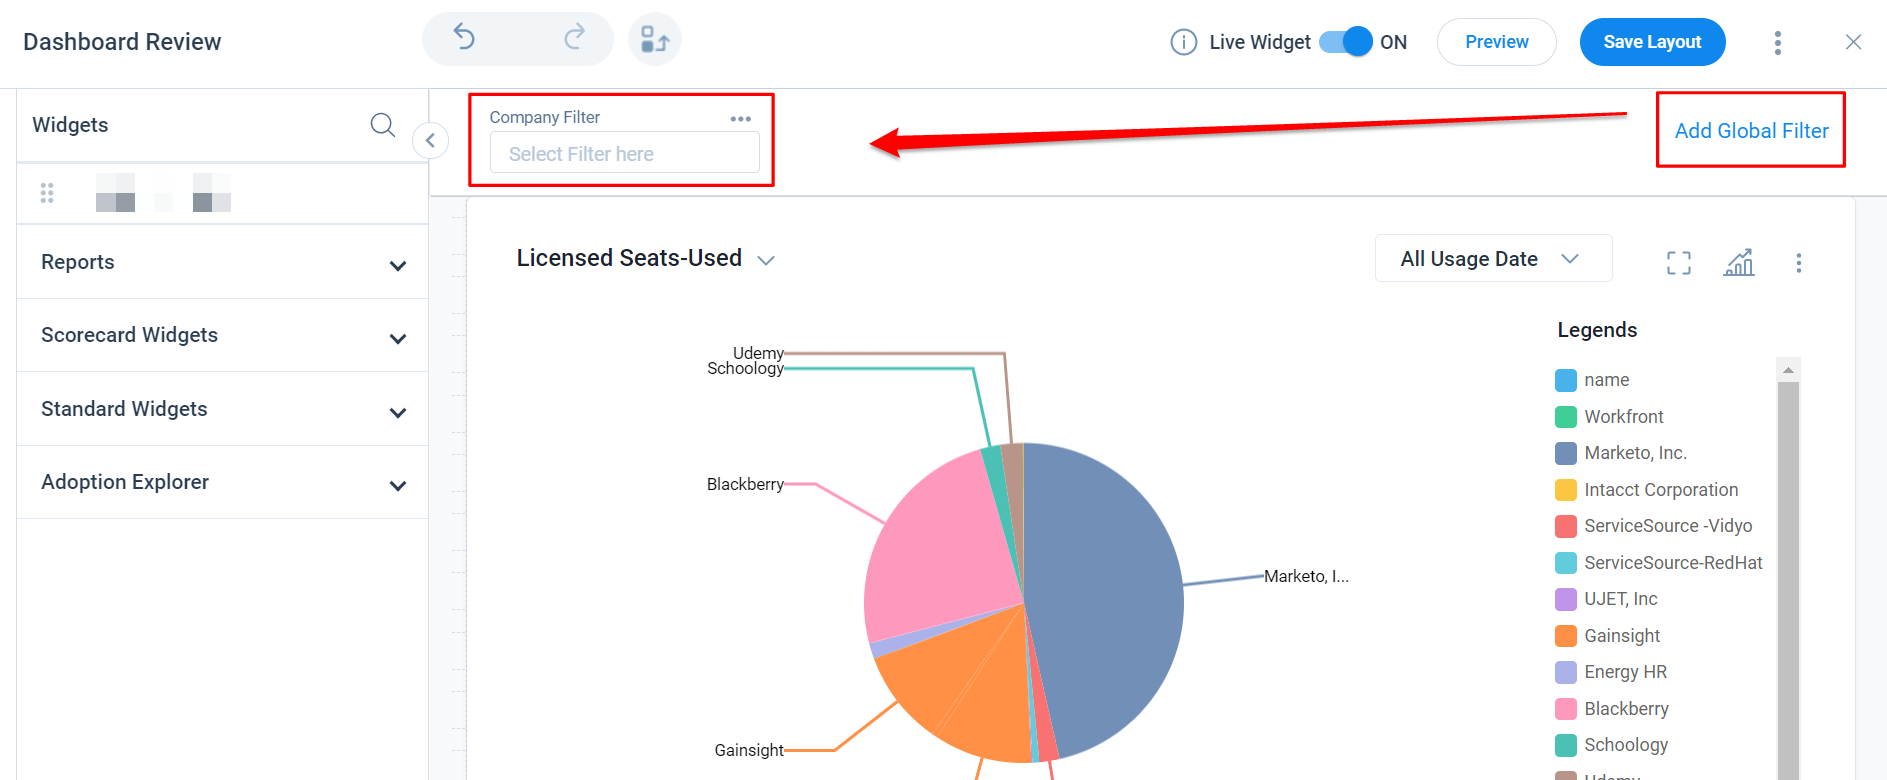
Add Global Filter: Global dashboard filters can be used on the Dashboard tab. Filters can be applied to one or more reports on a dashboard. For more information on how to add a global filter, refer to the Global Filter for Dashboards article in the Additional Resources section at the end of this article.
-
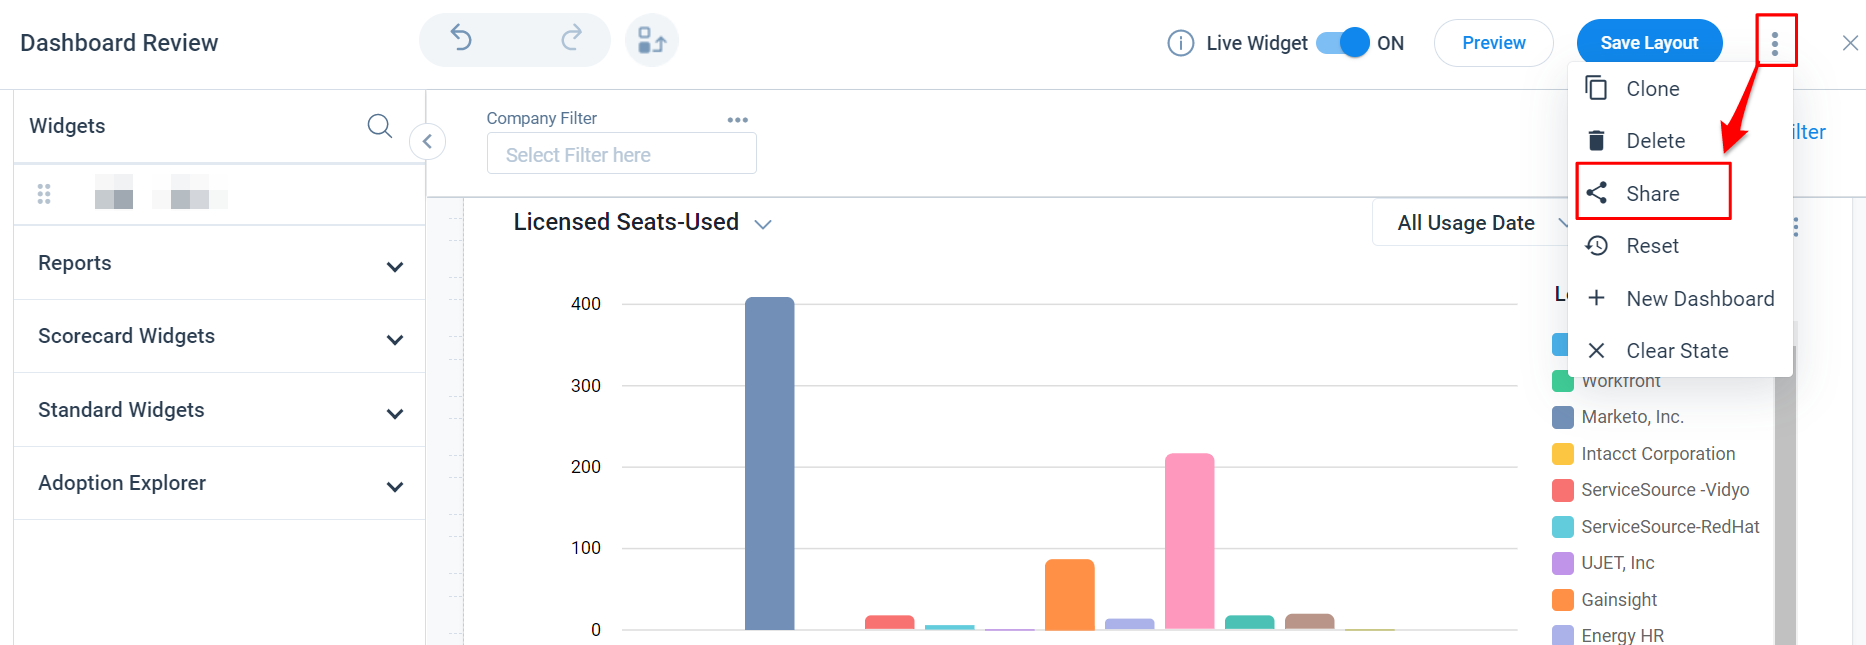
Context Menu: The Context menu is enabled only when the dashboard layout is saved. Perform the following functions using the Context menu:
- Clone: To duplicate the existing dashboard layout, click Clone. The Save Dashboard window appears. Repeat the steps above to save the dashboard.
- Delete: Click Delete, to delete the existing dashboard layout.
- Share: To share the Dashboard, click Share. The Share Dashboard page appears. For more information on how to share a dashboard Configure Dashboards for Sharing article in the Additional Resources section at the end of this article.
- + New Dashboard: Click + New Dashboard, to create a new Dashboard.
- Clear State: Click Clear State to clear the state preservation for all users of the present dashboard.
Click the X icon next to the Context menu to return to the Dashboard Builder page. You can see the recently created dashboard in the Dashboard List pane.
Global Filters
Admins can set up global dashboard filters for using them on the Dashboard tab. In order to set-up a dashboard level filter, every report in a dashboard must be built in Report Builder. These filters can be applied to one or more reports on a dashboard. The reports can be built on different objects. This functionality reduces the number of filters required on each report on a dashboard, which in-turn reduces the number of dashboards required for each team, member, or reason. For more information on Global Filters, refer to the Global Filter for Dashboards article in the Additional Resources section at the end of this article.
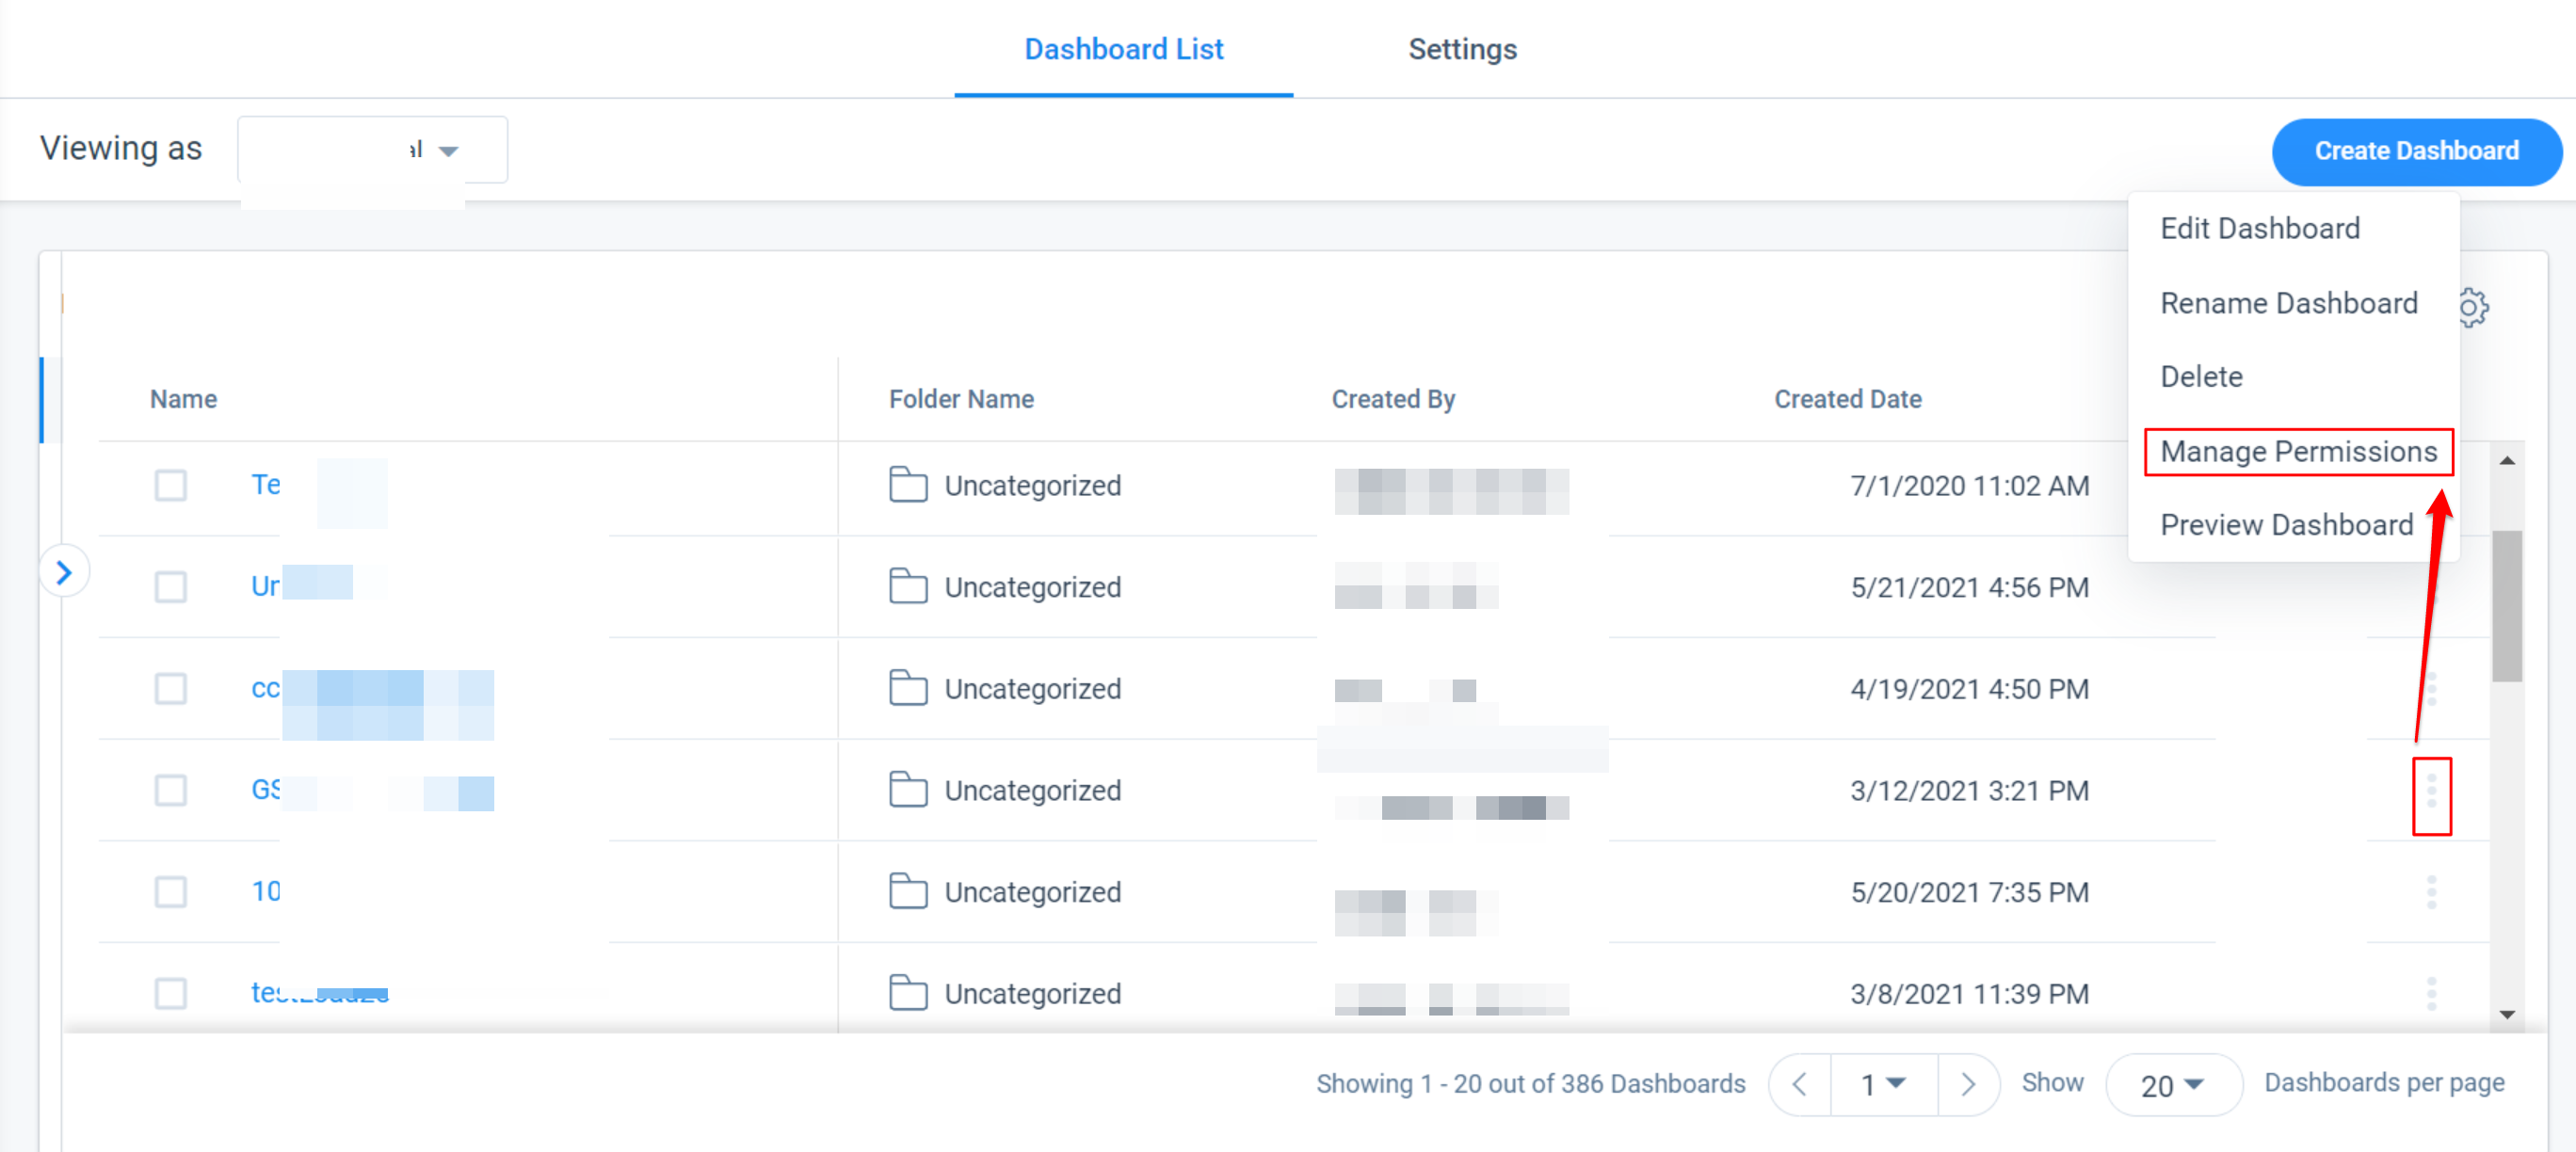
Dashboard Permissions
Admins can restrict a user/group of users from accessing a single or set of dashboards using the Dashboard Permissions. Admins can also provide limited access to the Report Builder and control the privacy of all new assets being created. The Dashboard Permissions are defined in such a way that end users must have the required permission to access data from Dashboards. For more information on how to enable and assign permissions to dashboards, refer to the Dashboard Permissions article in the Additional Resources section at the end of this article.
Sharing Dashboards
If you check your Gainsight dashboard(s) frequently, or if you want to send the dashboard to your colleagues and managers, we recommend using Gainsight’s Share Dashboard functionality. This functionality helps you send a dashboard as a PowerPoint presentation, attached in an email, or as a link in an email, on a specific schedule. (End users can also send internal Gainsight users dashboards via email from the Dashboard tab.