Data Designer Overview
Gainsight NXT
Overview
Data Designer makes it easier for you to discover richer, more meaningful insights from your customer data. It provides a simple, easy-to-use solution to merge and transform your data, then make it accessible across the Gainsight platform for further analysis and exploration.
Gainsight Reporting allows you to build reports and analyze the data available in one particular object. But, the data within Gainsight is distributed across various applications like: Timeline, Success Plans, and Cockpit etc. (or) the data you might want to analyze and report on may not come from Gainsight. In order to derive the most meaningful insights, you need to merge the data from these various data sources. Data Designer gives you the tools to do this, helping you merge and transform data from these disparate data sources to create a Dataset for your further analysis.
Once a Dataset is created in Data Designer, you can explore and analyze the data to see if it’s valuable, and then make it permanent and universally available across Gainsight. Once a dataset is permanent, it is saved as a Dataspace under MDA data source. You can then use this Data Space in other functionalities of Gainsight like, Reporting, Rules, and Journey Orchestrator (JO).
Training Resources
If you're new to Gainsight administration, we strongly encourage you to complete our free web-based training, and then to sign-up for live instructor-led sessions. In the live sessions, you'll have opportunities to hear best practices, tips and tricks for troubleshooting, and to complete practice exercises in a training org.
Business Use Cases
-
Insights in Data across your IT Applications: You might be using 10 different applications across your IT ecosystem. The data generated by each of those applications by itself might answer a few questions but the real insights are derived when you can merge the data from these applications together. For instance,
- Your cases data might give real insights when you correlate with usage adoption and health score data. For instance, you might want to know if the customers who are raising support tickets are actually using the product correctly or not, and you might also want to know if those customers have good health scores when compared to other customers who are not raising support tickets.
- Your training data might give real insights when you correlate with adoption and cases(Support) data.
-
Cross feature Reporting in Gainsight: Data in Gainsight is generated across different applications, like: Timeline, Success Plan, Cockpit, and Journey Orchestrator (JO), etc., and so the insights are distributed across all of these applications. The real and powerful insights can be derived only when you merge data from all these applications. For instance,
- You may want to report on the CTA details with Timeline entries associated with that CTA. To achieve this use case, you can merge Timeline and Call to Action Objects.
- You may want to know if the customers who have more touchpoints (more Timeline entries) are healthier than average.
-
Absence of Data Reporting:
-
For instance, you might want to know the Accounts without CTA’s in the past 6 months. You can merge Call to Action and Account object and then report on the newly created Data Space.
-
As a CSM Manager, you might be handling multiple customers, and may want to know which customers you have not met (no Timeline entries) this quarter.
-
Note: Reports from Data Designer objects in GS Home do not support filtering. However, users can use the company and relationships filters as solution.
Benefits of Using Data Designer
The following are the benefits of using Data Designer:
- You can make faster business decisions based on a holistic view of all the insights derived from different application objects.
- You can link two unrelated objects/different application objects and correlate with each other. For example, Call to Action and Timeline objects, Company and Case objects, etc.
- You can build a Dataset on MDA and Salesforce objects. You can also build datasets using the external data available in Amazon S3 buckets (Gainsight managed or Custom buckets).
- Data Designer can be used to reduce the object and field level complexity of reporting or rule by shortlisting the fields from all fields in objects to only the ones required.
Data Designer Details
To access Data Designer, navigate to Administration > Data Designer, here two tabs are available:
- Design
- Template
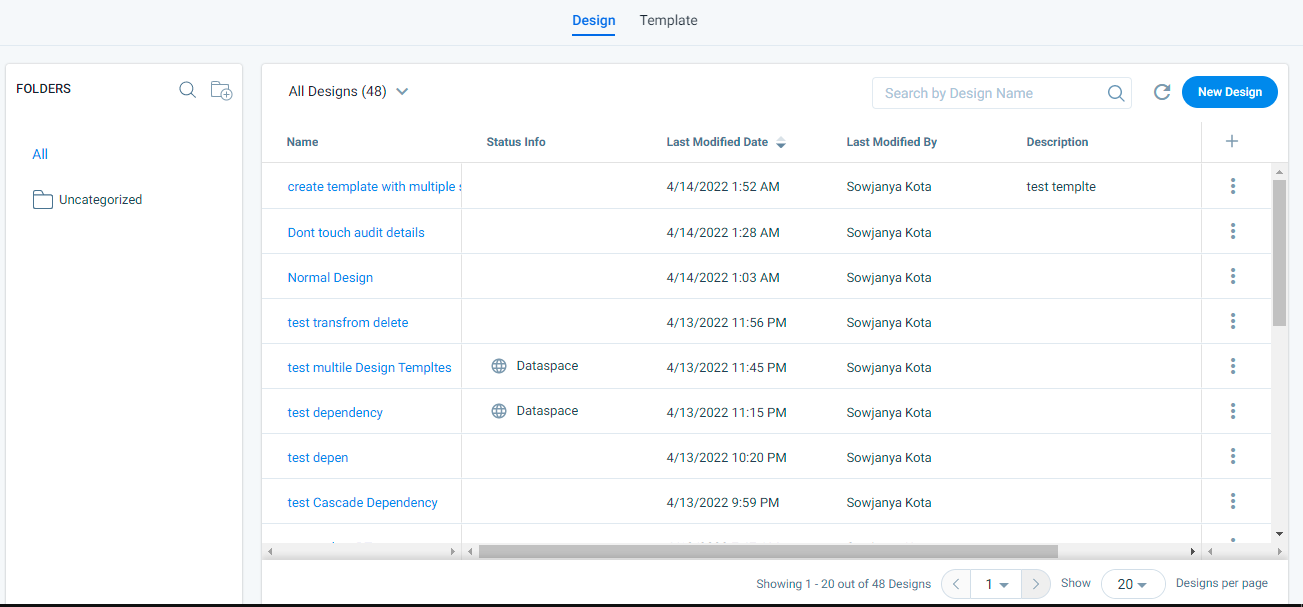
Design List Page
You can see the following options on the Design list page:
-
Designs Listing Page and Options: The options in the Designs listing page are categorized into 3 sections, namely: FOLDERS, All Designs and Settings, and Pagination.
-
New Design: Clicking New Design will navigate you to the Create Recipe page, where you can create a new Dataset. Creation of Dataset in Data Designer includes the following steps:
- Details
- Preparation
- Explore
- Configure
The following flow chart represents the process/multiple steps involved in the creation of a Data Design.
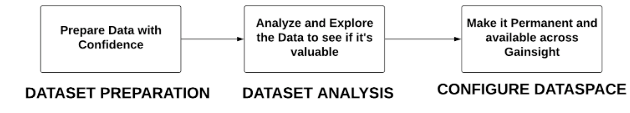
Preparation: Data Designer enables admins to prepare data with confidence. For instance, if you are looking for insights like Correlation in the prepared data, and if you think this insight is not available in the prepared data, you can discard the dataset and create a new one.
In the preparation step, you can merge two different objects and create a Dataset. If required, you can Transform a dataset to apply Filters, Formulas, Case Expressions, etc.
Note: If the data you want to analyze is not from Gainsight, you can make use of custom objects in Gainsight to load your data from external sources or if your data is available in Amazon S3 buckets (Gainsight managed or Custom buckets), you can create datasets using this data.
For information on how to use data from S3 in Data Designer, refer to the Use S3 Data in Data Designer article.
Explore: In this step, you can explore and analyze the prepared data to see if it’s valuable or not. During your analysis on the prepared dataset, if required, you can apply Filters, Formulas, modify aggregations, change visualizations, etc.
Configure: After your analysis, if you think that the dataset has some real value, then you can make it permanent and universal. Once a dataset is permanent, it is saved as a Data Space under MDA, and is available for use in other functionalities of Gainsight like, Reporting, Rules, and Journey Orchestrator (JO).
For detailed instructions on how to create a Dataset in Data Designer, refer to the Create Datasets in Data Designer article.
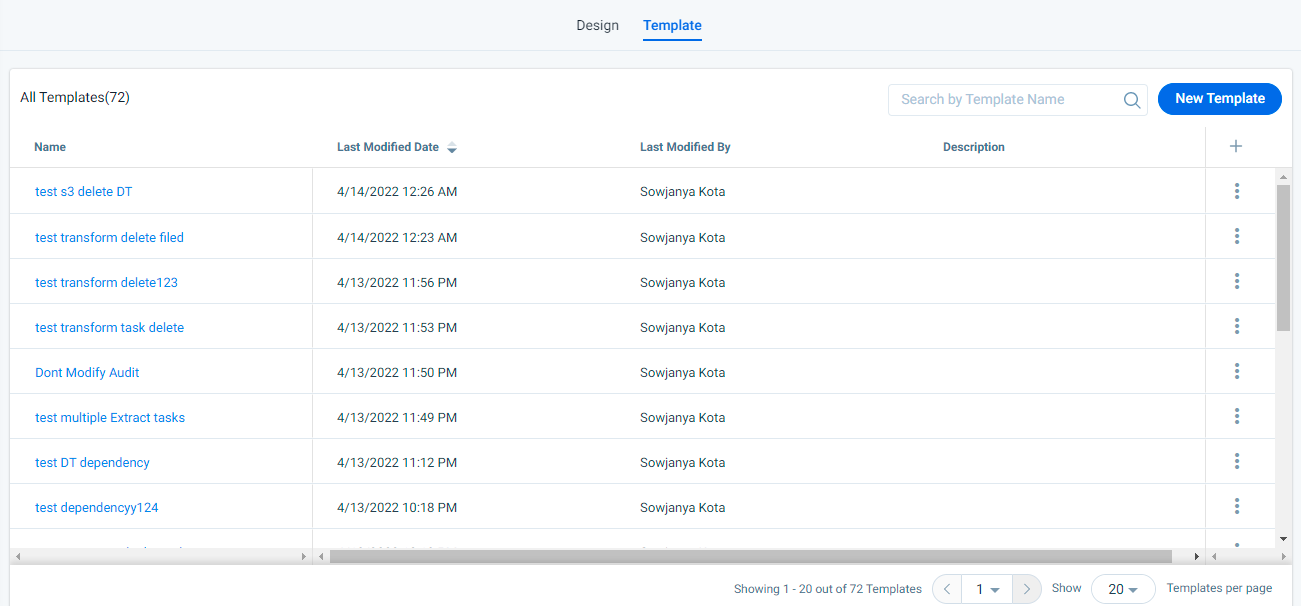
Design Template
The Template page displays list of all available Design Templates. Users can also create new Design Templates from this page.
For more information on how to create New templates, refer to Use Design Templates in Data Designer article.
Additional Resources
- For information on the Designs Listing page and Options, refer to the Designs Listing Page and Options article.
- For information on the Functionality Details in Preparation tab, refer to the Preparation Details in Data Designer article.
- For information on the Functionality Details in Explore tab, refer to the Explore Details in Data Designer article.
- For information on how to use data from S3 in Data Designer, refer to the Use S3 Data in Data Designer article.
- For information on the most frequently asked questions on Data Designer, refer to the Data Designer FAQs article.