Adoption Summary Dashbaord
This article provides Admins and CSMs an overview of the out-of-the-box (OOTB) Adoption Summary dashboard.
Overview
The Adoption Summary dashboard provides comprehensive insights by consolidating data from the Adoption Tracker. These dashboards empower Customer Success Managers (CSMs) with product and feature adoption insights that can be used to plan the next steps using Journey Orchestrator (JO) programs or Scorecards.
To enable the Adoption Summary dashboards, admins must set up the Adoption Tracker on their Gainsight Customer Success (CS) instance.
For more information on how to set up the Adoption Tracker, refer to the Adoption Tracker article.
| IMPORTANT: Adoption Tracker is available as a paid add-on feature. For more pricing information, Gainsight recommends contacting your Gainsight Account Manager. |
|---|
Adoption Summary Dashboard
The Adoption Summary dashboard is read-only. However, Admins or CSMs can clone the dashboard and modify it as needed.
Clone and modify the dashboard in Administration > Dashboard Builder.

For more information on the configuration of a dashboard, refer to the Configure Dashboards article.
Reports In Adoption Summary
The Adoption Summary dashboard offers 10 out-of-the-box widgets. Each widget, powered by a respective report, is designed to give product and feature adoption insights from the data being tracked.
- Total Tracked Users
- Weekly Active Users By Product
- Weekly New Users By Product
- Weekly Inactive Users By Product
- Inactive Users On Mapped Features
- Login Users Trend
- % Change In Active Users By Time Period
- Tracked Users In A Time Period
- Top 10 Features
- Bottom 10 Features
CSMs can view the reports as an overview or click on any report to view the detailed information.
Total Tracked Users
The Total Tracked Users is a Key Performance Indicator (KPI) report that shows the total number of users being tracked on your product. The drill-down report provides detailed information on the user.

Weekly Active Users By Product
The Weekly Active Users By Product report displays the number of users who have actively engaged with your product within a specific week. The report is segmented by product, allowing you to understand the active usage per product.

Weekly New Users By Product
The Weekly New Users By Product report highlights the number of new users who have accessed your product within a specific week. This report is categorized by product, helping you evaluate the effectiveness of product adoption.

Weekly Inactive Users By Product
The Weekly Inactive Users By Product report identifies users who did not interact with your product within a specific week. The data is grouped by product, making it easier to target re-engagement strategies.

Inactive Users On Mapped Features
The Inactive Users on Mapped Features report shows the number of users who did not interact with any of the mapped features of your product. Use this report to pinpoint underutilized features and strategize improvements to increase engagement.

Login Users Trend
The Login Users Trend report displays weekly login activity over time. It helps identify and track how frequently users access your product and essentially provides product adoption insights.

% Change In Active Users By Time Period
The % Change In Active Users By Time Period report shows the percentage increase or decrease in active users over a specific time period. This report helps you track active usage trends and evaluate the impact of recent product changes, engagement programs/events and any observed anomalies.

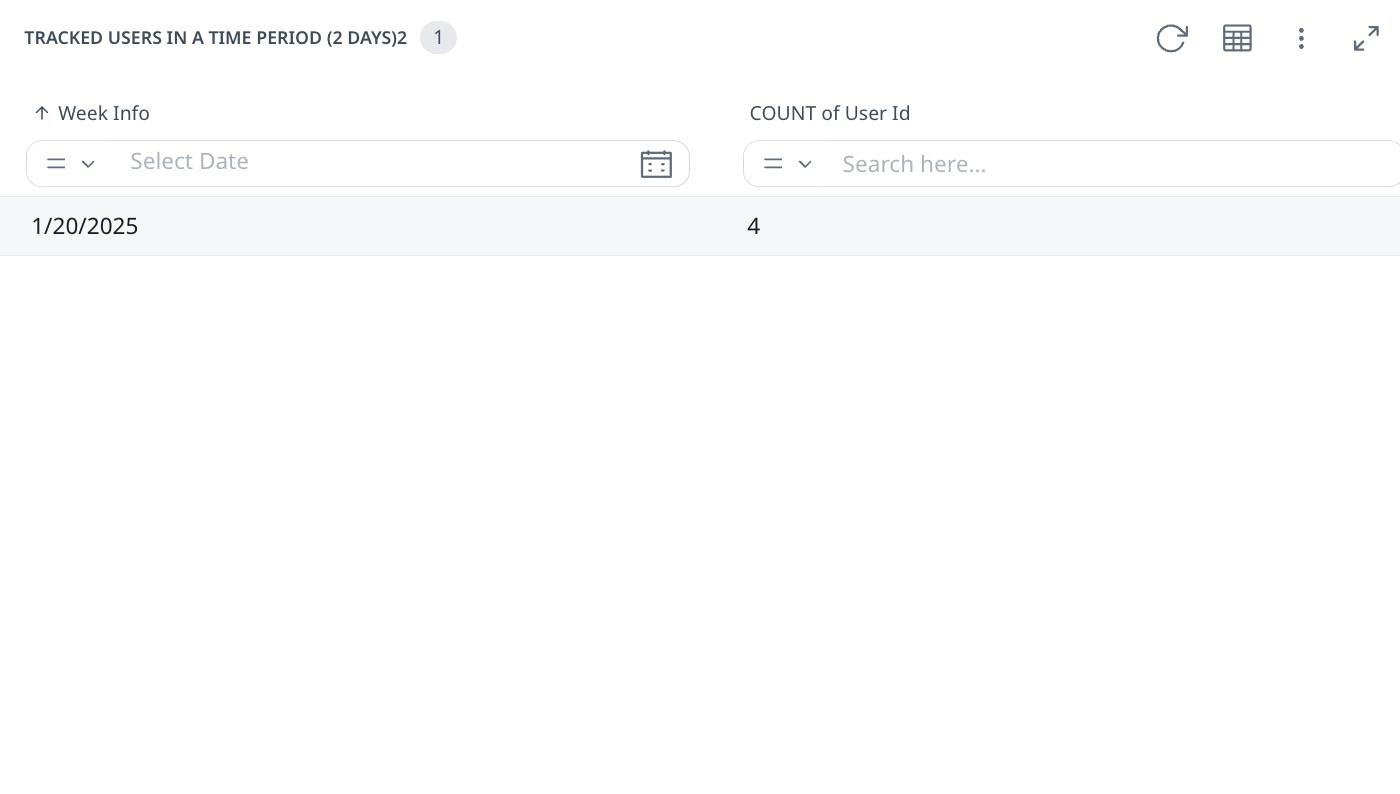
Tracked Users In A Time Period
The Tracked Users in a Time Period report provides a snapshot of users who were last active within the past two days( time period of two days can be modified in filters). This report allows you to monitor users in recent timeframes.
Top 10 Features
The Top 10 Features report lists the most-used 10 features of your product in descending order. It provides an overview of usage count, highlighting which functionalities are most accessed by the users.

Bottom 10 Features
The Bottom 10 Features report identifies the least-used 10 features in your product. This information helps you understand areas of low user engagement and evaluate how to improve these features.
