Analyze NPS Results
This article explains how to view, analyze and export results from your NPS® survey engagements.
Overview
The power of Net Promoter Score® (NPS®) is not in the feature itself but in how you use it. NPS® is a signal and should be measured over-time. Since it’s an indicator of customer loyalty and satisfaction, detractor scores should be used as a flag to trigger further investigation. More important learnings come from the qualitative feedback your customers provide as well as speaking directly with a sample of customers among the promoter and detractor groups. For organizations that serve multiple customer segments and/or have multiple user personas, it’s important to analyze and understand how each of those groups respond. Promoters can also be contacted potentially for case studies, as references, to write blogs, participate in pilot programs, and so on.
You can review NPS® at the user or account level including histogram analysis as well as trends. You can also apply and measure NPS® based on different cohorts. You can also measure feature adoption or engaged users based on their NPS® responses.
How to Analyze Your NPS® Results
How do you know whether your NPS® is good or not? When you send out your NPS® survey campaign, the NPS® results can be used as a baseline for improvement. You must focus on your customer’s feedback and improving your NPS® over time.
In NPS®, respondents are categorized based on the answers in the following three groups:
- Detractors: 0 - 6
- Passives: 7 - 8
- Promoters: 9 - 10
NPS® scores are calculated by taking the percentage of respondents who are promoters and subtracting the percentage of respondents that are detractors [NPS = %promoters - %detractors], generating score ranging from -100 to 100
For example:
- NPS = 100 (% promoters) - 0 (% detractors) = 100
- NPS = 86 (% promoters) - 14 (% detractors) = 72
- NPS = 0 (% promoters) - 100 (% detractors) = -100
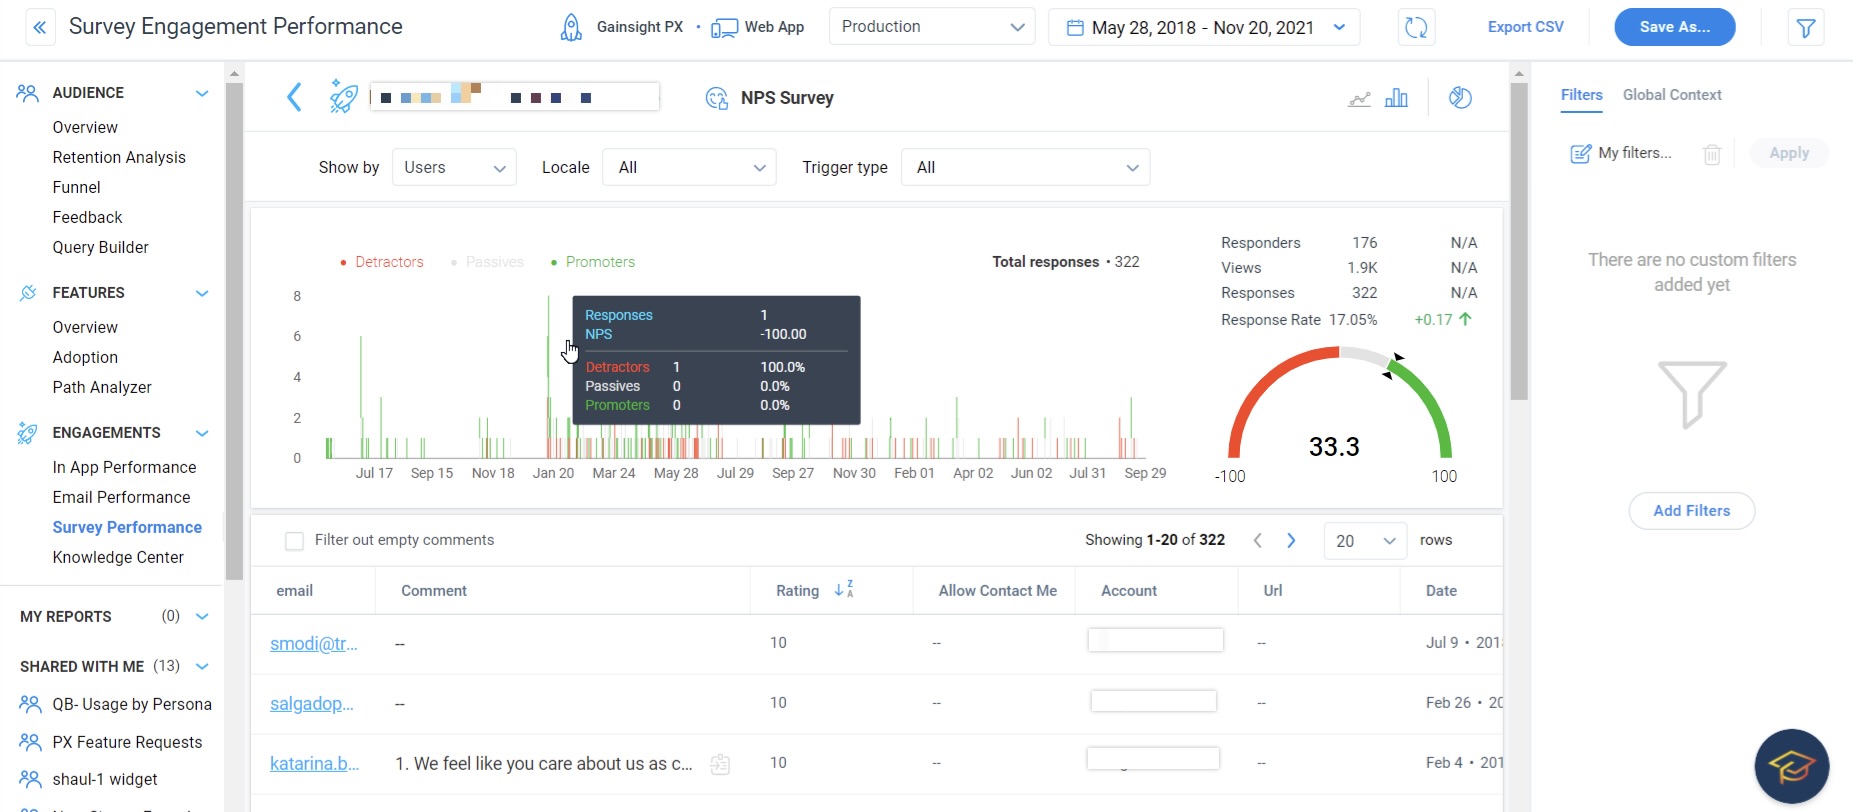
View your NPS® Results
You can view NPS® results by filtering with three types of categories.
- Accounts: When you select Accounts in the Show by field, the average scores across all accounts is shown.
- Users: When you select Users in the Show by field, individual measures of all the users is shown.
- Overview: When you select Overview in the Show by field, a graphical representation of all Responses by rating, Daily responses, and NPS® trend is shown.
Following image shows the results of a NPS® survey filtered by Users category.
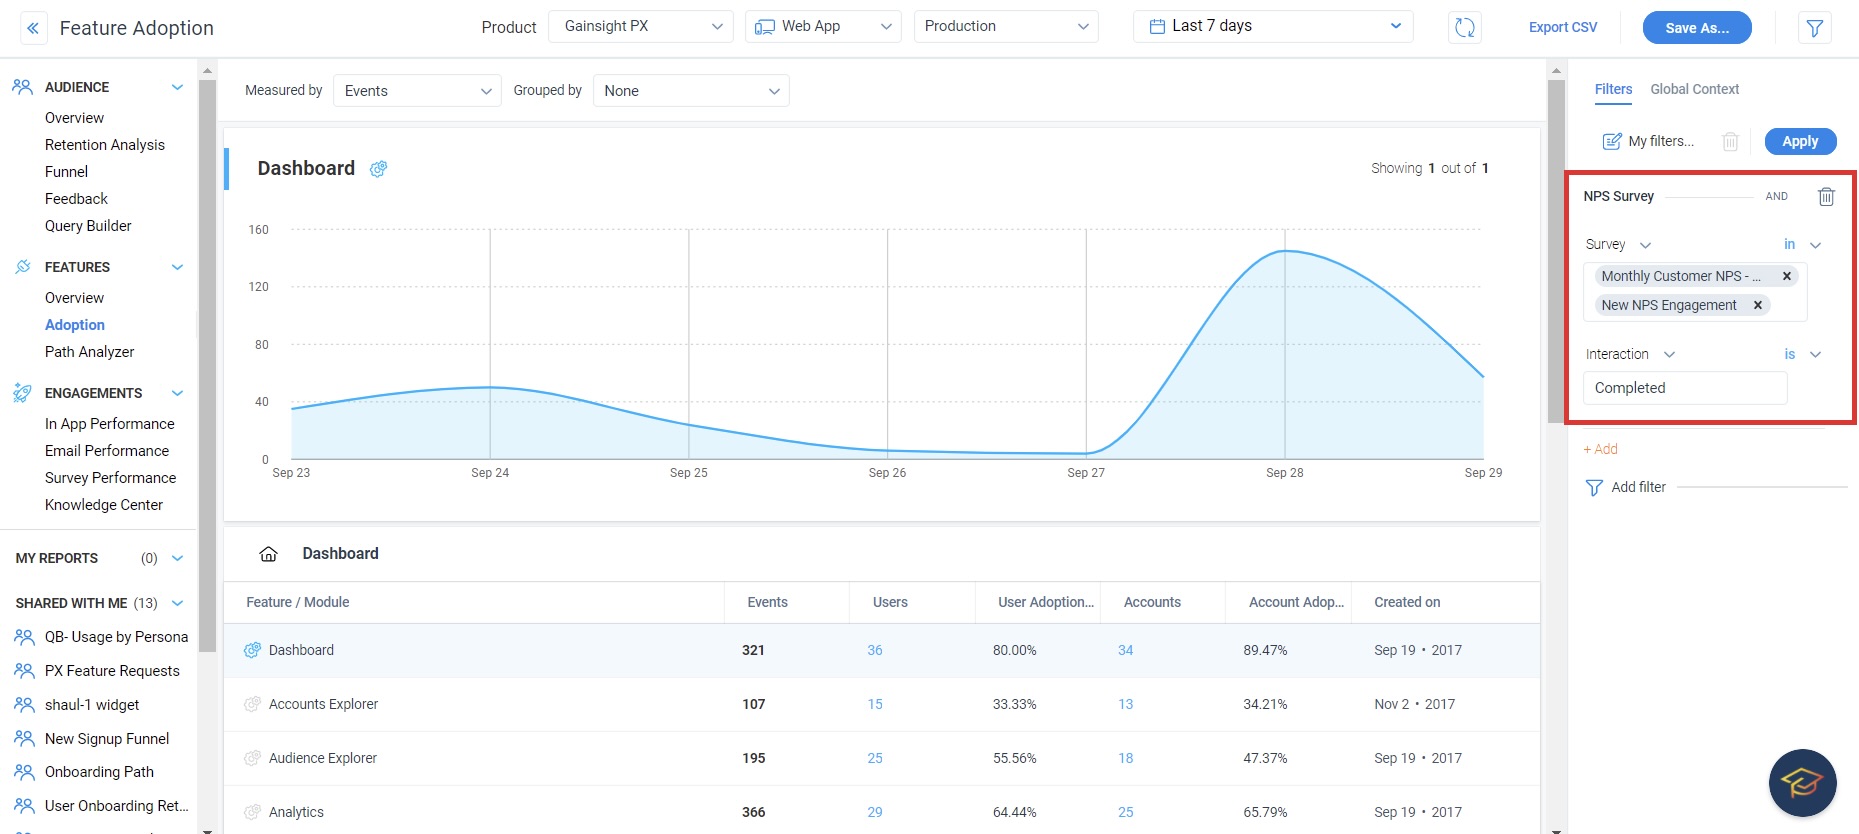
Adoption Analysis Report using NPS® Surveys filter
The NPS® dashboard automatically calculates and graphs your NPS® responses for each NPS® survey you have sent—providing you with a quick snapshot of your NPS® results.
However, you can dive deeper into your results and perform more meaningful analysis with insights. You can also build custom reports that slice and dice your NPS® results against any data point you track in Zendesk Support.
To generate adoption analysis report using the NPS® Survey filter:
- Navigate to Analytics.
- Click Adoption in the Features section.
- Click Add Filters on the Filters tab in the sidebar.
- Select the NPS® Survey option from the Custom Filters pop up.
- Select the surveys in the Survey field.
- Select Interaction, Score or the Score Type NPS® Survey attribute and the operator.
- Enter or select the appropriate value.
- Click Apply. The list of surveys is displayed.
- Click Export CSV on the top right corner next to the Bookmarks button. A CSV file is generated for you to download.
- Click Save As to save the report and view it in the My Reports section on the left panel.
NPS® Responses by Rating
Here is an example of a custom report you can build to showcase your NPS® responses by rating, so you can visualize the spread of customer responses. If you want to drill in on a specific score, you can export all your NPS® responses into a CSV file, then filter for the specific responses you’re looking for. For example, you might want to perform further analysis on customers who gave you a score of 8 and learn what you can do to boost their score to a 9.
Using the exported CSV file, you can either read through all the customer comments or use a text analysis tool to sort through their feedback.
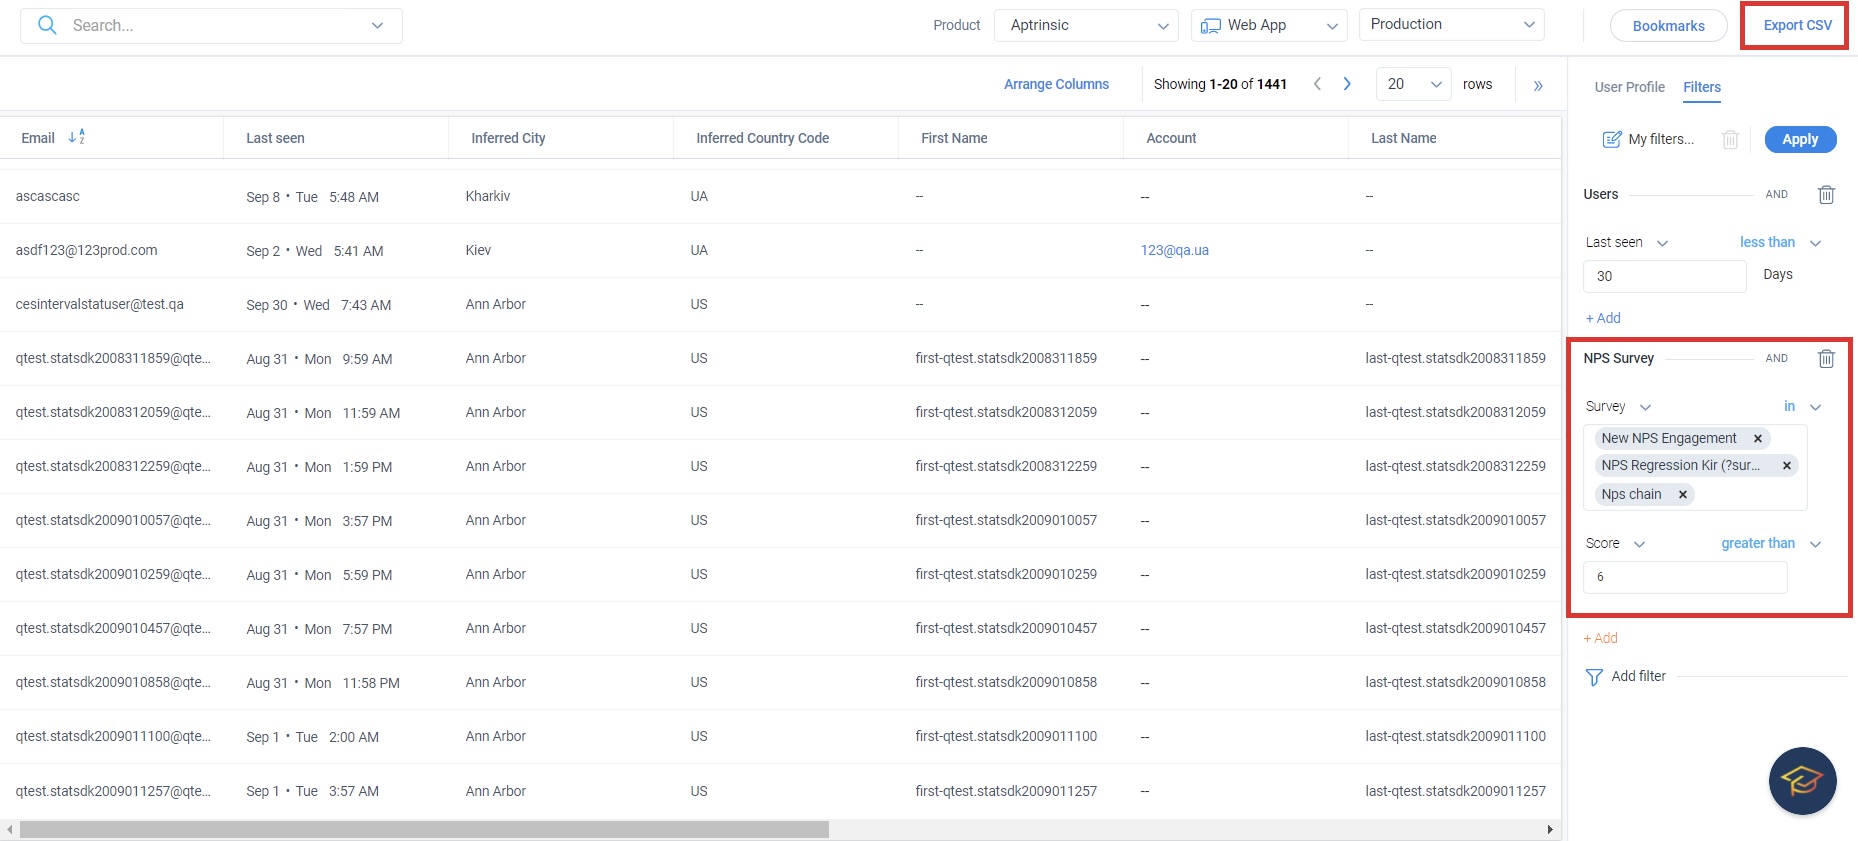
Export NPS® Analytics
An overall score is derived from the NPS® survey results. Based on your NPS® survey results, you can determine next steps to improve the health of your business, and to strengthen your relationship with your customers.
You can export your survey responses to a CSV file for further analysis. To download a CSV file of NPS® survey responses:
- From the left pane, click Audience Explorer.
- Click Add Filters on the Filters tab in the sidebar.
- Select the NPS® Survey option from the Custom Filters pop up.
- Select the surveys you want to export to CSV.
- Select Interaction, Score or the Score Type NPS® Survey attribute and the operator.
- Enter or select the appropriate value.
- Click Apply. The list of surveys is displayed.
- Click the Export CSV button on the top right corner next to the Bookmarks button. A CSV file is generated for you to download.
To learn about all frequently asked questions, refer to the Surveys FAQs article from the Additional Resources section.
Additional Resources
| Surveys FAQs |
| Net Promoter®, NPS®, NPS Prism®, and the NPS-related emoticons are registered trademarks of Bain & Company, Inc., NICE Systems, Inc., and Fred Reichheld. Net Promoter ScoreSM and Net Promoter SystemSM are service marks of Bain & Company, Inc., NICE Systems, Inc., and Fred Reichheld. |