Query Builder
This article explains how to configure and use the Query Builder analytics feature for your application.
Overview
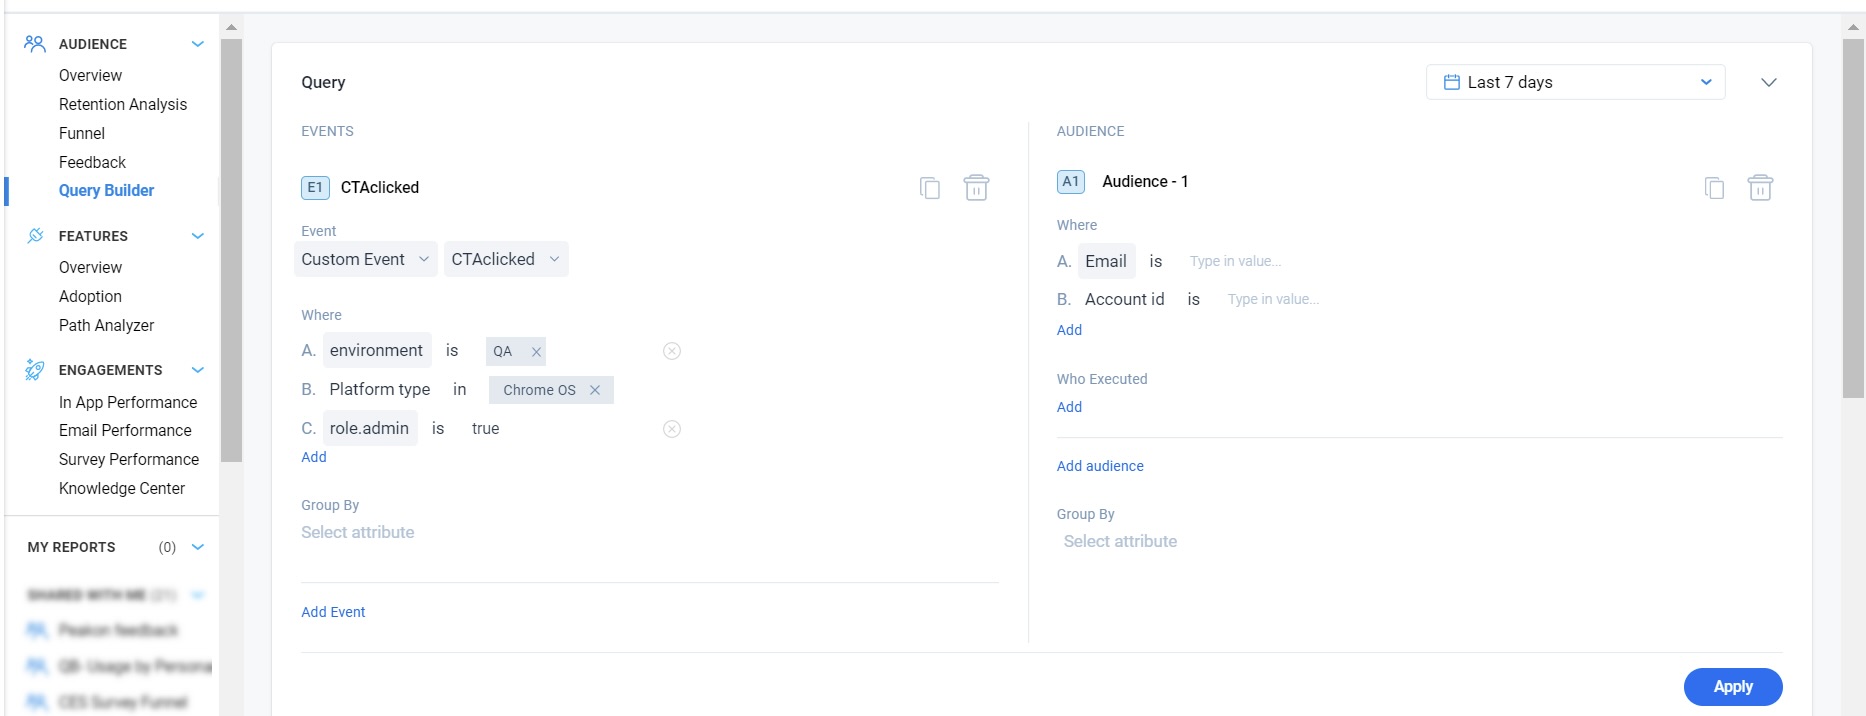
Query Builder in Gainsight PX enables you to analyze product usage and user behavior by creating custom queries without the need for a query language. It provides a flexible way to explore data, compare user segments, and derive insights based on events, attributes, and engagement interactions.
You can use Query Builder to investigate how users interact with your product, validate hypotheses, and measure the impact of features or engagements. It allows you to combine events and audience conditions, group results across multiple attributes, and drill down into underlying user or account data for deeper analysis.
Example Use Cases
- Measure product and feature adoption: Analyze metrics such as feature usage, active users, or event trends over time.
- Compare audience behavior: Evaluate how different user or account segments interact with features, engagements, or events.
- Create custom business metrics: Combine multiple metrics using aggregation functions and formulas to calculate organization-specific KPIs.
To create a Query Builder report:
- From the main menu, navigate to Analytics > AUDIENCE > Query Builder. The Query Builder page appears, with all previously created reports listed.
- Click Create Report. The following two methods are available to create reports:
- Metric: Create reports using prebuilt or custom metrics. You can create custom metrics by aggregating on custom event properties, user attributes, or account attributes, and combine those metrics to build more complex aggregate metrics.
- Cohort: Track events and compare behaviors across different groups of users or accounts.

Metric
The Metric flow in Query Builder allows you to measure and analyze key outcomes using prebuilt PX metrics and custom metrics. You can create custom metrics by aggregating events, user attributes, or account attributes, and combine these metrics to build more advanced aggregate metrics. You can define metrics, apply conditions, and compute results using built-in functions or formula-based logic. This is useful when you want to track specific performance indicators, derive calculated values, or create reusable analytics.
To create a metric-based report:
- Metrics: Define the metrics to report.
- Advanced Calculations: Build a formula in case of an aggregated metric.
- View Results: Select the time range and view results.
Add Metrics
Add one or more metrics to define what you want to measure. You can choose from predefined PX metrics for common analytics or build custom metrics using aggregation functions to measure specific events, attributes, or properties.
To add the report’s metrics:
- Navigate to Analytics > Query Builder.
- Click Create Report and select Metric.
- Click Add Metric and select how you want to build:
- Prebuilt PX Metrics: Use predefined metrics such as Unique Users, Total Events, Active Users, and more to quickly get started.
- Build Custom Metrics: Create metrics using aggregation functions such as count, sum, or average.
Use Prebuilt PX Metrics
Prebuilt PX metrics allow you to quickly create reports without configuring calculations manually.
The following prebuilt PX metrics are available:
- Active Users: Users who started at least one session during the selected time range.
- Active Accounts: Accounts that had at least one active user during the selected time range.
- All Users:Total distinct users matching your audience criteria, regardless of activity or the selected time range.
- All Accounts: Total distinct accounts matching your audience criteria, regardless of activity or the selected time range.
- New Users: Users first seen during the selected time range.
- New Accounts: Accounts first seen during the selected time range.
- Total Events: Total event occurrences during the selected time range.

To create a report using prebuilt metrics:
- In the Prebuilt PX Metric section, select a predefined metric (for example, Unique Users or Total Events). PX automatically prefills the WHERE and IN conditions to any events and all audiences respectively (except for All Users and All Accounts).
- Click the WHERE clause to edit the condition.
- In the Edit Conditions slide-out panel, configure:
- Event: Define the event that needs to be considered for calculation of the metric
- Event Type: Select the type of event (for example, Custom Event, or Engagement), followed by the corresponding field.
- In the Where section, click Add to apply filters.
- Add conditions based on event properties or attributes to refine the dataset.
- (Optional) Click Add Event to include additional events in the query.

- Audience: Expand the Audience section to include additional audience groups. By default, all audiences are selected.
- In the Where section (for example, A1), click Add to define conditions based on user or account attributes.
- In the Who Executed section, click Add to define behavioral conditions based on event execution, such as the number of times an event was performed, the time window for the condition and more.
- (Optional) Click Add Audience to include additional audience groups.

- Event: Define the event that needs to be considered for calculation of the metric
- Click Save to update the WHERE clause.
- Click Add Metric to add additional prebuilt or custom metrics. Once a second metric is added, each metric is assigned a variable (for example, A, B, C, and so on).
Use Custom Metrics
Custom metrics allow you to create reports using aggregation functions and define calculations based on events, attributes, or their properties. This approach provides greater flexibility to analyze data beyond predefined metrics.
The following customer metrics are available:
- Sum
- Average
- Count
- Count Distinct
- Median

To create a report using custom metrics:
- In the Metric section, select Build Custom Metrics.
- Select an aggregation function for the report.
- Select the data source for the aggregation:
- Custom Events: Select the custom event, followed by the event property to perform the aggregation.
- User Attribute: Select the user attribute to perform the aggregation.
- Account Attribute: Select the account attribute to perform the aggregation.
- Select the specific event, attribute, or property to perform the calculation.

- Click the WHERE clause to edit the audience. By default, all audiences are selected.
- In the Edit Conditions slide-out panel, expand the Audience section to include additional audience groups. By default, all audiences are selected.
- In the Where section (for example, A1), click Add to define conditions based on user or account attributes.
- In the Who Executed section, click Add to define behavioral conditions based on event execution, such as the number of times an event was performed, the time window for the condition and more.
- (Optional) Click Add Audience to include additional audience groups.

- Click Save to update the WHERE clause.
- Click Add Metric to add additional prebuilt or custom metrics. Each added metric is assigned a variable (for example, A, B, C, and so on).
Perform Advanced Calculations on Metrics
Advanced Calculations allow you to combine multiple metrics and create formula-based calculations. If a report contains multiple metrics, prebuilt metrics, custom metrics, or a combination of both, you can use Advanced Calculations to define the calculation between the selected metrics to create advanced metrics.
To combine multiple metrics and create formula-based calculations:
- In the formula bar, click the edit icon to assign a name to the formula.
- Define the calculation by entering or selecting the available variables and operators to build the formula. For example: (A + B) / C, ((A * B) / (C + D))%, ((A-B)/B)%, or ((A + B) * C) / D.

- Only defined variables (A, B, C, and so on) can be used in a formula.
- The formula cannot be empty
- Use standard mathematical syntax to ensure the formula is valid.
- Use only supported mathematical operators (+, -, *, /, %, ^) and parentheses ().
- Parentheses must be balanced and cannot be empty.
- A formula cannot begin or end with an operator(except for %), or contain consecutive operators.
View Results
After defining the metrics and, if applicable, the advanced calculation formula, you can preview the report before saving it.
To view the results:
- Select the required time range.
- Click View Results. The report is generated and displayed as a line chart along with the aggregated value for the selected time period.

- Click the chart icon to switch between the Line Chart view and the KPI Chart view. The KPI Chart view displays the aggregated value for the selected time period along with the corresponding data table.

- (Optional) Click Export CSV to export the report results, including the applied filters and selected time range. The exported file includes the resultant metric value for the selected time range in the first row, followed by metric values grouped by the selected time granularity (day, week, or month) from the second row onwards.
- Click Save to save the report and make it available from the Query Builder reports list.
After the report is saved, you can add the report as a dashboard widget when creating a new dashboard or editing an existing one. For more information, refer to the Widgets in Gainsight PX article.
Cohort
The Cohort flow in Query Builder allows you to analyze user behavior by tracking specific events and comparing different groups of users or accounts. This approach focuses on understanding how defined audiences interact with your product over time.
You can build cohort-based queries by combining events and audience conditions, enabling you to compare behaviors across segments, identify usage patterns, and validate product hypotheses. Cohort analysis is useful for evaluating feature adoption, engagement performance, and differences in behavior across user groups.
To create a cohort-based report:
- Navigate to Analytics > Query Builder.
- Click Create Report and select Cohort.

Example Business Use Cases:
- Answer tough product questions with flexible query-like language
- Compare user behavior across different audiences
- Use different visualization methods to analyze results
Compare Different Audiences
Track specific events and compare any number of different cohorts and behaviors to learn more about a specific behavior or validate a specific hypothesis.
Gainsight PX allows you to customize the name of the event or audience on the Query Builder filter. This helps you easily understand the events or audience pertaining to the filtered query. The event labels are auto-populated from the last part of the selected feature name and you can modify them. These labels are displayed in the Query Builder chart area as legends, and in the data rows.
You can select up to five audience attributes to break down the analysis across multiple dimensions.
Drill-Down Capability
Query Builder provides you the ability to drill down from the query result numbers to a detailed list of the underlying users or accounts. You can click the user or account count from the query result to navigate to the users or accounts list view.
In the case of users, a further drill-down on an individual user helps you view the user profile and check their recent activity and engagements. Within the drill-down view of the Query Builder, you can switch between different cohorts as well as between different time periods.
Track Historical Behaviour
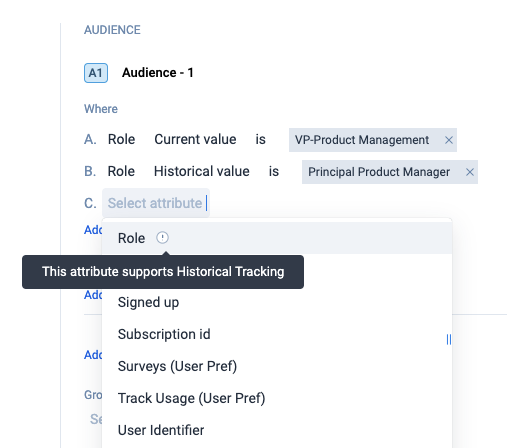
You can build queries to analyze the time-lapsed cohort behaviour of different User and Account audiences. Gainsight PX supports a maximum of ten user and account attributes with historical values tracking that can now be leveraged to build queries. The Audience section in Query Builder supports historical tracking of User and Account attributes that can be used in queries.
This feature helps to:
- Find cohorts that have specific current and/or historical values
- Compare cohort behavior between historical and current values (using different audiences).
![]()
Group-Specific Events or Attributes
You can use the Group By field to aggregate results based on specific fields. Grouping the analytics data helps you gain insights from multiple custom events and analyze results quickly.
Query Builder supports grouping by multiple attributes, allowing for deeper segmentation and more granular analysis. You can select up to five attributes, such as Country, City, OS Version, and more, to break down event data across multiple dimensions.

Event Properties in Query Builder
Users can select the following event properties to analyze the product usage behaviors across audiences and group results to gain granular insights.
- Custom Events
- Feature Events
- Engagement Events
- Session Initialization Events
- Page View Events
- Mobile Screen Events
Custom Event Properties
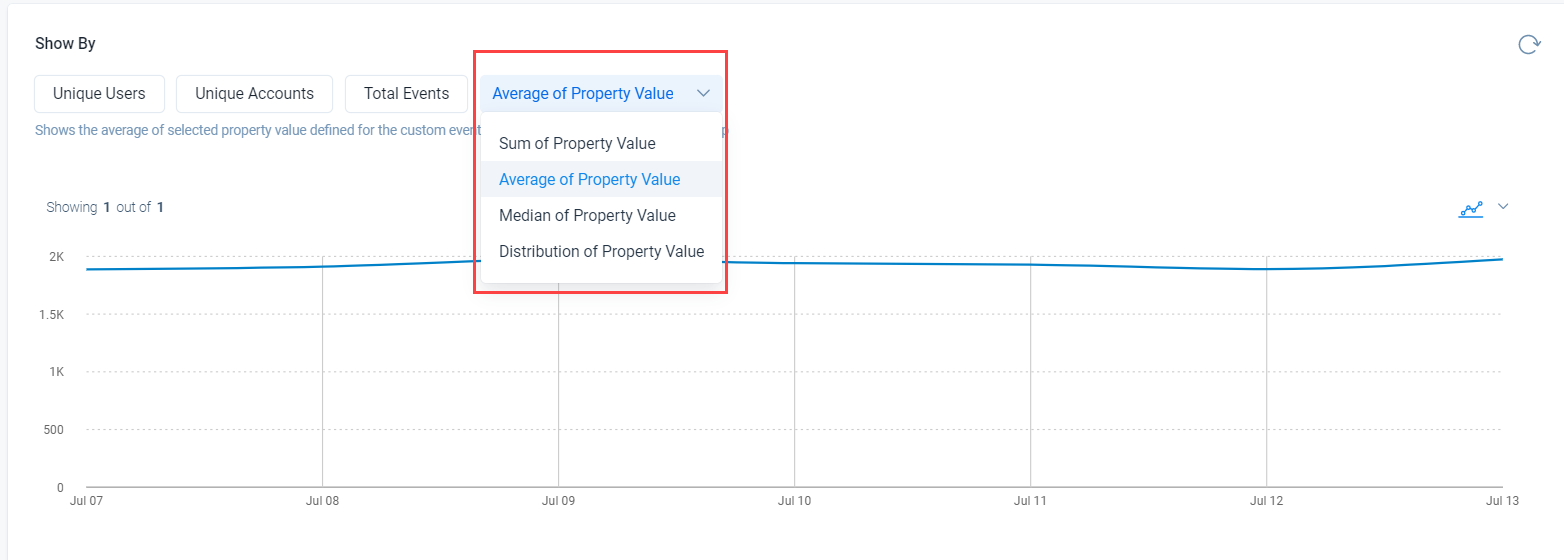
You can analyze custom event properties based on property values. This may come in handy when you want to measure the event properties such as video play counts or monetary values you're passing to Gainsight PX through Custom Events.
Global Context queries provides you the ability to have granular querying experience.
For more information, refer to the Use Custom Event API article from.

For more information about all frequently asked questions, refer to the Analytics FAQs article.
When you create a query with numerical attributes of custom events, you can evaluate the results using Property Value aggregations.
Feature Events
Users can select events based on channel/feature in the Event dropdown list. The events are grouped into the following categories:
- Web App Features
- Mobile Features
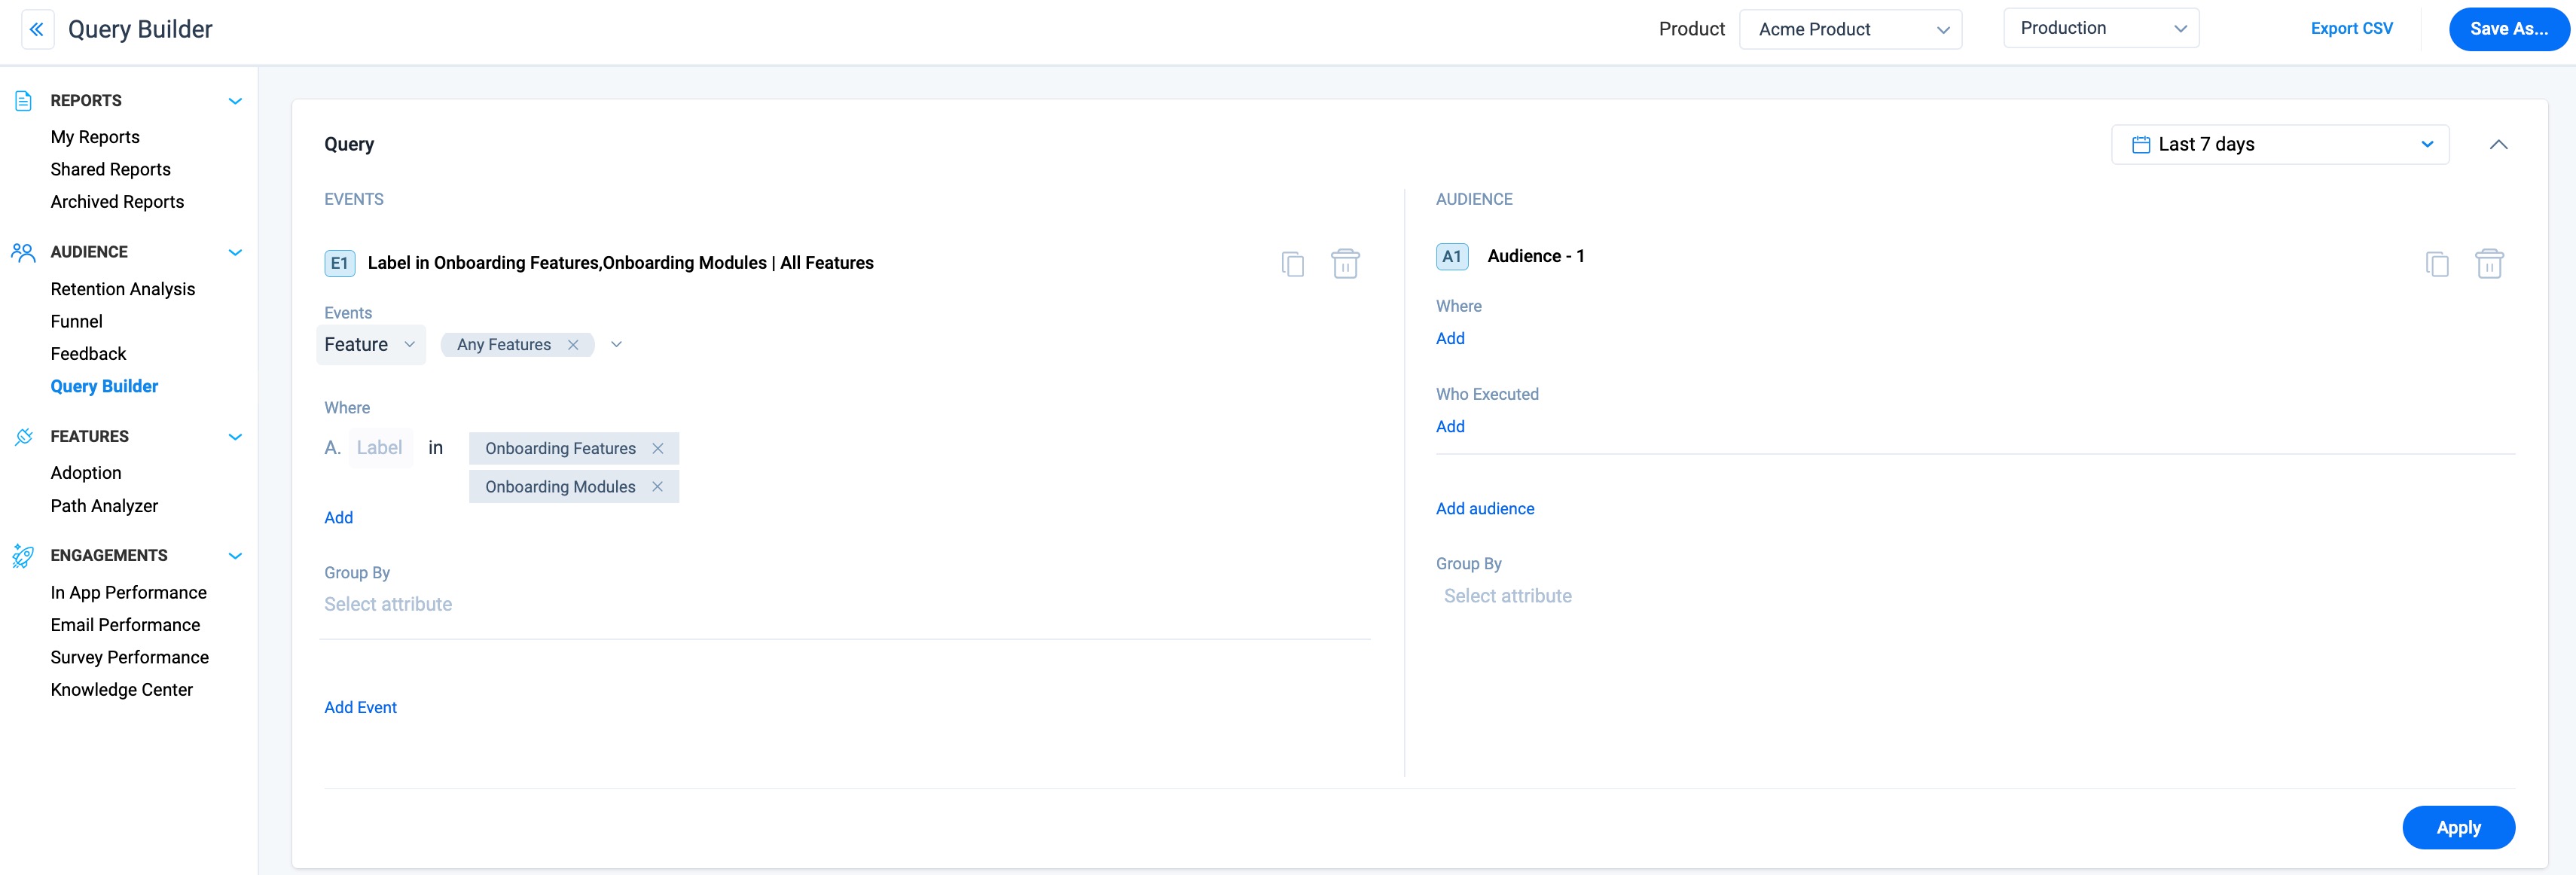
You can build queries using the All Features events that helps you define a cohort of users who have visited these features.
Use Labels for Feature Events
You can create labels for your product features or modules in Product Mapper. These labeled features can then be used to build queries to filter feature data.
Example Business Use Cases: Consider that you want to track the usage of features and modules that are shared as part of an onboarding guide. Group all the features using a label and then build queries to filter feature data.
Engagement Events
Users can now select engagement events in the Query Builder to create custom analytics and gain deeper insights into audience behaviors. You can further refine your query by selecting the required engagement type and its attributes.
Example Business Usecase: Create a query to find the number of views on a NPS Survey engagement among the android users who has submitted the survey response with a promoter score.
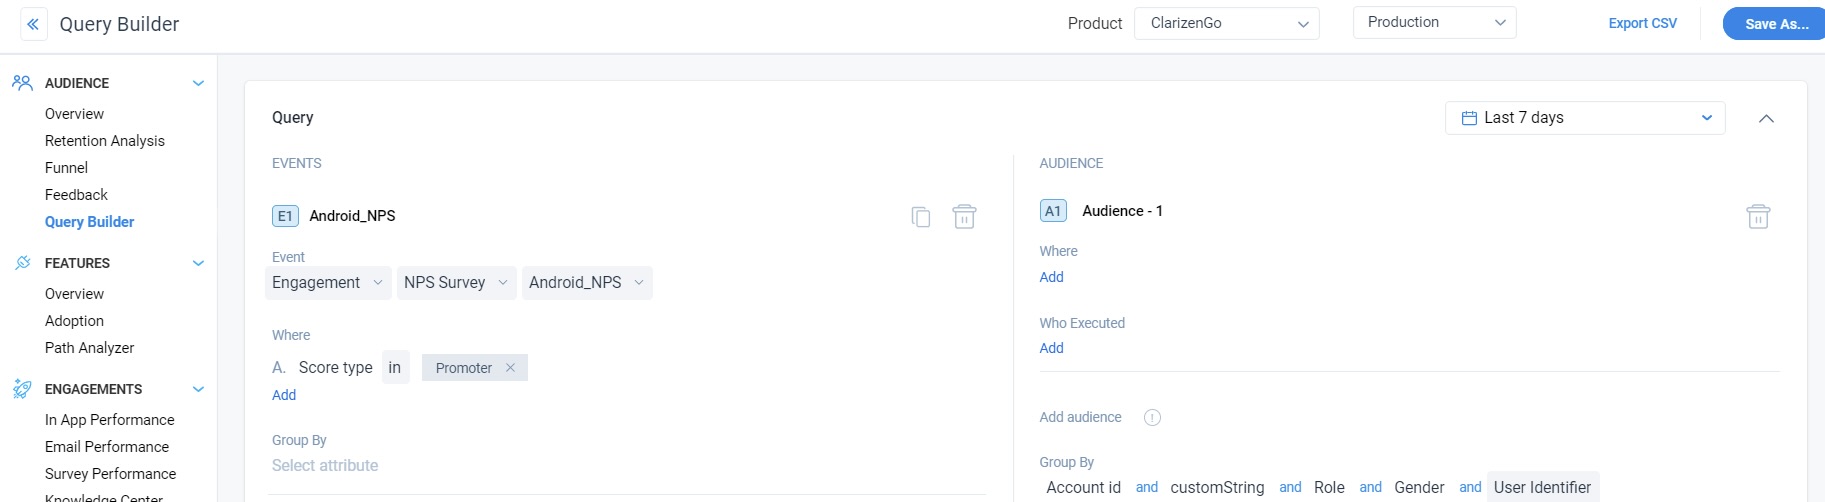
- Query Builder results related to surveys can display results that are grouped by options of survey Score and Score type across NPS, CES, Rating, and Boolean surveys, allowing for a deeper analysis of the survey results.
- You can build queries using All Engagements events that helps you define a cohort of users who interacted with the engagements.
Session Initialization Events
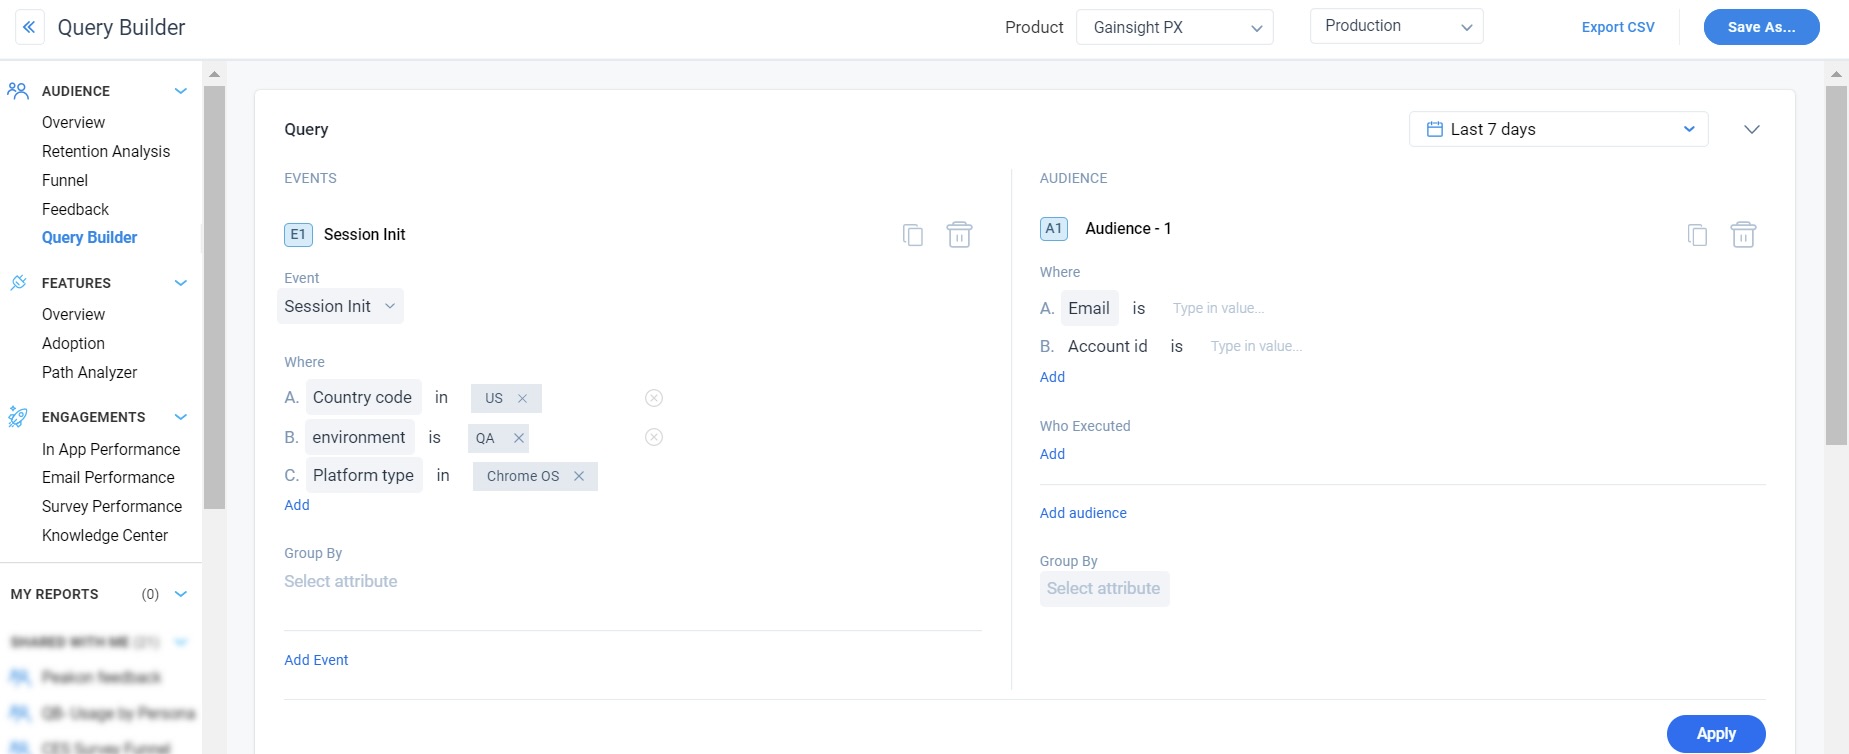
The Session Init option helps you query on user sessions data along with other query options in the event and audience sections. You can create queries to find out the details of the sessions initialized by users based on the attributes such as Global Context, Inferred Location, Device, and Platform.
Page View Events
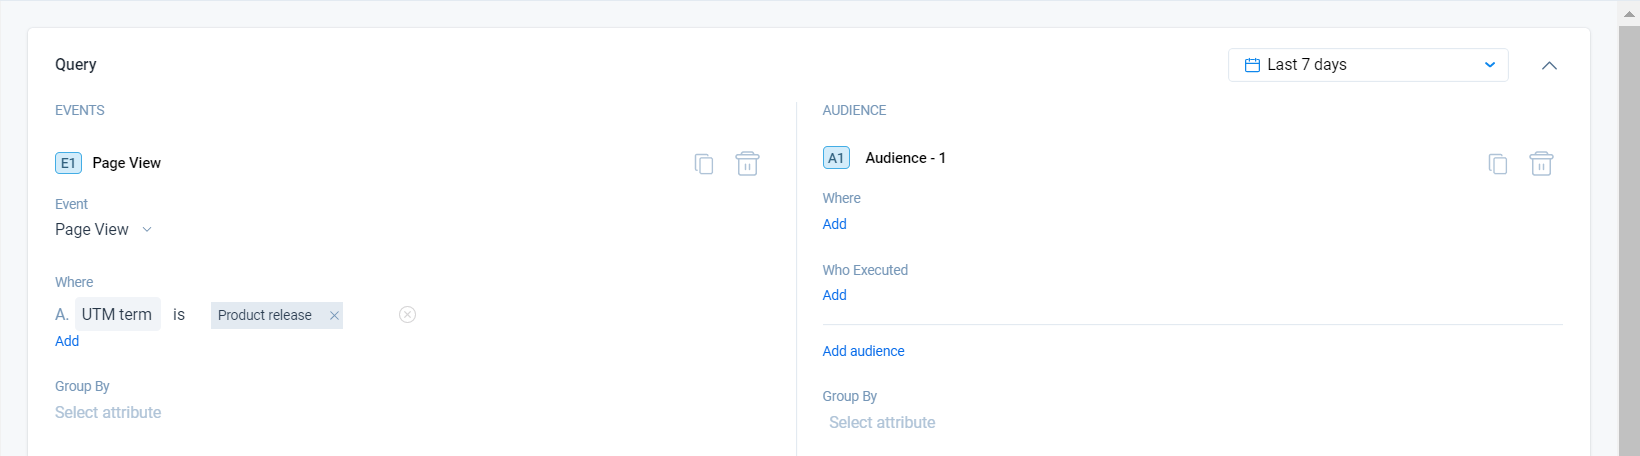
The Page View option helps to query on various page view events using various URL and UTM parameters as given below:
URL parameters:
- Full URL enables grouping and filtering by the complete URL, including path and parameters.
- Hash allows segmentation by in-page anchors or route fragments (for instance, #demo, #faq).
- Hostname identifies the host that holds the resource.
- Page Title is a short description of a webpage that appears at the top of a browser window
- Path represents a specific section or page of your application or website.
- Query Parameter represents a set of parameters added to the base URL (along with a value usually) to get specific content or denote an action from your application or website
- Referrer is the webpage that sends visitors to your site using a link.
- Scheme identifies the protocol to be used to access the resource on the Internet. It can be HTTP (without SSL) or HTTPS (with SSL).
- URI is a sequence of characters that distinguishes one resource from another.
UTM parameters:
- utm_source: Identifies which site sent the traffic.
- utm_medium: Identifies what type of link was used, such as cost per click or email.
- utm_campaign: Identifies a specific product promotion or strategic campaign.
- utm_term: Identifies the (paid) keyword associated with the traffic
- utm_content: Identifies what specifically was clicked to bring the user to the site, such as a banner ad or a text link.
Mobile Screen Events
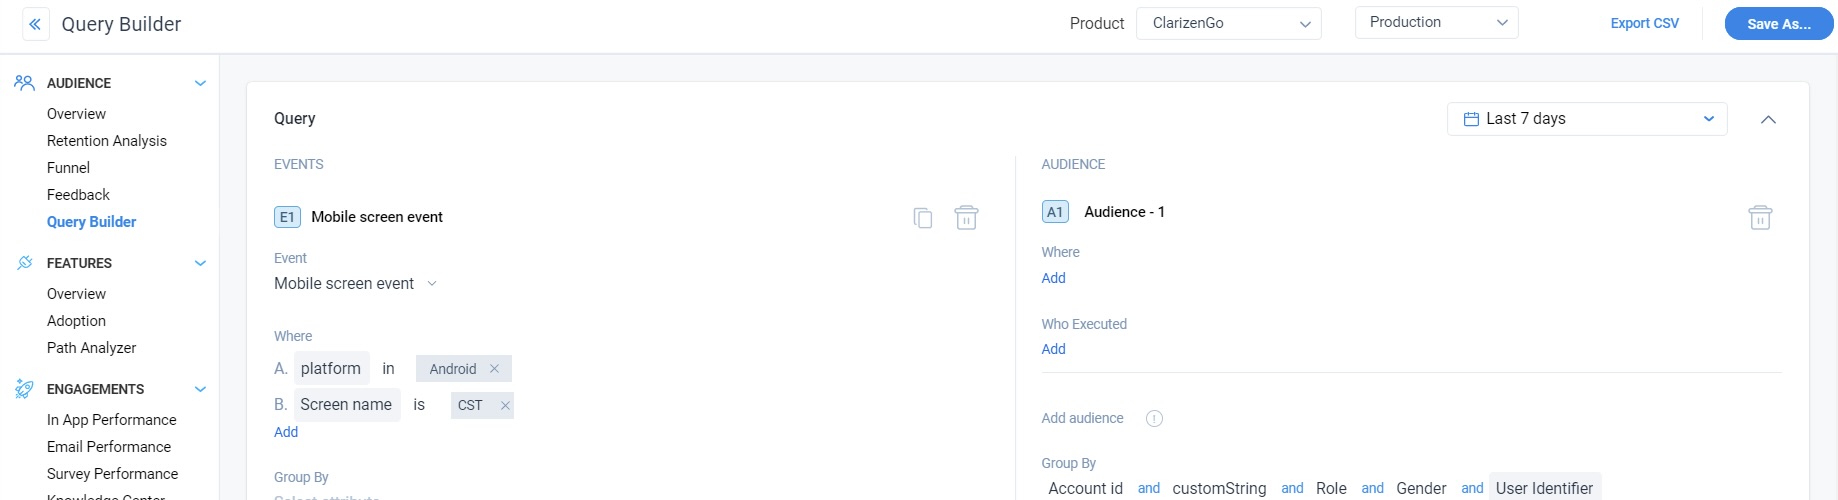
Mobile screen events helps you create queries based on the screen events and their attributes such as platform, screen name or screen class. You can also add the Group By attributes to get the required query results.
- You can add different combinations of events and audience that totals to six.
- Query Builder supports selection of multiple features, engagements and custom events. You can build queries to analyze a cohort of users who have visited these features, interacted with engagements and involved with custom events.
Export Query Builder Report to CSV
You can export the Query Builder report data as a CSV file to suit your needs of insights or further analysis. To export Query Builder data, click on Export CSV.
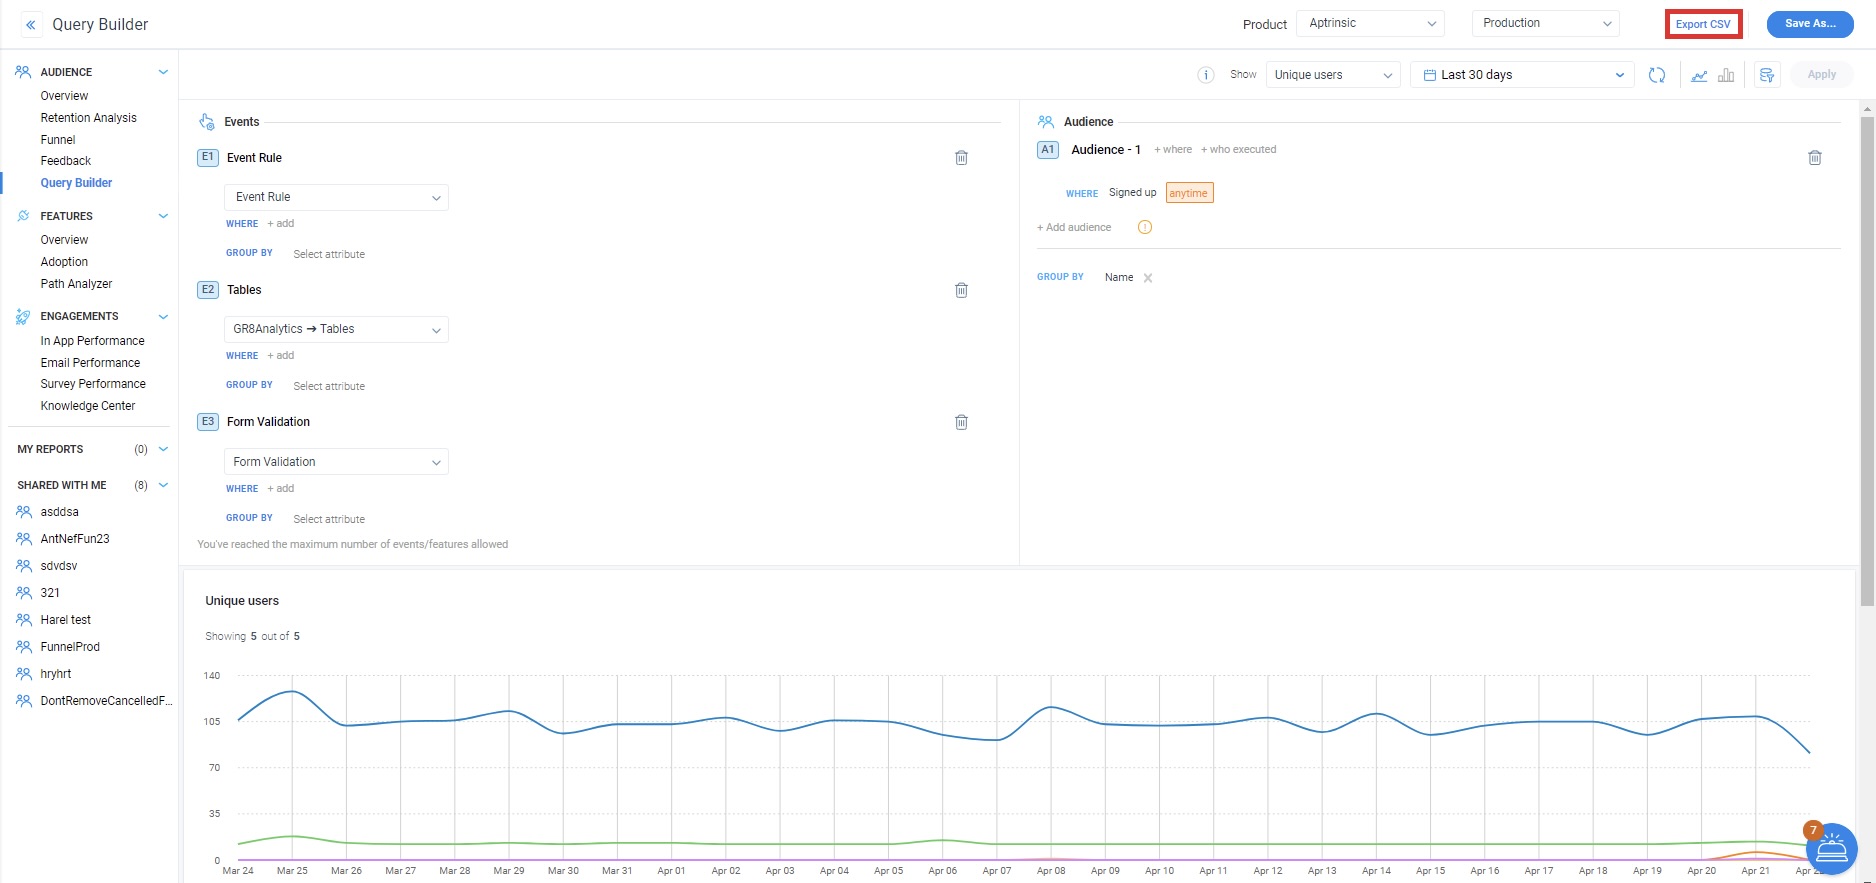
- The query results list view section displays 200 rows of cohort(s) data.
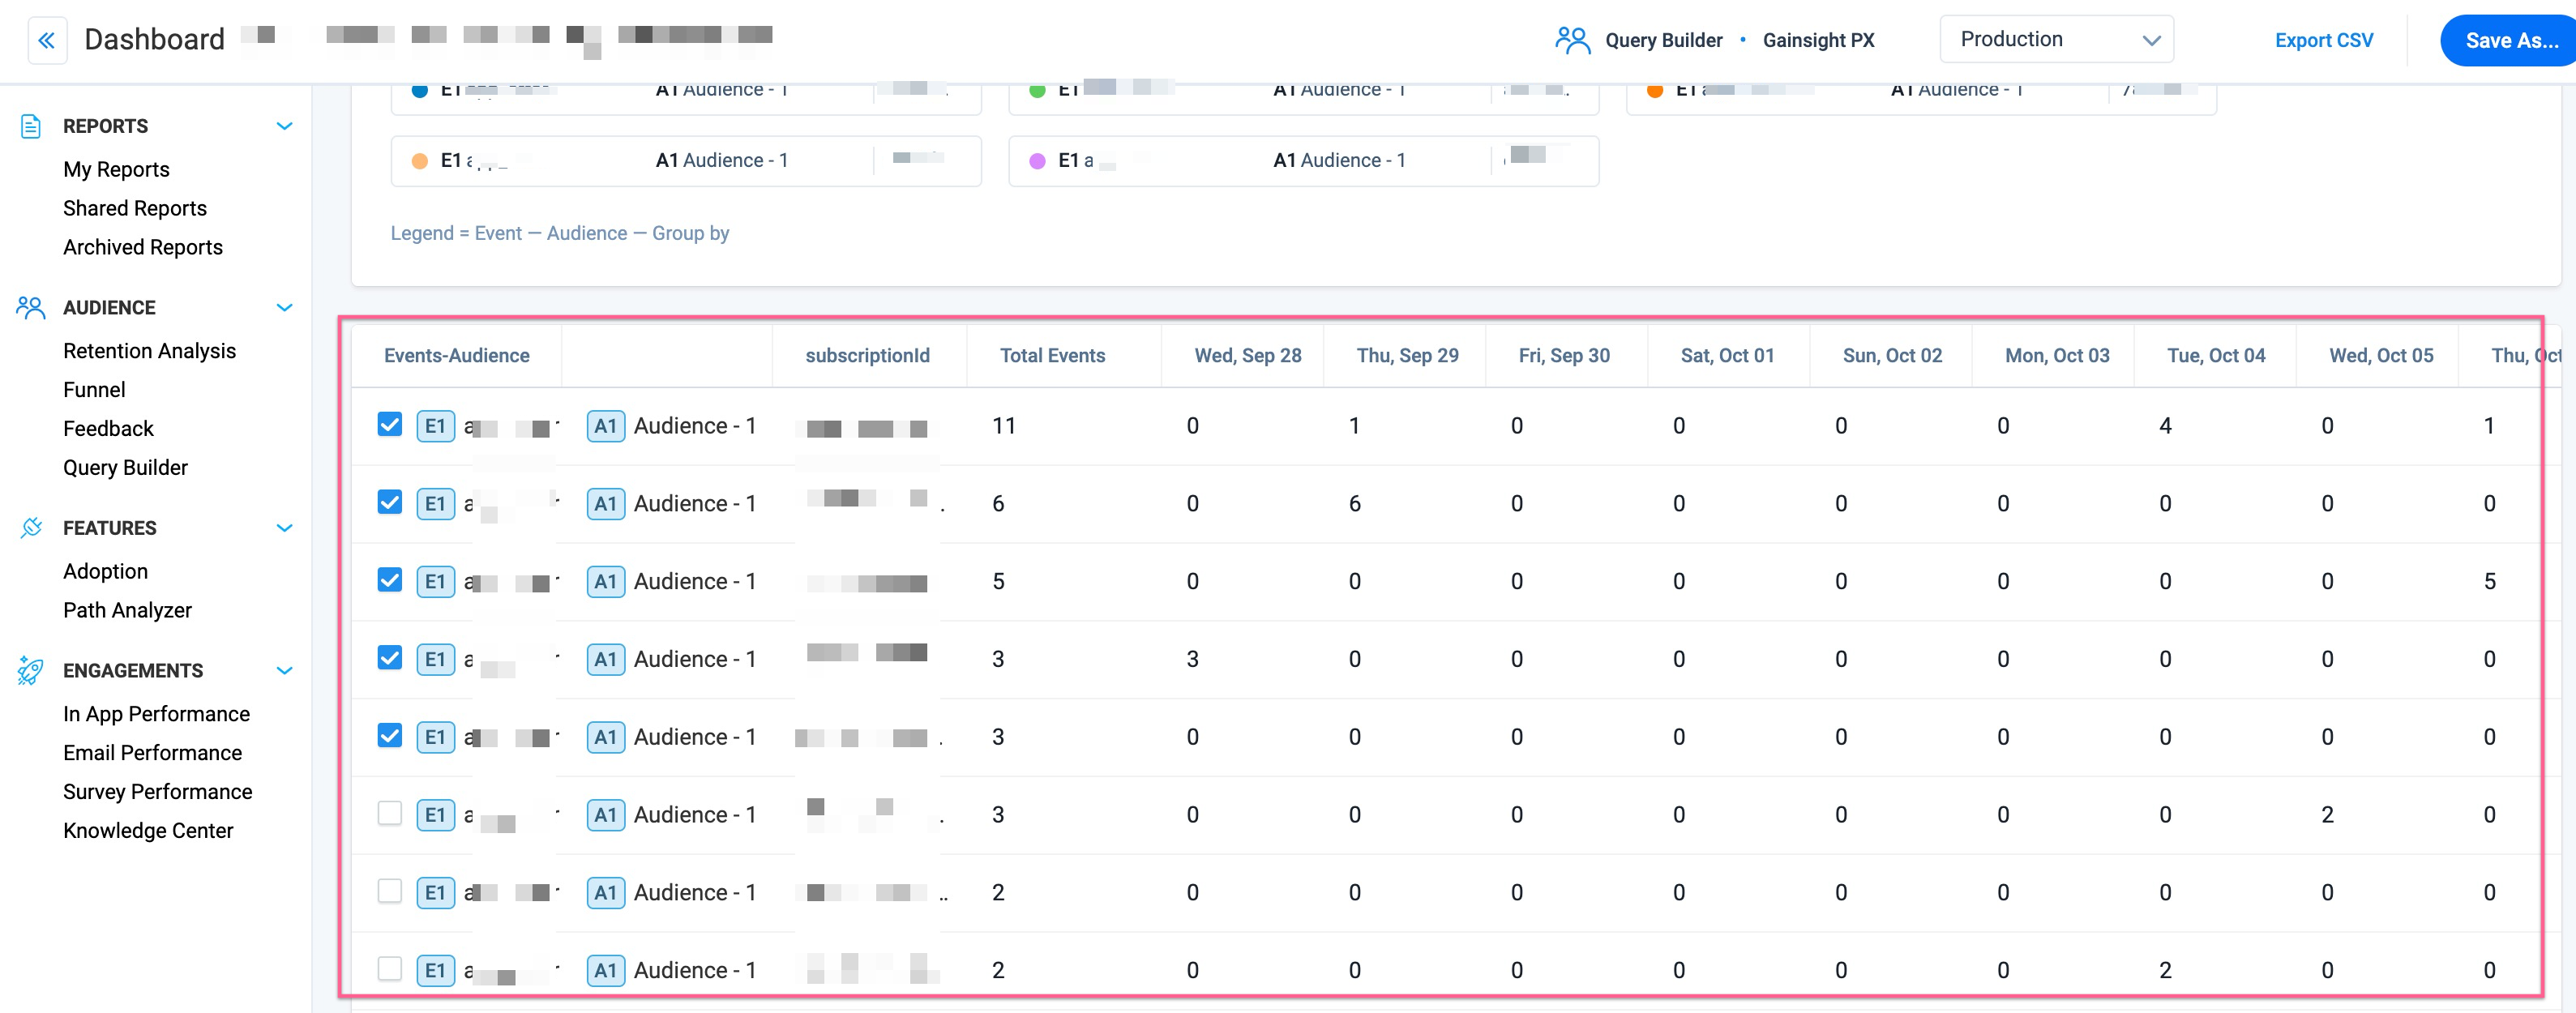
- The export limit for Query Builder CSV reports is 100K rows.

| Net Promoter®, NPS®, NPS Prism®, and the NPS-related emoticons are registered trademarks of Bain & Company, Inc., NICE Systems, Inc., and Fred Reichheld. Net Promoter ScoreSM and Net Promoter SystemSM are service marks of Bain & Company, Inc., NICE Systems, Inc., and Fred Reichheld. |