Path Analyzer
This article explains the Path Analyzer, its filters, and various configurations.
Overview
Every user is on their own path to learning and adopting your product. Path analysis helps you visualize user journey through your product traversing the product features and learning unexpected behaviors or blockers. This feature helps you find answers to questions like “How did they get to a given feature?” or “Where do they go next?".
Path Analysis reports allow you to:
- Learn about the adoption path of the first mile of product for new users
- Visualize user activity to surface unexpected user flows
- Track user activity to learn how users get to a new feature and where do they go next

Create Path Analysis Report
To create a new Path Analysis Report:
- From the main menu, navigate to Analytics.
- From the secondary menu, click Path Analyzer.
- Click Create from the reports list view page. If there are no existing reports, click Create in the following screen, to create your first Path Analyzer Report.

- In the Create Path Analyzer window, provide the following mandatory details:
- Define Path: Use the Define Path section to set up the user journey you want to analyze. Configure the path using the following dropdown menus:
- Starting with: Choose whether the path starts or ends with a specific feature or engagement.
- Type of Analysis: Choose if the analysis focuses on features or engagements.
- Feature/Engagement: Select the specific feature or engagement to begin or end the path based on the previous selections.
- Date Range: Select the timeframe for the analysis. The maximum range allowed is three months.
- Scope: Choose if the analysis should focus on user or session (same user maybe measured more than once) data.

- Define Path: Use the Define Path section to set up the user journey you want to analyze. Configure the path using the following dropdown menus:
- (Optional) The Refine Path section allows you to include or exclude specific parts or your product, to create a more focused path analysis, rather than covering the whole product in general.
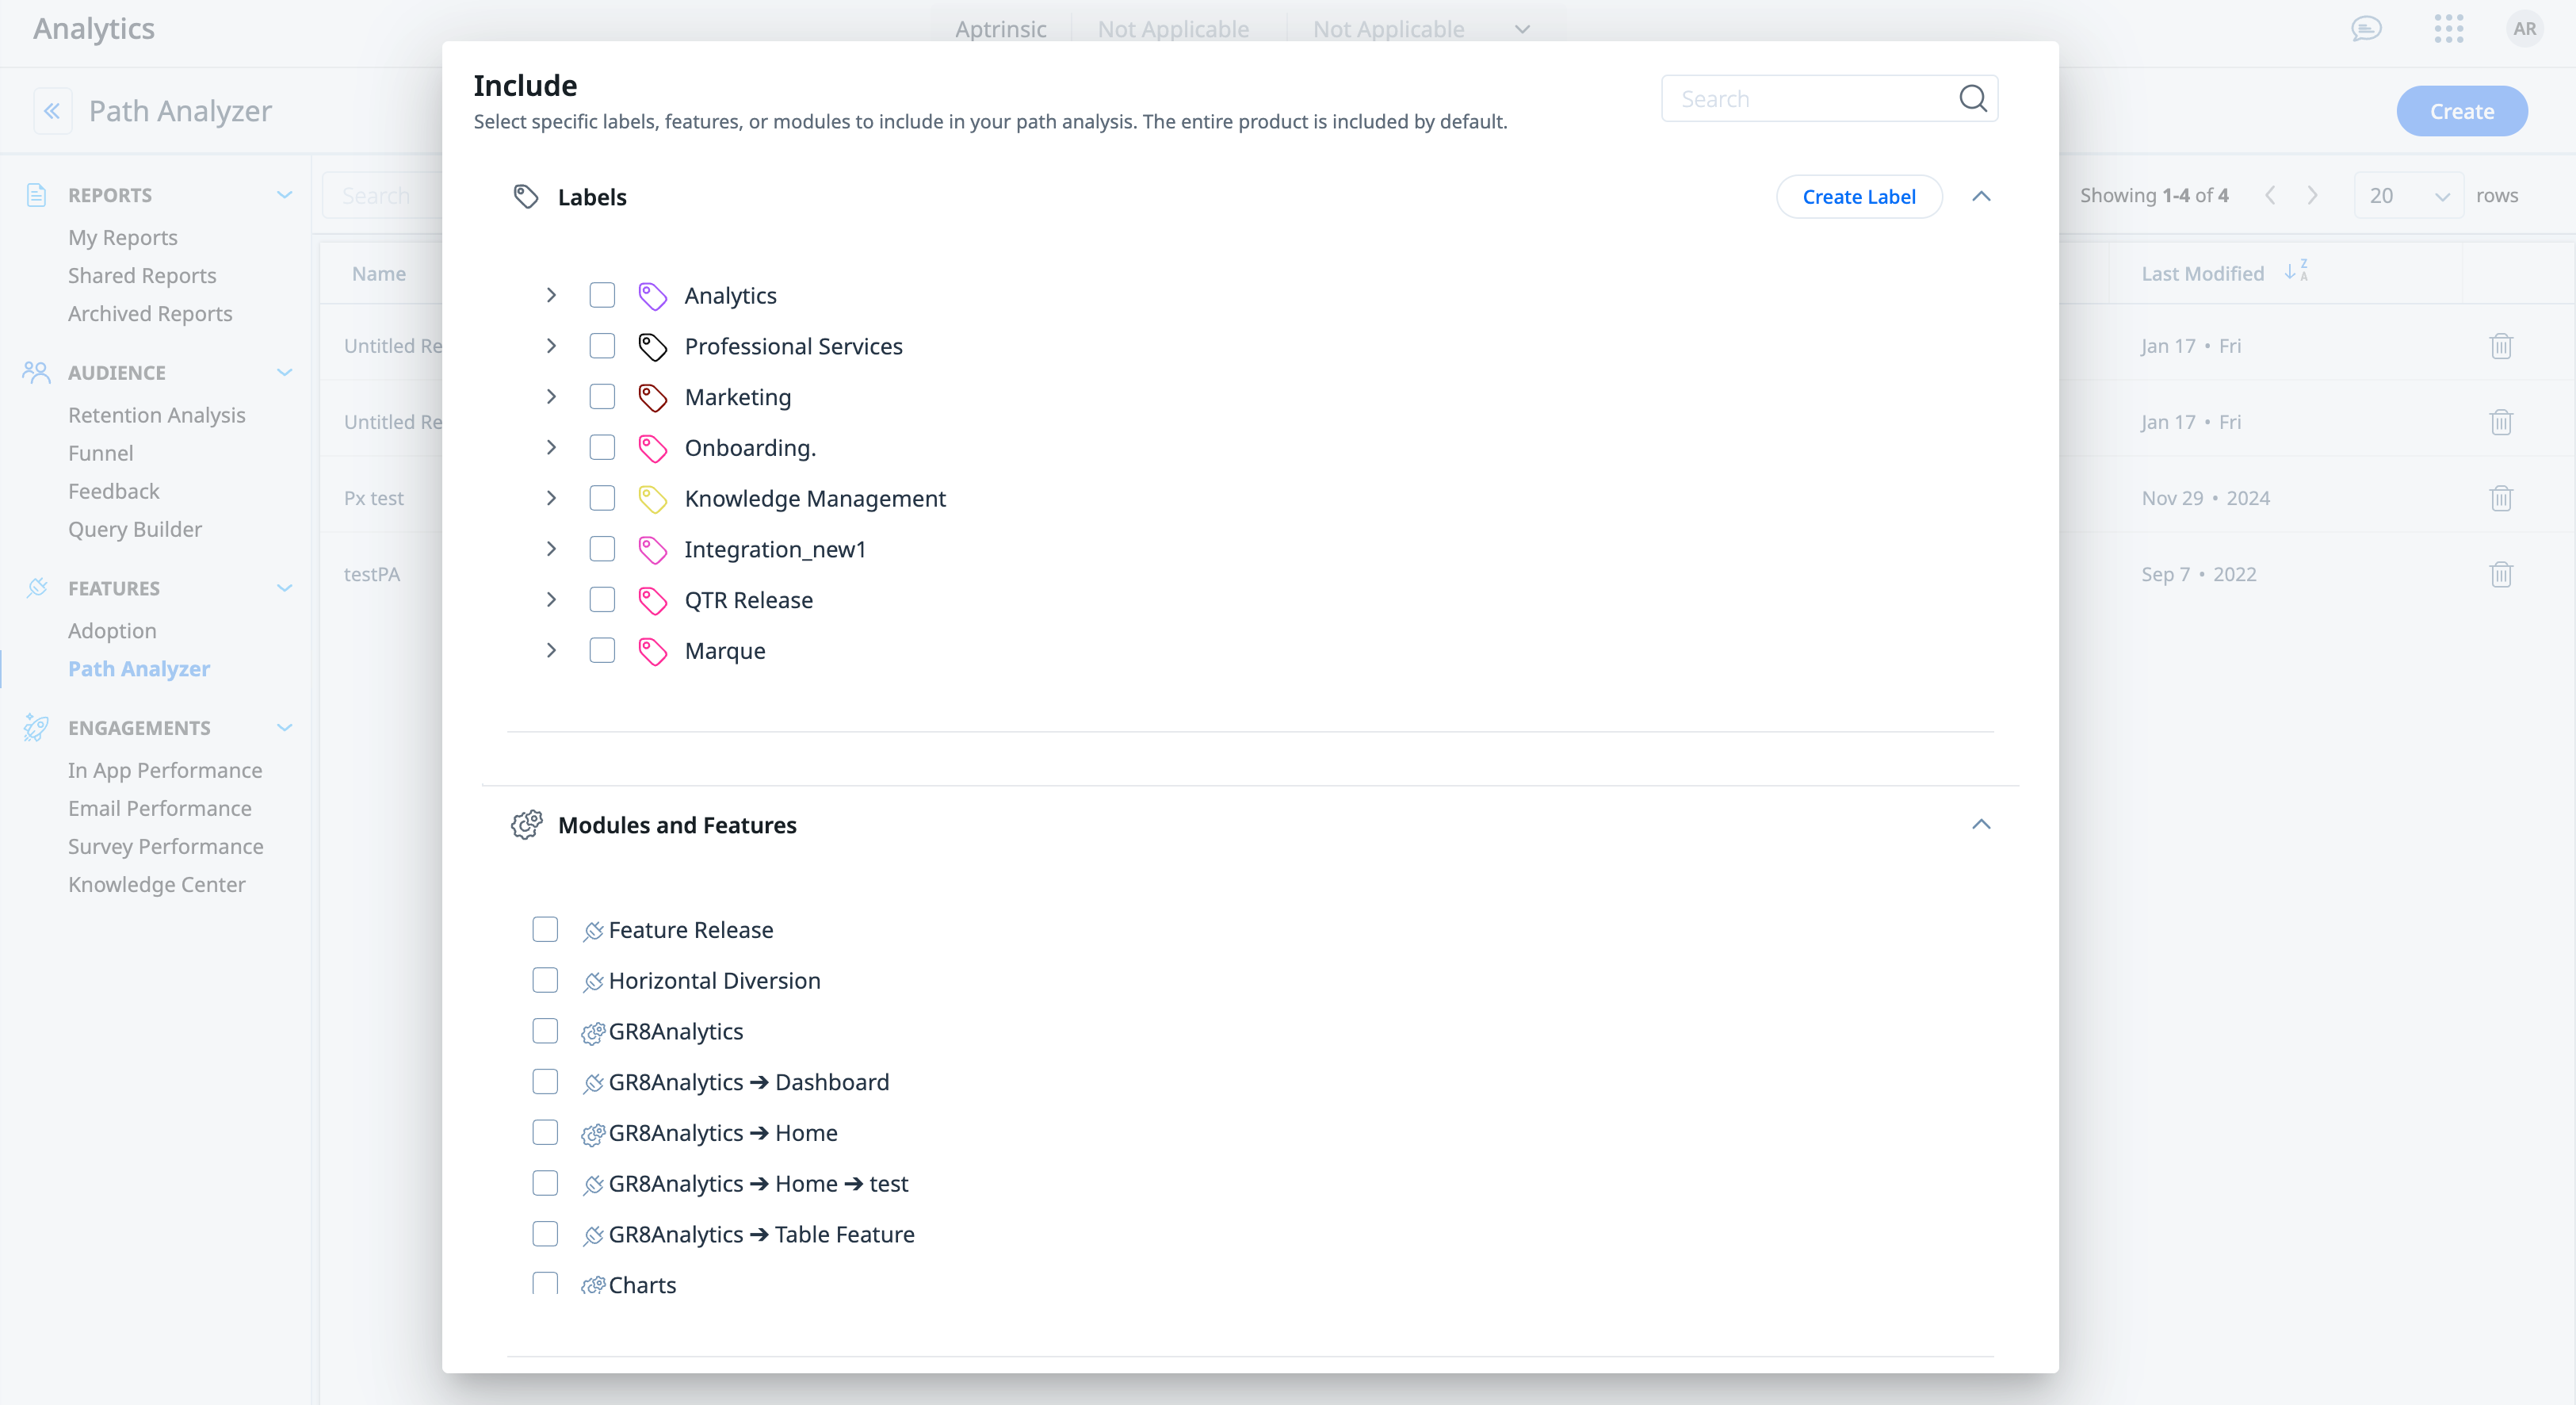
- Include: Focus the path analysis on a product area using labels, modules, or features. This restricts the scope of the analysis to only what is included.
- Exclude: Fine-tune the analysis by removing unrequired elements (labels, modules, or features) from within the included scope. Only assets marked in the Include section are available to select in the Exclude section.
- Review the configuration, included and excluded assets, and click Create to generate the report.

Note:
- Include:
- Selecting a label automatically includes all features under it. Individual features under a label cannot be selected or unselected.
- Selecting a module includes all its features. Individual features under a module can be unselected.
- When selecting labels, you can choose to create a new label and tag features under it.
- Exclude:
- Entire labels or modules can be excluded. Individual features under a label cannot be excluded.
- Individual features under a module can be excluded individually.
- Use the Search field to look for specific labels, modules, or features easily.
- Modules and features are available together in one section, alphabetically arranged and with the full path of features and submodules displayed.
Best Practices:
- By default, the entire product is included. It is recommended to use the Include section only if you want to narrow down the focus.
- Use the Include section to your precise focus for large-scale narrowing down, and then use the Exclude section for smaller-scale refinements.
- If no assets are added in the Include section, the Exclude section can be used to remove items from the entire product.
Path Analyzer Report
The Path Analyzer report provides a visual representation of how users navigate through your product, uncovering their interactions with various features and identifying key patterns in their journey. It highlights the paths users take, including where they start, the steps they follow, and where they exit. This analysis helps pinpoint trends, detect potential barriers, and understand user behavior, enabling better decision-making to optimize the product experience.

In a path analysis report, you can perform the following operations:
- Report Name: View or update the name of the path analysis report.
- Report Description: Click the information icon to view or update the description of the report.
- Path Configuration: View the various parameters used to build the report. Hover on each to view details.
- Date Range: View the timeframe for which the report is generated.
- Refresh: Update the report to view the latest analysis.
- Filters: Use filters to specify a cohort (personas, engagements, or account types or any other) that are to be analyzed.
- Manage Reports: Click the three-horizontal dots menu for the following options:
- Edit: Modify the path (along with inclusions and exclusions) of the analysis.
- Share: Share the report with other users in the subscription.
- Delete: Permanently remove the report from the subscription.
- AI Insights: Click AI Insights for an AI generated summarization of the path analysis. For more information, refer to the AI Insights section.
- Threshold: Define the minimum traffic percentage for that feature to be displayed in the path analysis.
- Steps: Define how deep you want the journey to reflect.
AI Insights
AI Insights automatically generates natural language summaries that highlight key user behavior patterns derived from complex path data. The insights are grouped into five predefined categories and are designed to help you interpret usage trends, friction points, and anomalies without manually analyzing event-level data. Each AI Insights summary concludes with a set of tailored, actionable recommendations based on the observed user behavior.
This reduces the time required to review path analysis by presenting structured observations and suggested next steps that can be used for optimization, prioritization, or further investigation.
AI Insights provide a curated summary of user path data across the following five categories:
| Insight Name | Description | Use Case |
|---|---|---|
| Top User Journeys & Engagement Patterns | Identifies the most frequently traveled user paths and repeated navigation sequences. | Helps you determine which flows receive the highest volume of interactions and may indicate areas for optimization due to high exposure or recurring usage. |
| Drop-Off Analysis & Friction Points | Highlights key steps in the user journey where drop-offs occur or hesitation is detected. | Help pinpoint potential friction points that may be affecting progression, allowing for targeted improvements to reduce abandonment or disengagement. |
| Cross-Feature Interactions & Module Usage | Surfaces how users transition between product features or modules. | Identifies high-usage areas as well as features that show low or unexpected engagement, supporting decisions around feature adoption and visibility improvements. |
| Unexpected User Behaviors & Anomalies | Detects navigation patterns that deviate from expected flows, including loops, redundancies, or outlier behaviors. | These patterns may indicate confusion, misuse, or alternative usage paths that merit further investigation. |
| Flow Dynamics & Transition Efficiency |
Analyzes the speed and efficiency with which users move between steps in the path. |
Helps detect bottlenecks or slower transitions that could signal usability issues or unclear UI elements affecting navigation. |

Business Use Cases
The following are some of the use cases for which the path analysis report can be used:
Measure the First Mile of Product
Using the user sign-up date you can specify the scope of your first mile of product to:
- Learn about how users interact with your product
- Validate they are on track, following the journey you expected and
- See where they drop-off
IMPORTANT:
- Path Analyzer displays the path traversed by the top 10 features only. If a user navigated from Feature A to 100 different features, you can only view the 9 most common features visited by the user. The remaining 91 features are grouped as Other features.
- You cannot configure the number of features which can be viewed in each step. Gainsight PX displays a maximum of 10 features in each step. If a feature is not mapped to any step, but it has user activity then the feature is not included in the Other category.
- If you notice a considerable drop in user activity between two steps in a path, then it implies that either the users are dropping off before the second step in the workflow or you have features that are not mapped in the Product Mapper.
Gain Real-time Insights on New Release's Adoption
When launching a new feature or module you can specify the relevant step you want to focus on and see how users got to your newly launched feature or where do they go afterward.