Funnels
This article explains how to configure and analyze Funnel reports.
Overview
Funnel reports help you to create and track specific user journeys through your product. Funnels also help to identify where users fall off from completing critical paths or adopting important product features within your product. You can also map users' adoption and expansion goals.
Example Business Use Case:
Consider that you have configured a Funnel to determine user behavior for an online store. The Funnel steps start from the Product Catalog page and ends with the checkout page. Following are some of the analysis that can be made using Funnels:
- What percentage of users complete an order.
- How many users drop-off from completing an order.
- Which step has more drop-offs in the Funnel.
- How has the adoption of features improved with repeated interactions over time.
- Which step is more time consuming for the user to complete.
Create Funnel Report
To create a Funnel:
- Navigate to Analytics > Funnel.
- Click Create Funnel.
- Configure the following steps in the New Funnel page.
Audience
In the Audience Section, configure the audience for the funnel.

Notes:
- The existing audience filters can be applied from the My Filters section.
- The default audience is set as users that were last seen 30 days ago.
-
The Historical Tracking feature is available for Funnels.
Example Business Use Case: Consider you have configured a Funnel to determine behavior of a user who moved from Standard subscription to Premium subscription. Using the historical data and current data it is now possible to filter the specific cohort of users.
![]()
Steps
In the Steps section, specify the Funnel Type, and the Step Criteria that the users are expected to complete in your product(s).
Select Funnel Type
Select the Funnel Type from the following options:
- Single Product: This allows you to create a Funnel for a single product.
- Multi Product: This allows you to create a Funnel for multiple products.

Add Steps
Specify the step criteria or the path the user is expected to take for you to analyze the Funnel report.
To configure a step:
- Enter a Step Name.
Notes:
- Based on your selection of the step details Gainsight PX auto populates the step name.
- The step names can be edited even after the Funnel is generated
- Select a Product. By default, the default Product on the top right is selected.
- Select a Channel type (Web App/ Mobile/ Desktop).
Note: You can select specific Channels for each step to analyze user journey(s) across multiple Channels (Web App/ Mobile/ Desktop) of your Product(s). - Configure the Step Criteria. The following are the available types of steps.
- Page View
- Custom Event
- Feature Match
- Engagement
- Segments
- (Optional) Click Add Step to add the next step of the Funnel.
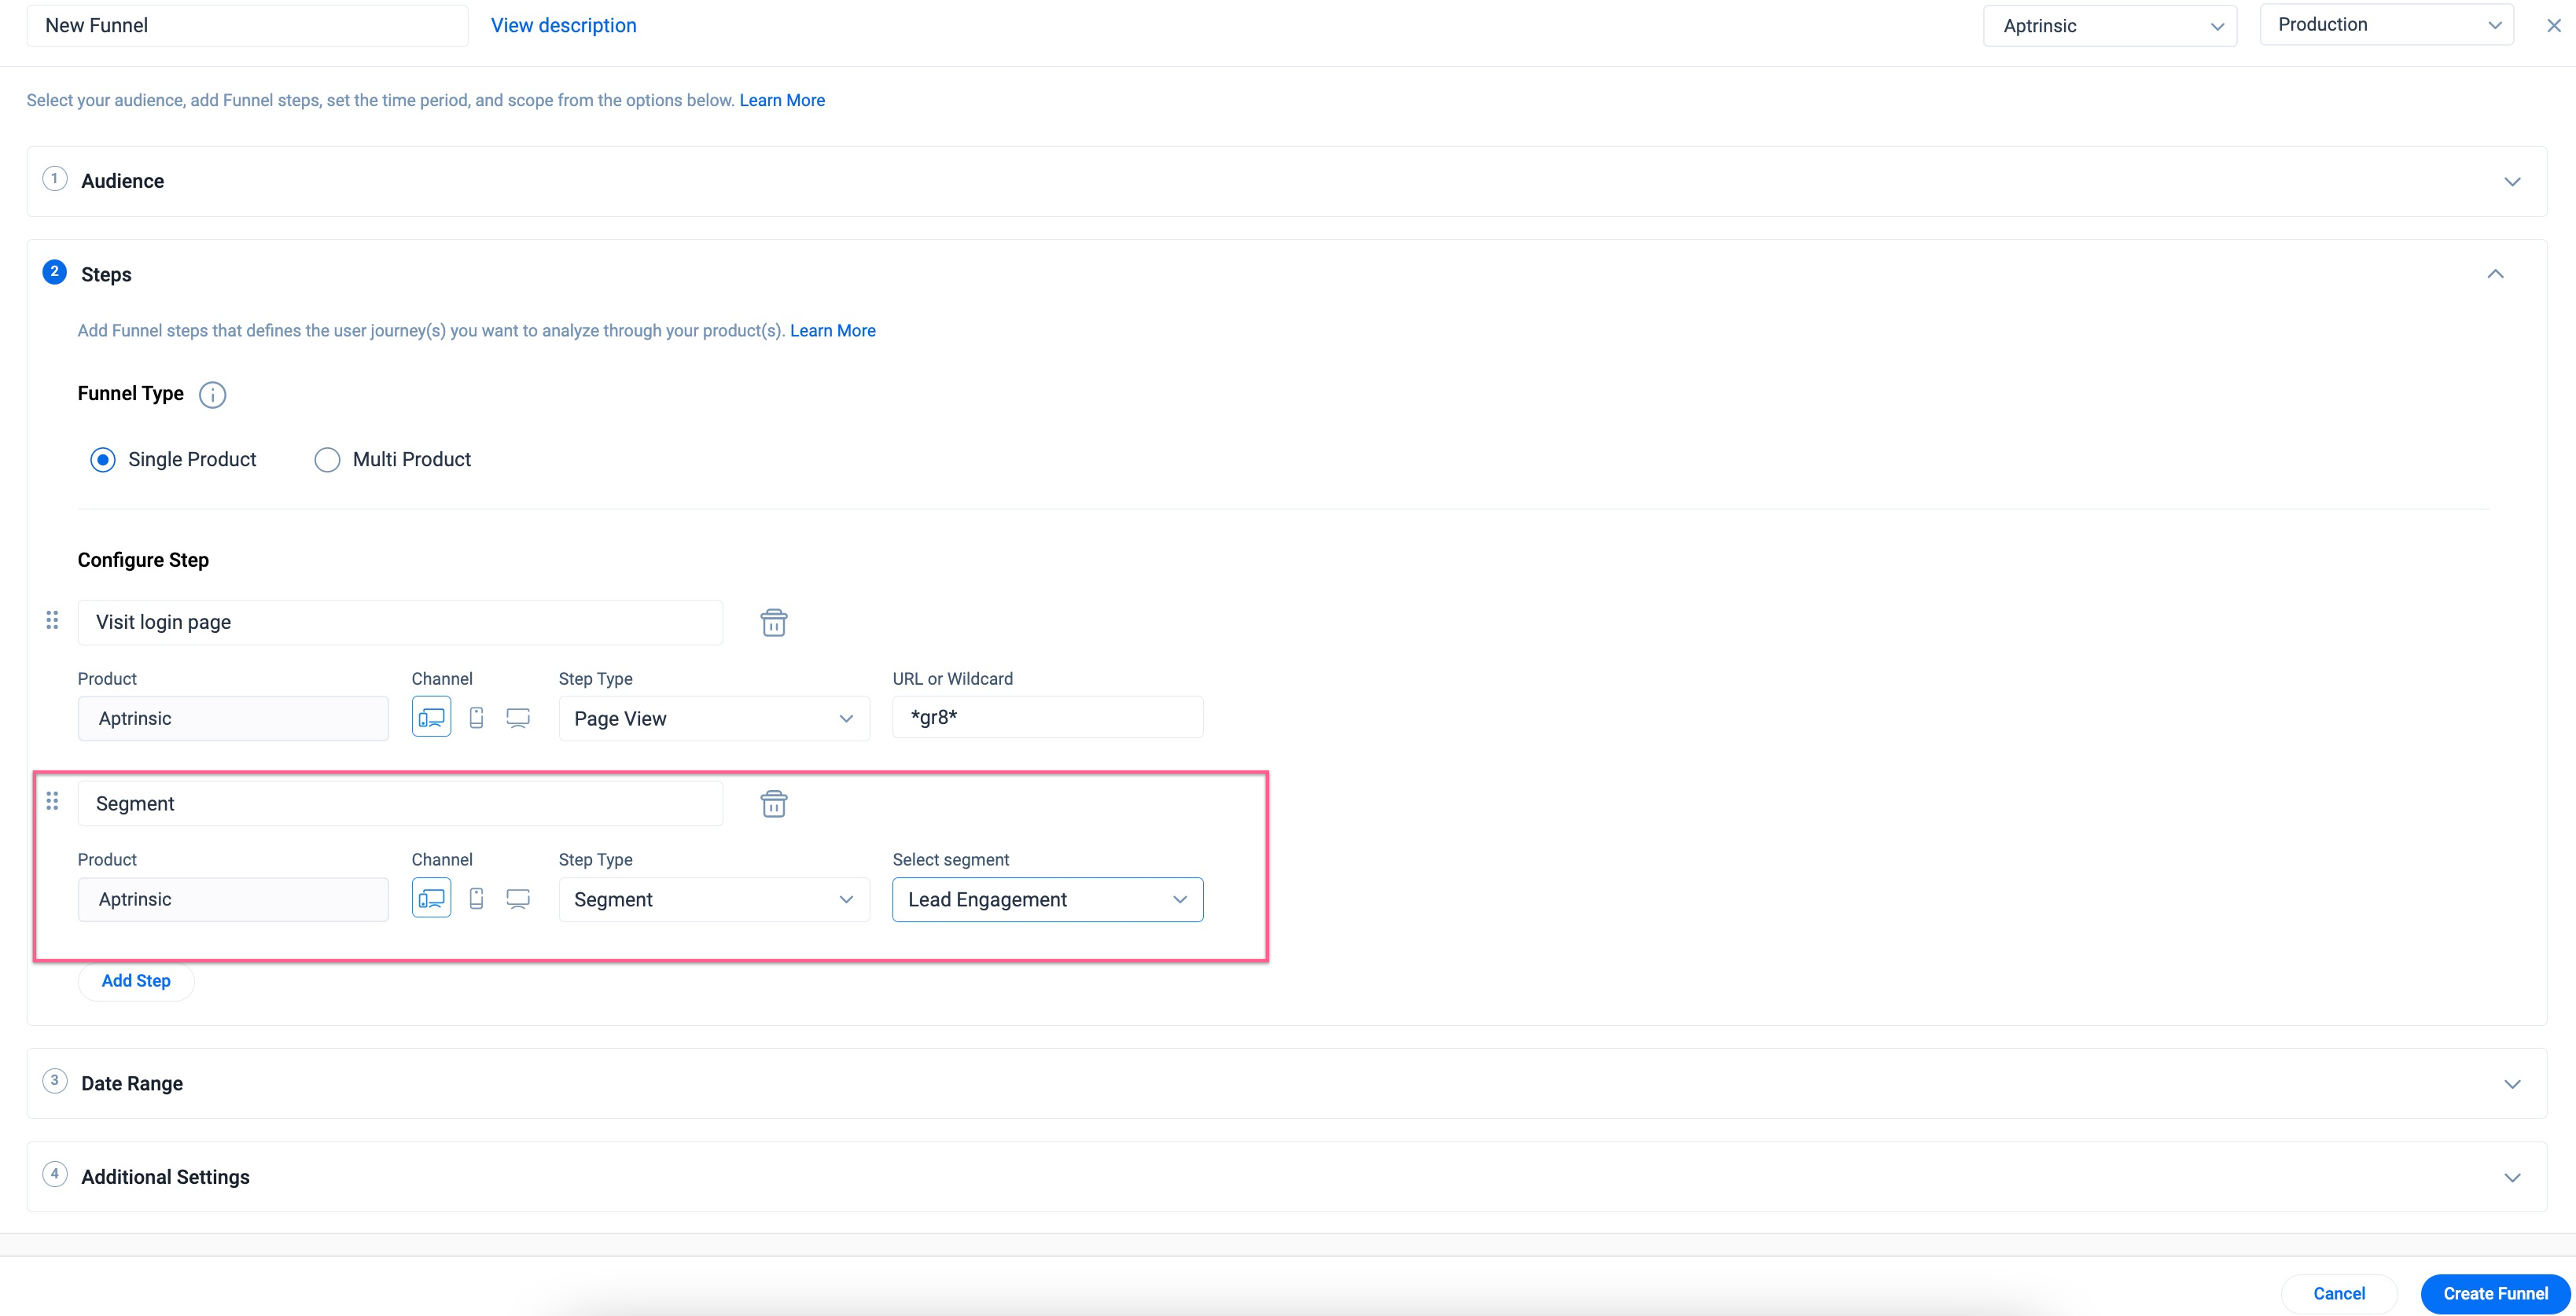
Use Segments in Funnel
Use Segments to create Funnel reports for a unique set of audience based on common attributes or characteristics. The segment option helps you further narrow down the audience to address specific use cases.
Example Business Use Case:
Consider that you are creating a Funnel report to analyze new users. You can add step criteria(s) and choose specific page views and features. This report is aimed at analyzing the steps where the users drop-off. You can now create a ‘Signed Up’ segment (or any date based field as a segment matching event by using 'less than 1 day' as the filter criteria) and use this as a Funnel step.
To use the segment option:
- In the Steps section, click on the Add Step.
- From the Step Criteria dropdown, select Segment.
- Select the segment that you created from the Select Segment dropdown list.
Note: Only Real-time segments are available to select in the steps of the funnel.
Add Multiple Features to a Funnel Step
-
A feature match Funnel step can now include multiple features. This eliminates the need to create multiple Funnels.
Example Business Use Case: You can analyze a cohort of users who have used a set of newly launched features and are then requested to provide feedback through a Customer Effort Score (CES) survey. In the example given below, step three consists of multiple features selected together as a single Funnel step.
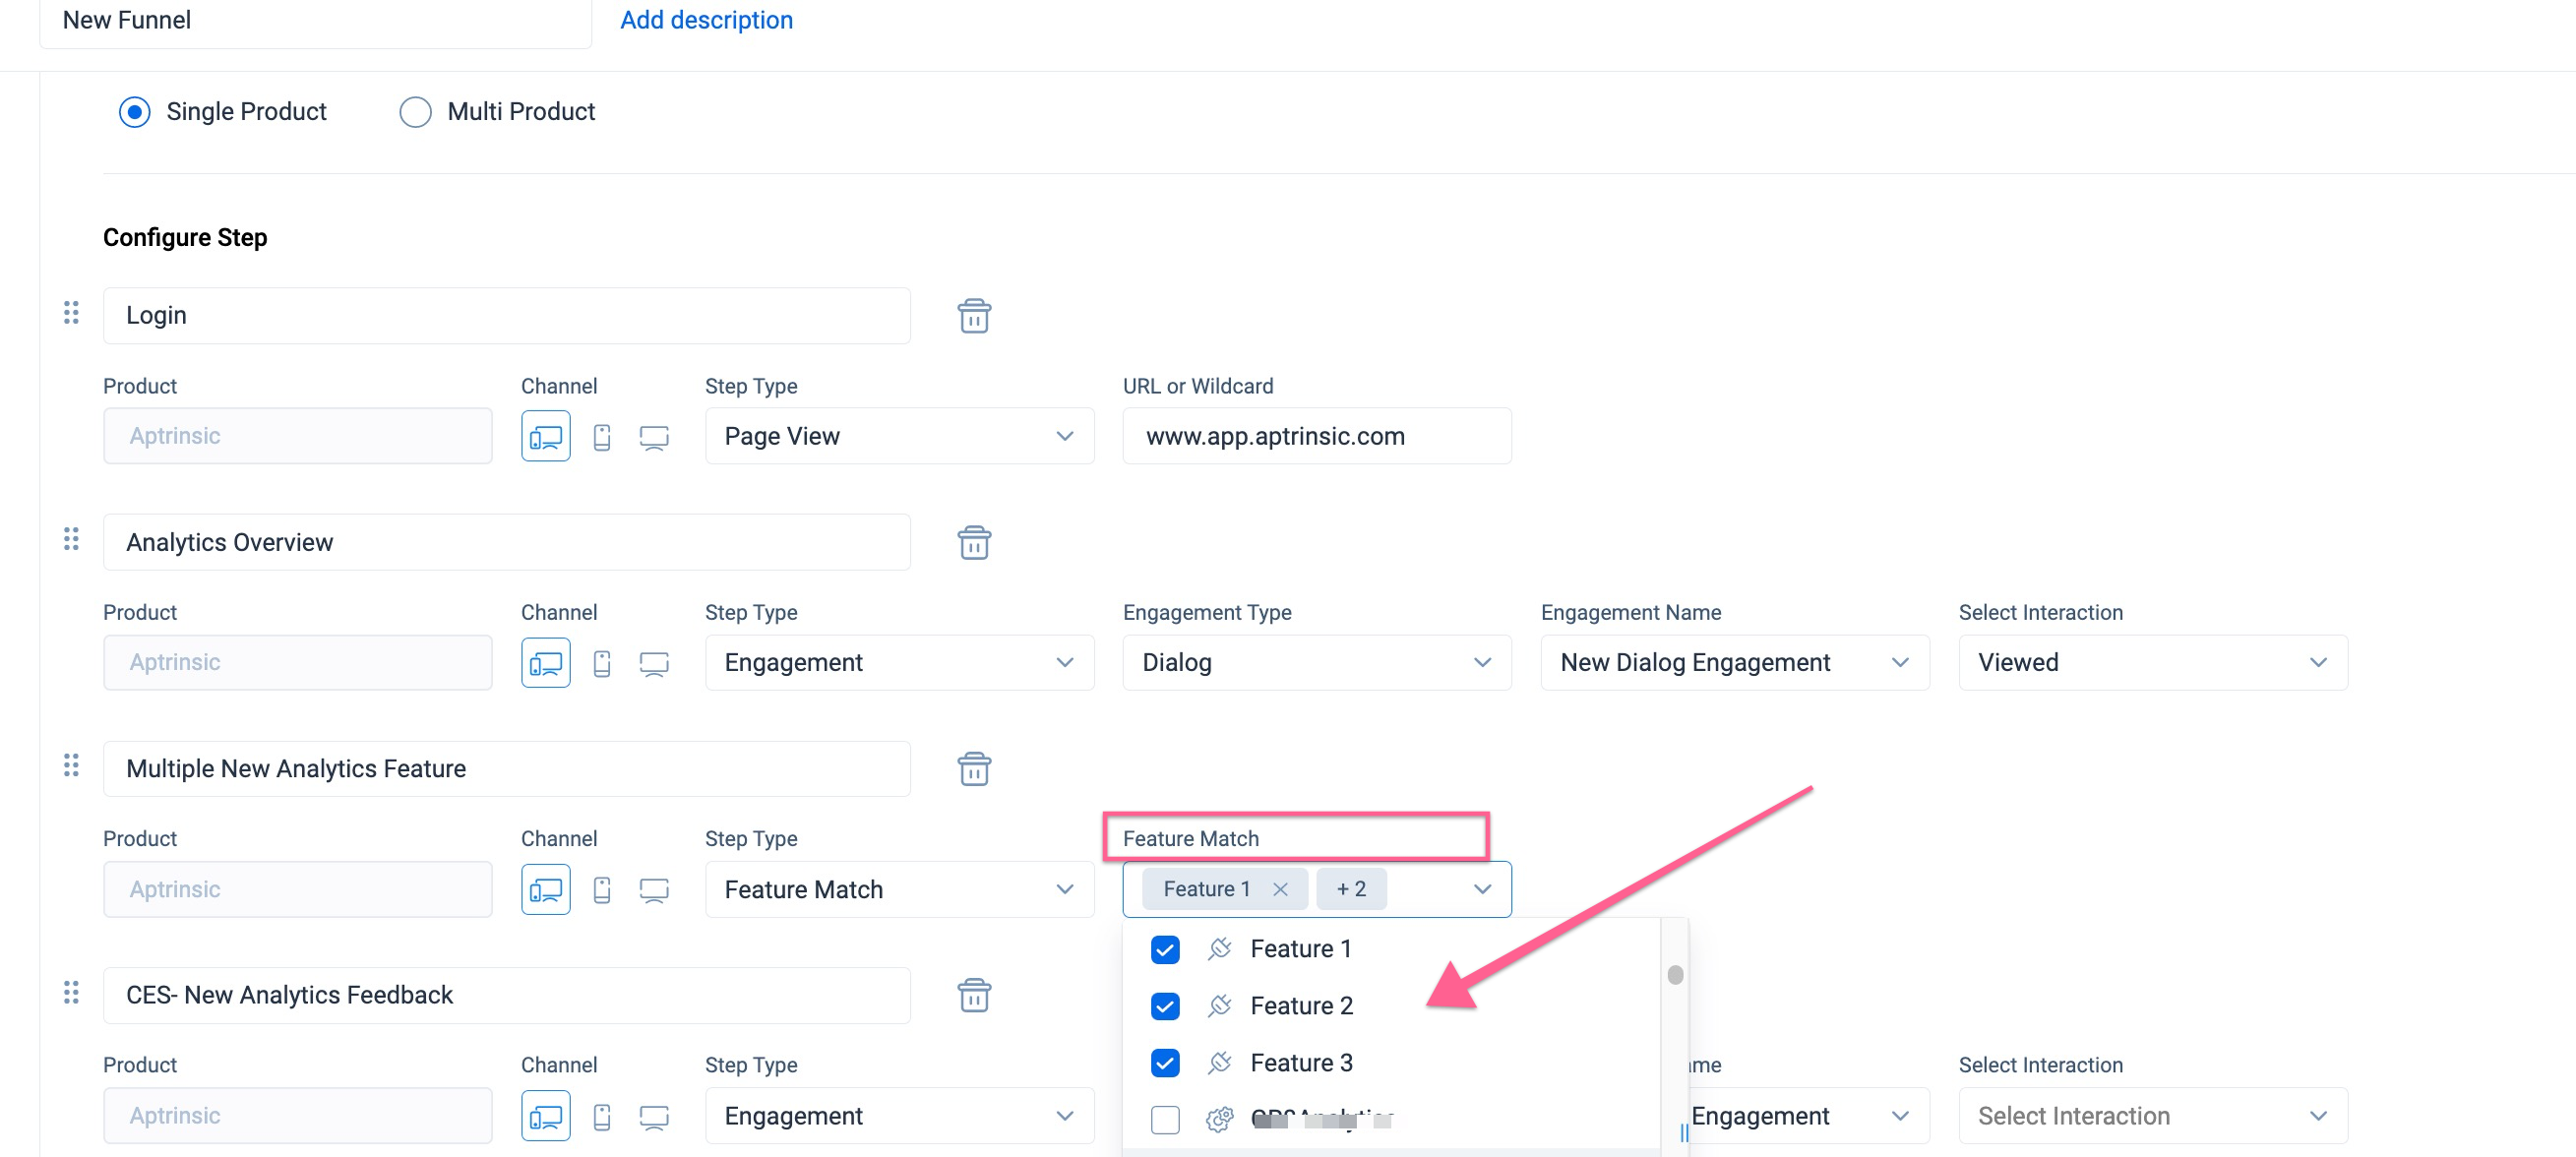
The Funnel analytics, once generated, helps you understand how many of the users have used the intended set of features and then provided CES feedback.
Use Historical Tracking Attributes
The Historical Tracking of attributes feature is available for Funnels to specify the audience of the Funnel.
Example Business Use Case: Consider you have configured a Funnel to understand user journeys of users or accounts who moved from Standard subscription to Premium subscription. Given that the SubscriptionType is a historical tracking Account attribute, using the historical data and current data it is now possible to filter the specific cohort of users.
![]()
For more information on how to enable historical tracking of an attribute, refer to the User and Account Model article.
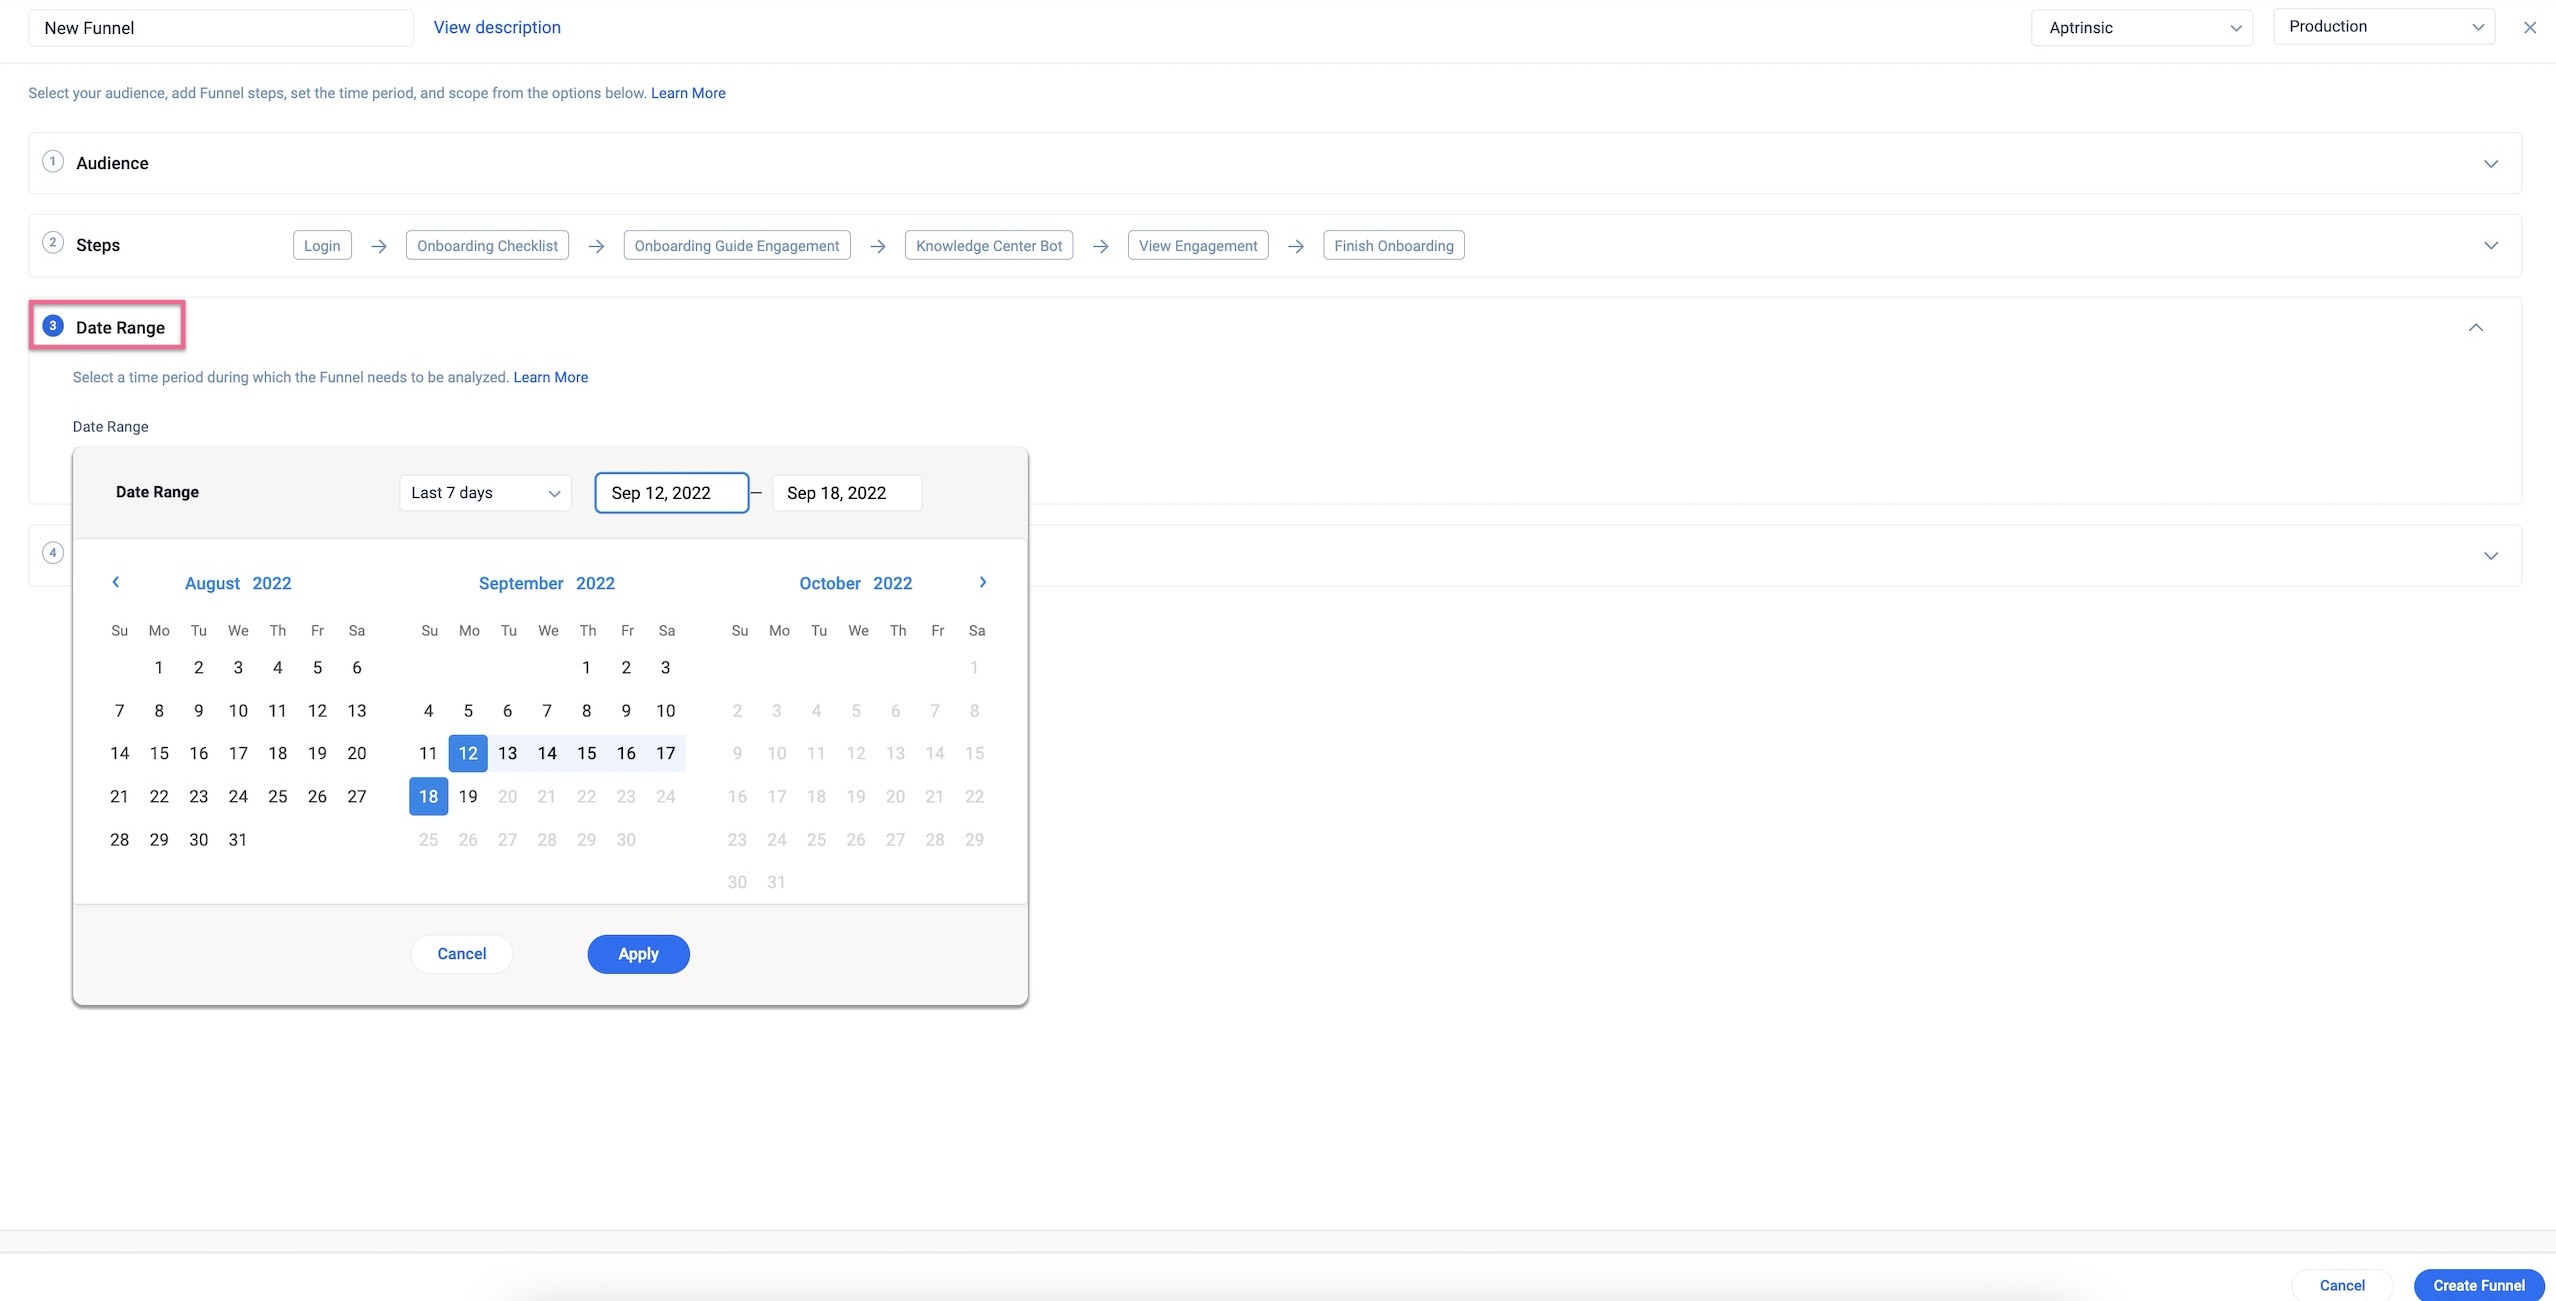
Date Range
In the Date Range section, select a time period for the Funnel.
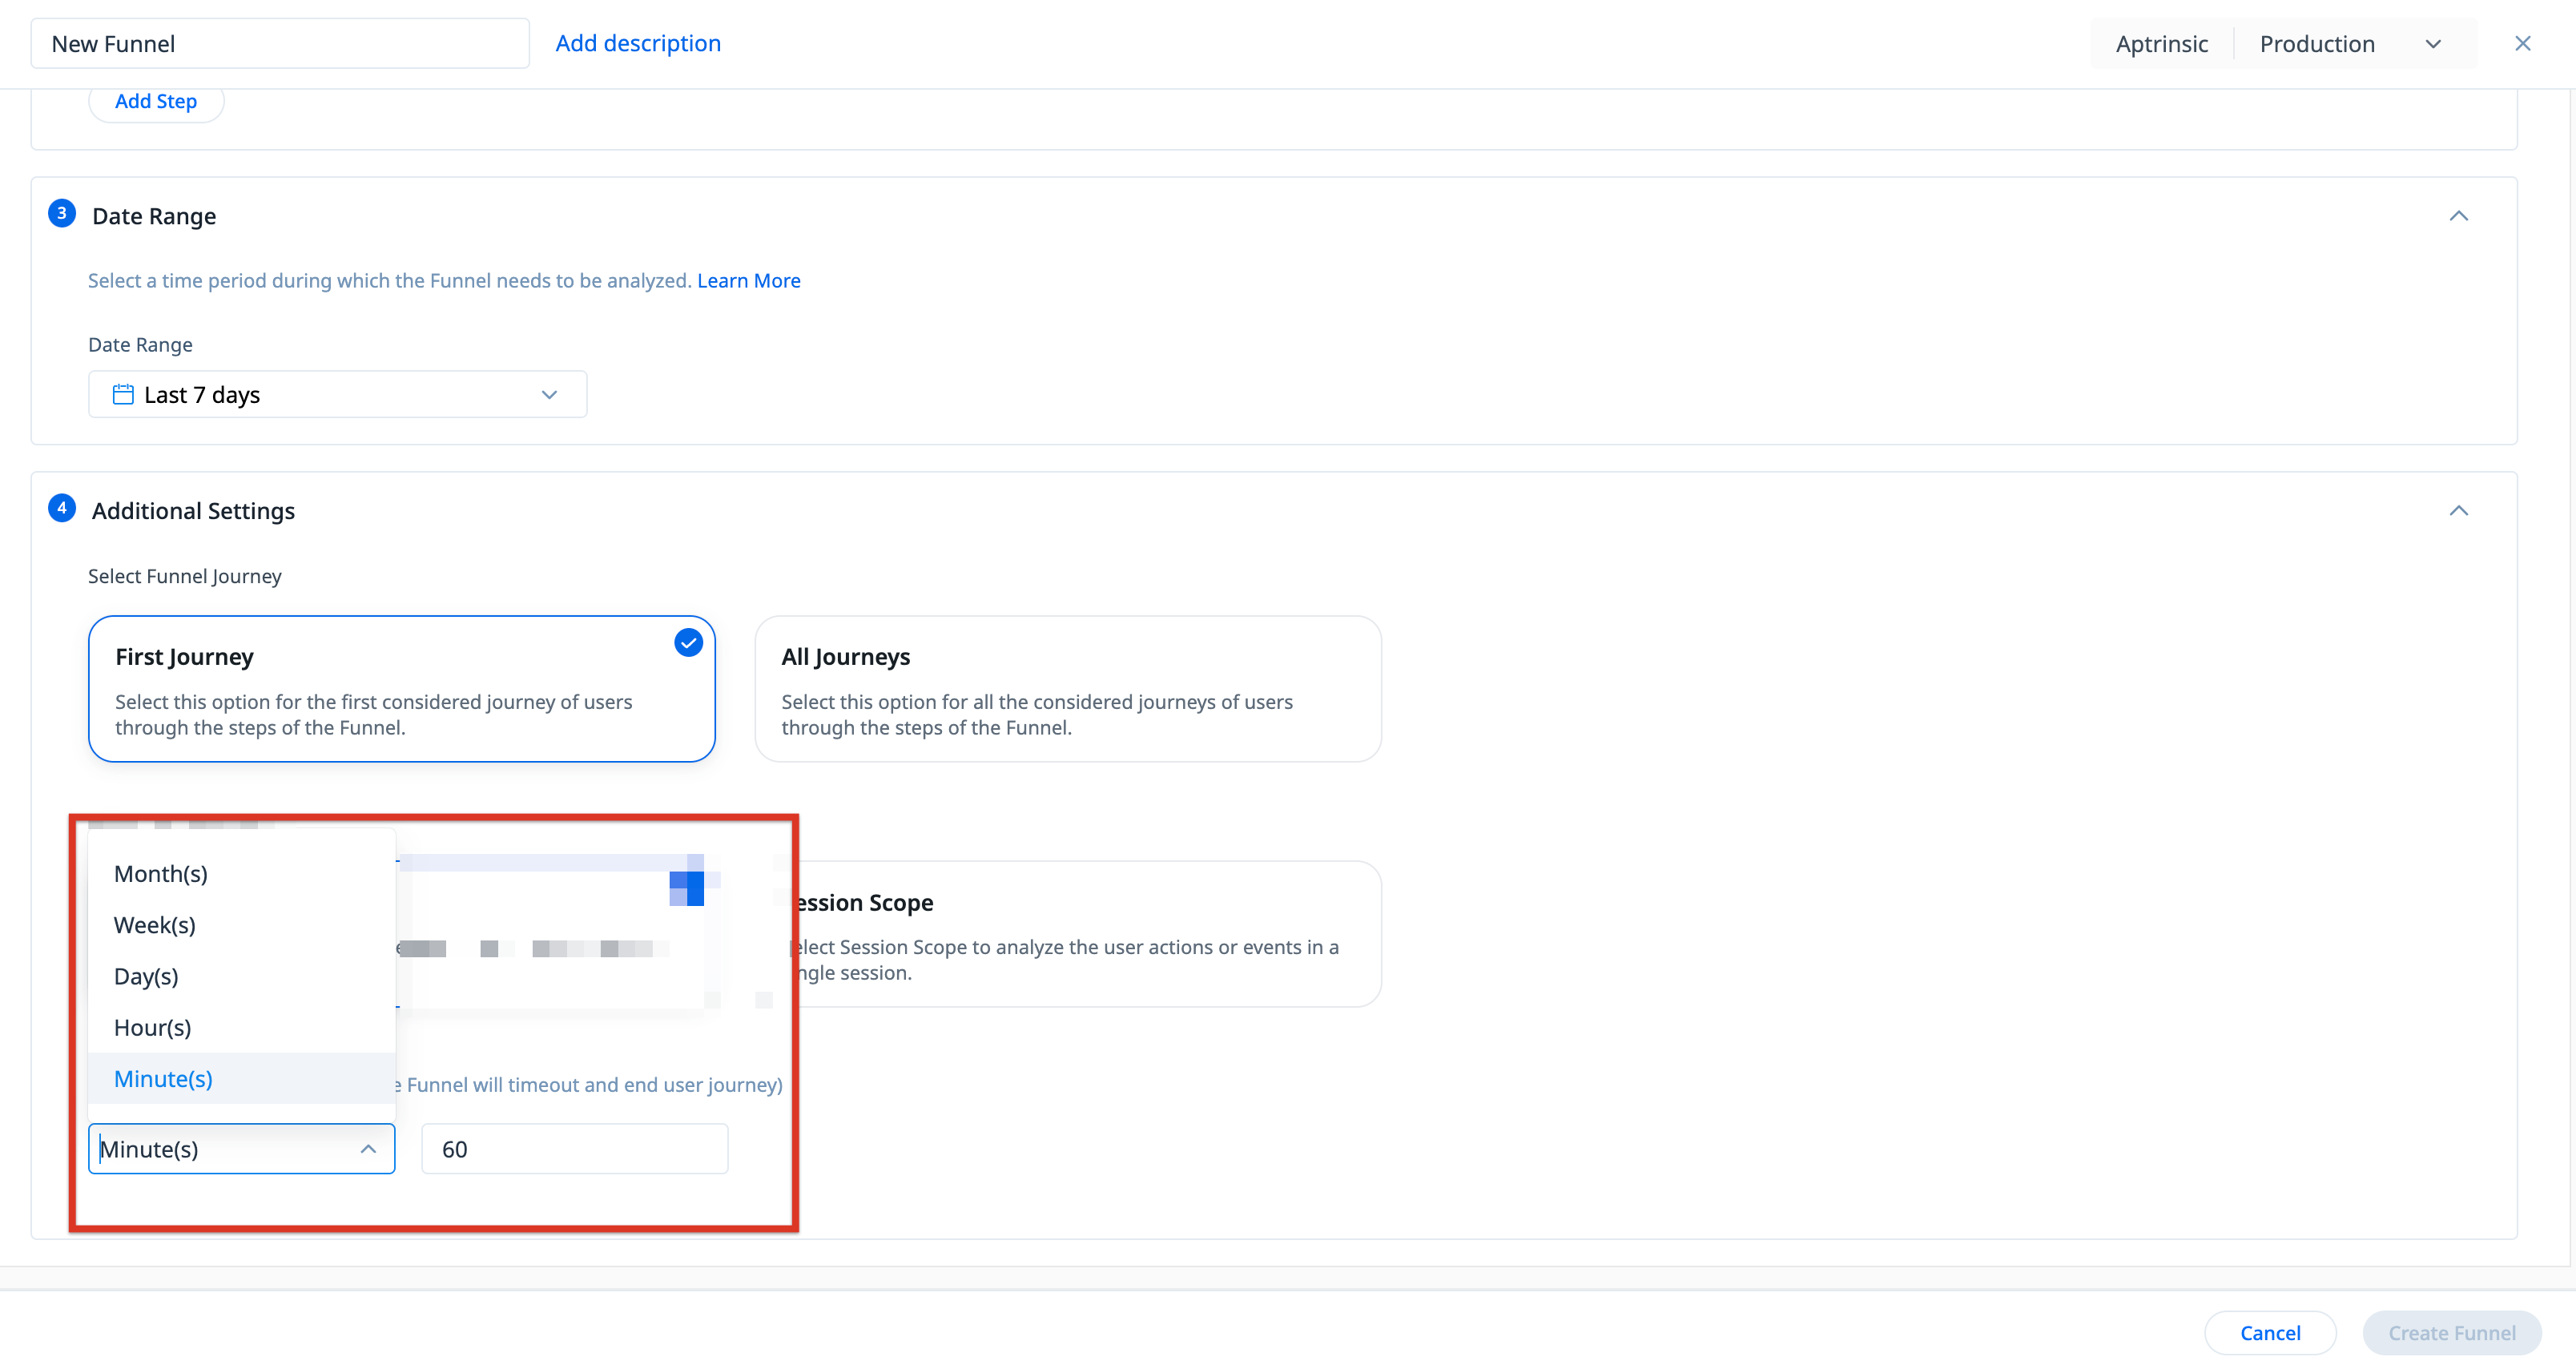
Additional Settings
The following Additional Settings can be configured:
Funnel Journey
A Funnel journey represents the path a user takes through each step of the funnel. Select the type of funnel analysis from the two options below:
- First Journey: This option provides insights on the first time users go through the defined steps of the funnel. It analyzes the initial journey users take through each defined step of the funnel, from start to finish, allowing you to focus on their first-time behavior. This is useful for identifying the immediate barriers or pain points in the user experience for new users.
- All Journeys: This option goes beyond the first journey and captures the further journeys as well. A user can have one or more journeys through a funnel. This is beneficial for understanding user behavior across multiple journeys, providing insights into how users evolve with each subsequent journey. With this, you can track if completion rate improves over time, enabling a more comprehensive view of user engagement.

Funnel Scope
Select the scope of the Funnel from the following options:
- User Scope: Select User Scope to analyze the user actions for the selected audience across sessions.
Note: Gainsight PX considers the first occurrence of a complete journey, within the specified timeout, irrespective of the number of sessions a user takes.
- Session Scope: Select Session Scope to analyze the user journey in a particular session.
Note: Gainsight PX considers the first occurrence of a complete journey, within a single session and within the specified timeout.

Timeout Value
Specify the time duration within which the users are expected to complete all the Funnel steps.
Funnel Reports
Based on the Funnel Journey selection while creating the funnel, the funnel report displays data for the first considered journey of the user through the funnel, or all the user journeys through the funnel.
For more information on how PX computes the steps of the funnels, refer to the Funnel Steps Consideration section.
The following screenshot displays a funnel report created with First Journey selected under Additional Settings:
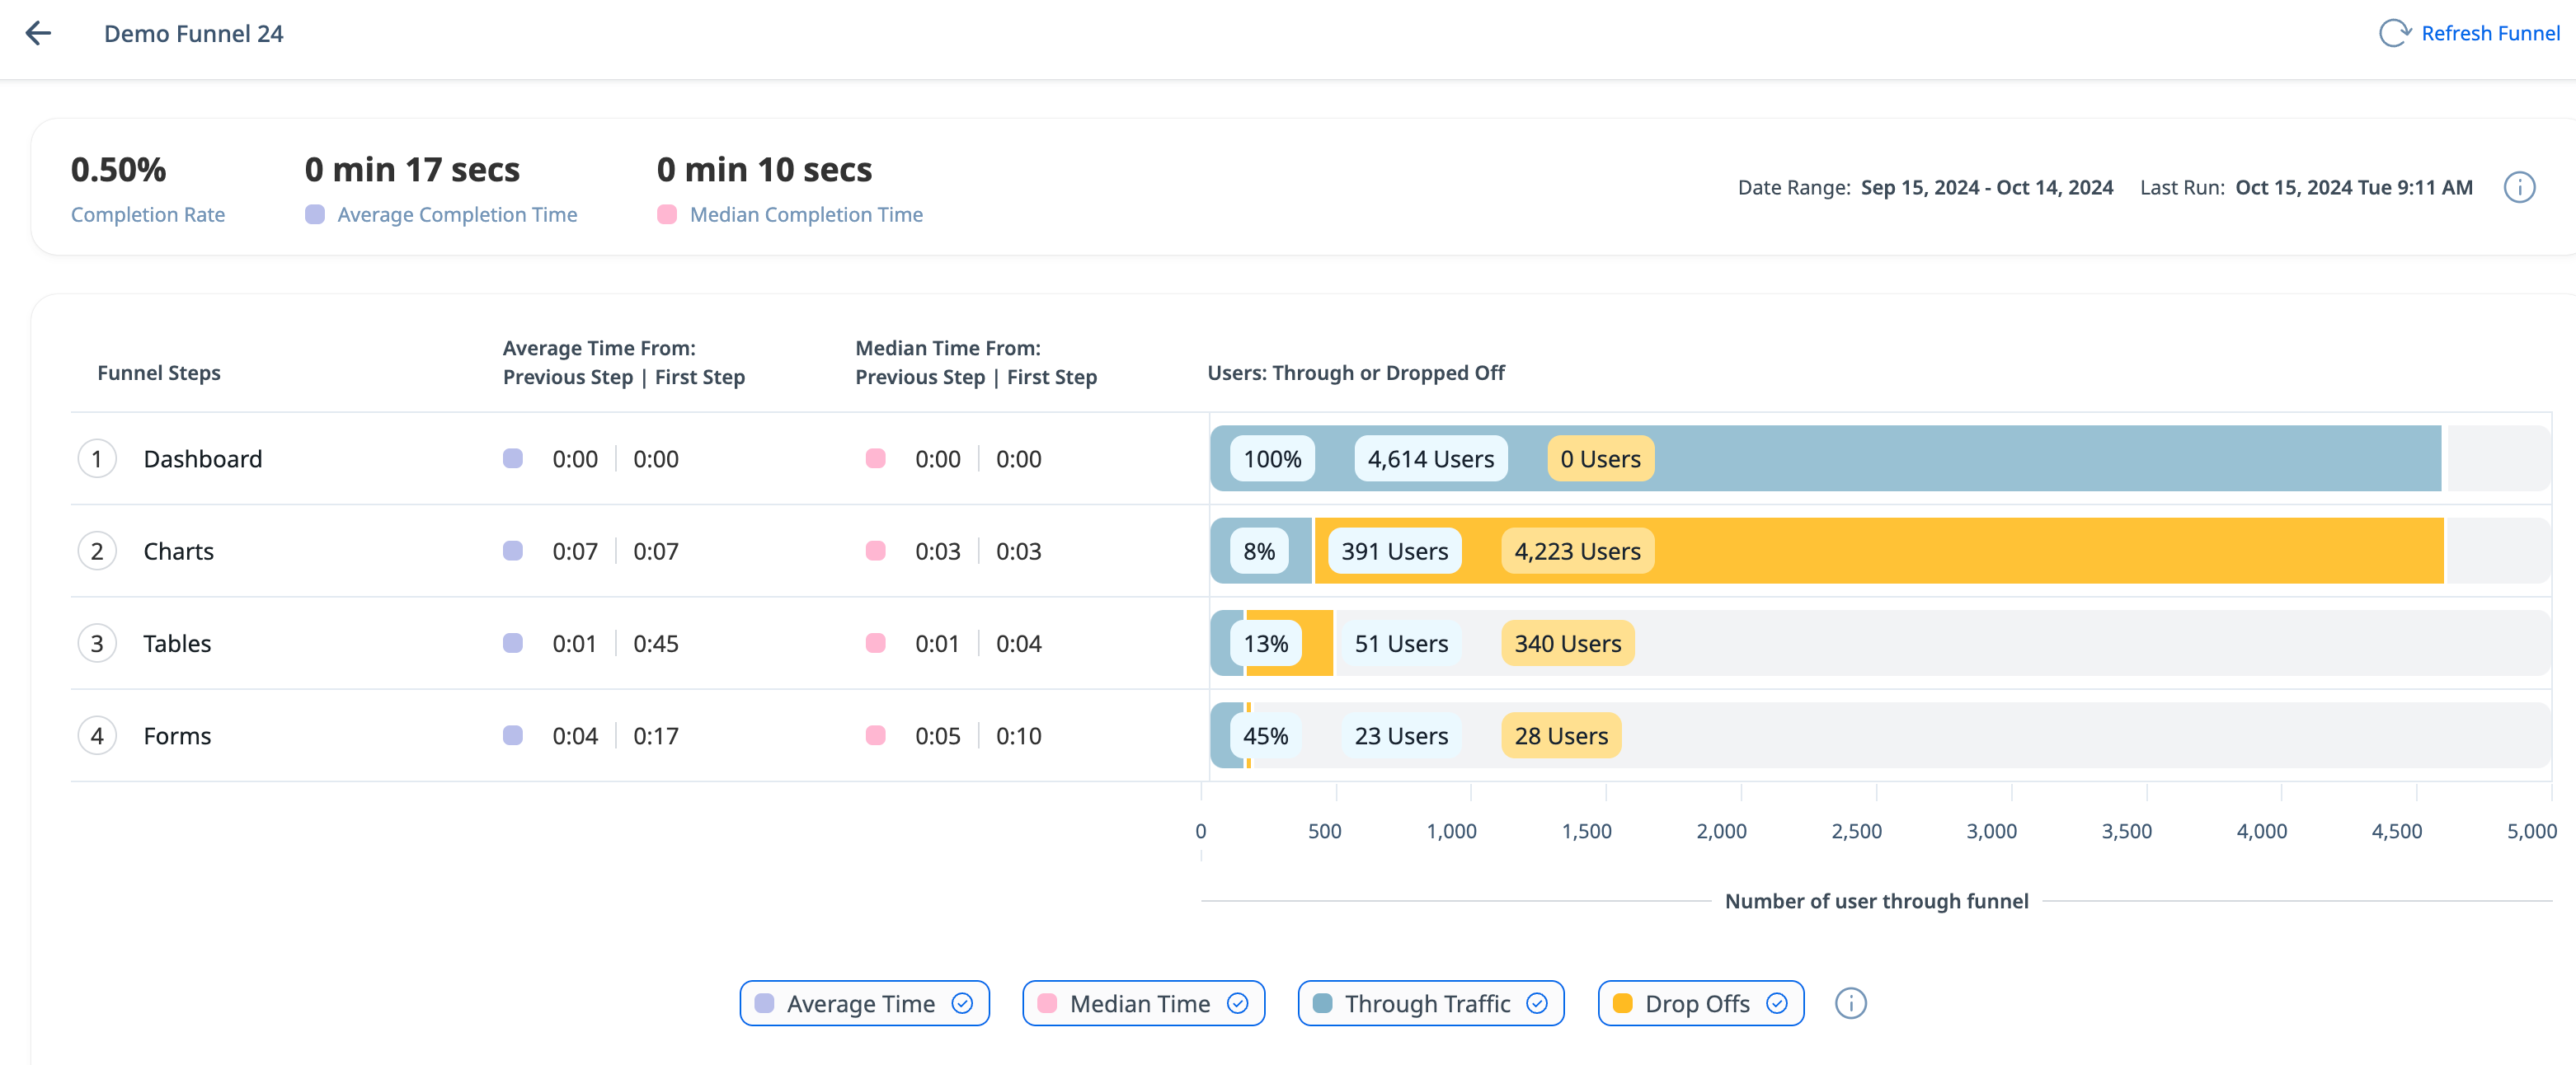
A First Journey funnel report display the following metrics:
- Average Time From Previous Step : Displays the average time taken by the users to reach the current step from the previous step.
- Average Time From First Step: Displays the average time taken by the users to reach the current step from the first step.
- Median Time From Previous Step: Displays the median time taken by the users to reach the current step from the previous step. In other words, the median time is the 50th percentile of all the times from the previous step.
- Median Time From First Step: Displays the median time taken by the users to reach the current step from the first step. In other words, the median time is the 50th percentile of all the times from the first step.
The following screenshot displays the same funnel report with All Journeys selected under Additional Settings:

An All Journeys funnel report display the following metrics:
- Average Time From Previous Step : Displays the average time taken by the user to reach the current step from the previous step across the user’s journeys.
- Average Time From First Step: Displays the average time taken by the user to reach the current step from the first step across the user’s journeys.
- Median Time From Previous Step: Displays the median time taken by the user to reach the current step from the previous step across the user’s journeys. In other words, the median time is the 50th percentile of all the times from the previous step.
- Median Time From First Step: Displays the median time taken by the users to reach the current step from the first step, across the user’s journeys. In other words, the median time is the 50th percentile of all the times from the first step.
Analyze Funnel Reports
Analyze the Funnel Reports using the following parameters:
- Through Traffic and Drop-Offs
- Time from First Step and Time from Previous Step
- Completion Rate and Completion Times
Note: Each of the below metrics can be viewed for users (in case of First Journey) and journeys (in case of All Journeys). For representation purposes, we have used users as examples for all the below instances.
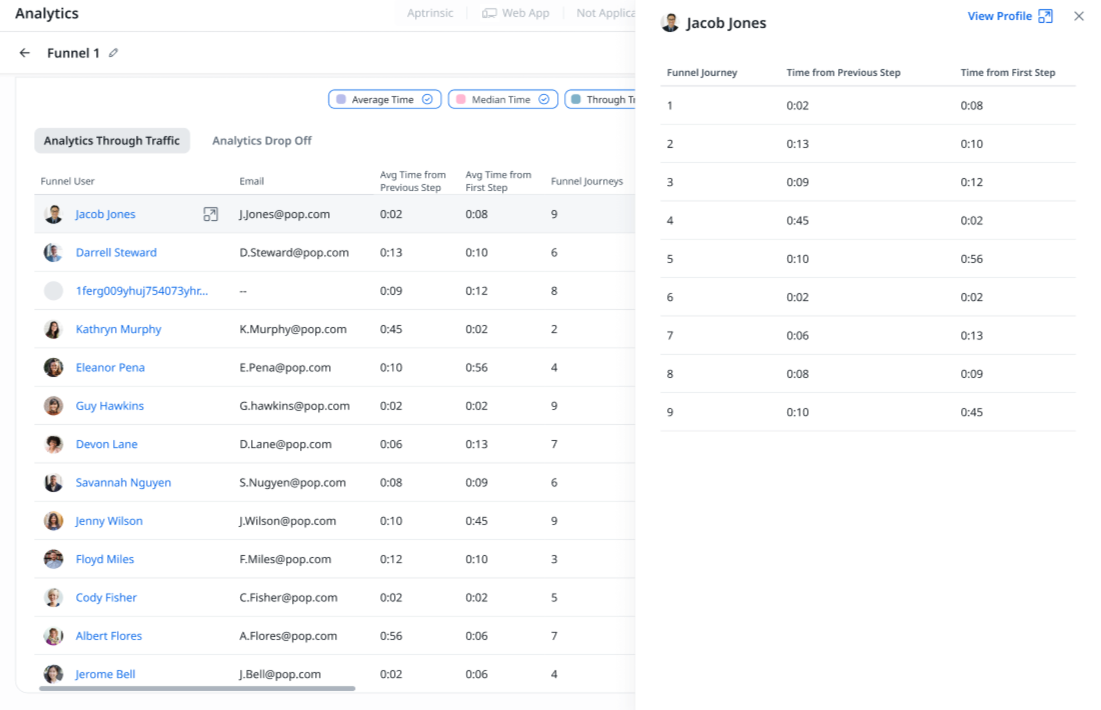
User Information
The Funnel report allows you to view the list of users that are tracked in each step. You can further toggle between users that went through, or dropped off the particular step.
In case of an All Journeys funnel, the report provides the following additional metrics:
- Farthest Step (Last Journey): Indicates the farthest the user traveled in the last journey of the funnel.
- Funnel Journeys: The total number of times the user has gone through the funnel, representing either the number of completed journeys or the total of completed journeys plus drop-offs..
Click a user’s row to view the detailed information on the time spent in each journey of the selected step in the Funnel. In the following example, the user went through the funnel a total of 9 times.
Through Traffic and Drop-Offs in Funnel
The Funnel Report displays the Through Traffic and Drop-offs at each step.
- Through Traffic is the number of users that successfully reached the current step from the previous step.
- Drop-Offs are the number of users who completed the previous step but dropped off and did not reach the current step of the Funnel.
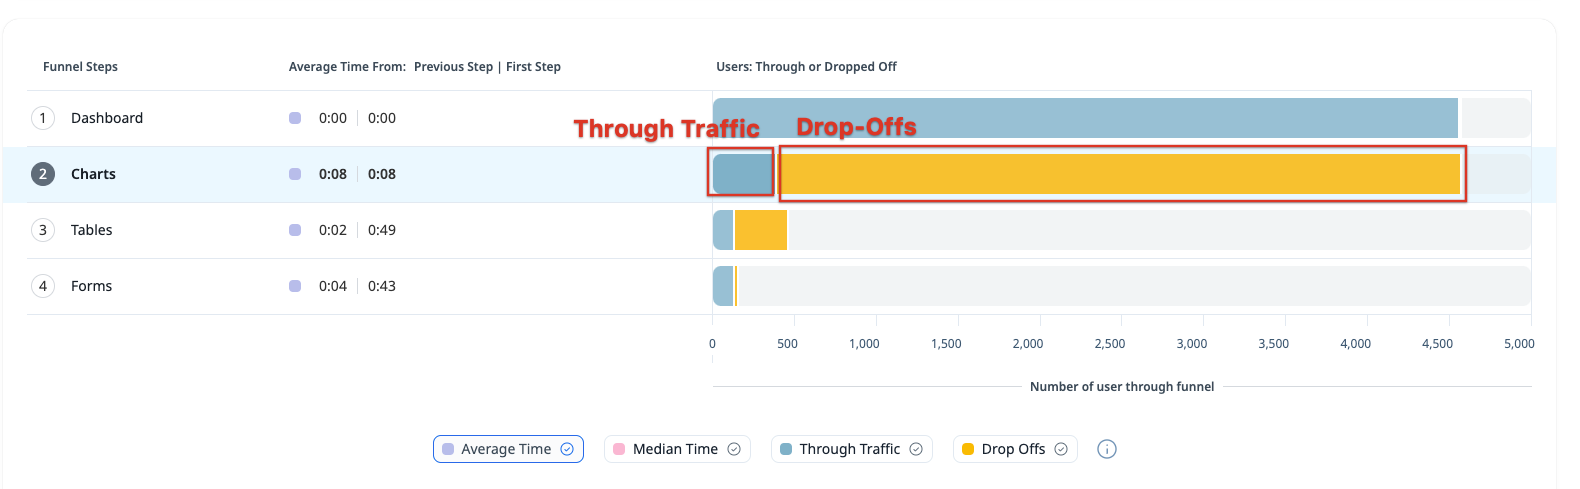
Click the Through Traffic and Drop Offs legends to view counts of each, respectively, along with a delta percentage for through traffic.

In the above Funnel report graph, 4691 users completed the first step of the Funnel. Only 397 of those reached the second step of the Funnel. The remaining 4294 users dropped off from the first step and did not perform the second step. Of the 397 users who completed the second step, only 52 users completed the third step. The remaining 345 users did not perform the third step.
Time from First Step and Time from Previous Step
Depending on the type of the Funnel report, the following time related columns are availaible in the user table:
- First Journey:
- Time From First Step: Displays the average time taken by the users to reach the current step from the first step.
- Time From Previous Step: Displays the average time taken by the users to reach the current step from the previous step.

-
All Journeys:
- Avg Time from First Step: Displays the average time taken by the user to reach the current step from the first step across the user’s journeys.
- Avg Time from Previous Step: Displays the average time taken by the user to reach the current step from the previous step across the user’s journeys.
- Median Time From First Step: The middle value of the times taken by users to reach the current step from the first step, across the user’s journeys.
- Median Time from Previous Step: The middle value of the times taken by users to reach the current step from the previous step across the user’s journeys.

Note:
- The Time From First Step and Time From Previous Step columns are not applicable to users that are part of the first step.
Completion Rate and Completion Times
The Funnel report has the three following important metrics highlighted above the graph for quick analysis:

- Completion Rate: The percentage of selected audience that completed all the Funnel steps within the Timeout range.
- Average Completion Time: The average time taken by the selected audience to complete the Funnel steps.
- Median Completion Time: The middle value of all times taken by users from a previous step or the first step, when arranged in order.
Click the Average Time and Median Time legends to turn on or off the summary and step metrics for each value.

Funnel Steps Consideration
Consider a 5-step first journey funnel. Step 1 of the funnel indicated by 1, step 2 of the funnel indicated by 2 and so on till 5. Session is indicated by [ ]. Timeout is indicated by ||.
Consider a user who has the following funnel steps in their journey: [1,1,1,1,2,2,4,3,4,2,5]. PX uses the following steps (highlighted in bold) for funnel calculation: [1,1,1,1,2,2,4,3,4,2,5]
In the above scenario, PX considers the following:
- The first occurrence of each funnel steps, within the timeout period
- The sequence of the funnel steps (1 to 5) is also considered. For instance, the first occurrence of step 4 is ignored because after step 2 of the funnel, the first occurrence of only step 3 is being looked for.
- Within a timeout period, the occurrence of steps that best complete the funnel are considered. For instance, in a funnel [1,2] || [1,2,3], PX considers [1,2] || [1,2,3] and not [1,2] || [1,2,3] despite [1,2] being the first occurrence (as mentioned in point A) because [1,2,3] is a more complete funnel than [1,2].
Following are detailed examples of a 5-step funnel and explanation (with relation to the above points) on how PX considers the steps for User and Session scopes calculation. Assume the funnel is run after all the sessions in each of the examples:
User Scope
| Funnel Steps | Points Considered (from above explanation) |
| [1,2,1,2,3,1,2] | A |
| [1,2,3,5,4,3,5,4,2] | A, B |
| [1,2] [1,2,3] | A |
| [1,2] [1,5,3] [2,4,5] | A, B |
| [1,2,3] [4,5] | A |
| [1,2, 3 || 4,5] | A |
| [1,2 || 1,2,3] | A, C |
| [1,2] || [1,2,3] | A, C |
| [1,2,3 || 4,5] || [1,2,3] | A, C |
| [1,2,3 || 4,5] [4,5] | A, C |
| [1,2,3 || 4,5 ] || [1,2,3,5,2,4] | A, B, C |
| [1,2] [1,5,3] [2,4,5] || [1,2,3,4] | A, B, C |
| [1,2,3] || [1,2,3,4] || [1,3,4,5] | A, C |
| [1,2,3] || [1,2,3,4] || [1,2,3,4,5] | A, C |
Session Scope
| Funnel Steps | Points Considered (from above explanation) |
| [1,2,1,2,3,1,2] | A |
| [1,2,3,5,4,3,5,4,2] | A, B |
| [1,2,3 || 4,5] | A |
| [1,2 || 1,2,3 || 1,2,3,4 || 1,2,3,5] | A, C |
| [1,2 || 1,2,4,3,1,2 || 1,2,4,3,2,3,1] | A, B, C |
| [1,2 || 1,2,3 || 1,2,3,4 || 1,2,3,5,4,5] | A, B, C |
| [1,2 || 1,2,3 || 1,2,3,4 || 1,2,3,5] || [1,2,3,5,4,5] | A, B, C |
An All Journeys funnel would follow the above mentioned for each journey. It would have several completed journeys through all steps and one incomplete last journey if there are drop offs before the final step.
Manage Funnels Reports
The Funnels page under Analytics provides a list of the funnels created per product in your subscription, with important information such as the status, completion rate, average completion time, and more.

For each funnel, click the three-horizontal dots icon to perform the following additional actions:

- Edit: Update the funnel criteria such as audience, steps, date range, funnel journey and scope, and so on. This option is only available to the user that created the funnel.
- View: View the funnel criteria that are set up for the report. This option is only available for reports that are not created by you.
- Clone: Duplicate a funnel with the required changes to the criterias.
- Export CSV: Export a detailed CSV with user information of the selected step of the funnel.
- Share: Share the funnel across other users of the subscription.
- Delete: remove the funnel report from the PX subscription.
Run Funnel Report
Funnels can be periodically computed to keep track of the current state of the Funnel. Click Refresh Funnel to refresh the Funnel data from the last time it was run.
