Gainsight PX Dashboard Overview
This article explains the different categories of dashboards, different actions that can be performed on dashboards, and various widget configurations.
Overview
Dashboards are a powerful tool to provide quick insight into different key metrics related to product QBR, growth, and adoption. Users can also create their own unique dashboard to access the metrics that matter to them, at a glance.
Dashboard Permissions
Once you create dashboards, you can share them with users across the subscription by clicking the share icon to view and edit the live dashboards to which they have access.
Gainsight PX offers the following three dashboard permissions.:
- Private
- Public
- Give Access to Specific Users
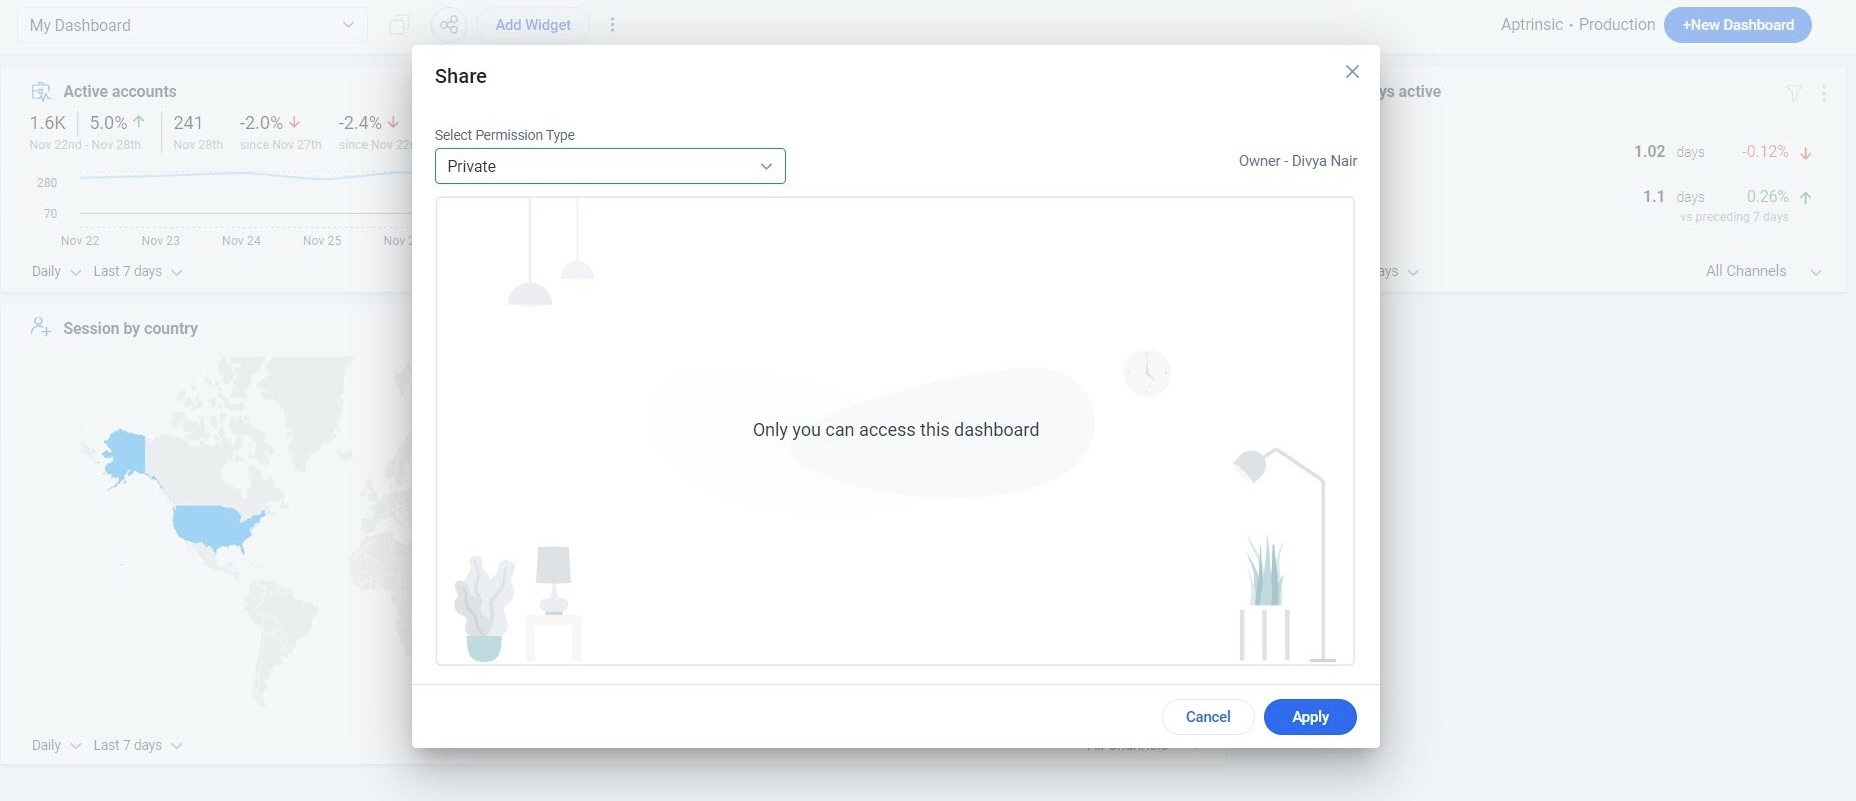
Private
All the dashboards created by you are listed under this category. Only you can view, edit, and delete the private dashboards. Set this permission type by selecting the Private option from the Select Permission Type dropdown.
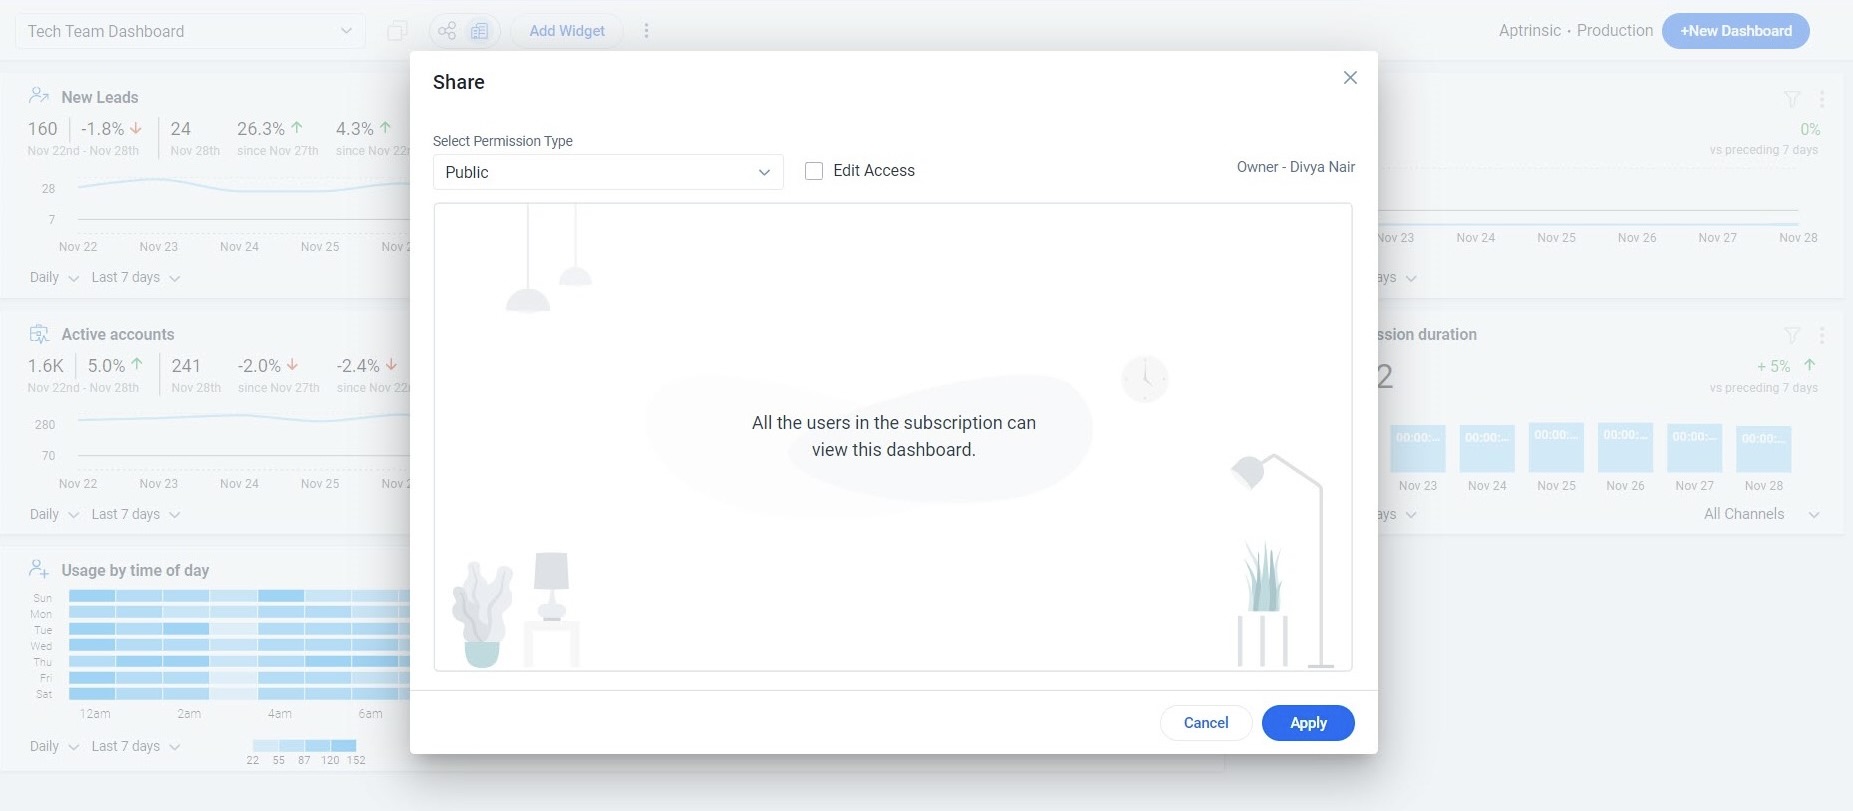
Public
Assign the Public permission to a dashboard if you want the dashboard to be accessible to all the users in the PX subscription. By default, a dashboard is created with Public permission. To change any other permission type of a dashboard to Public, select the Public option from the Select Permission Type dropdown.
Note: When you enable Edit Access, all the users in the subscription can edit the dashboard.
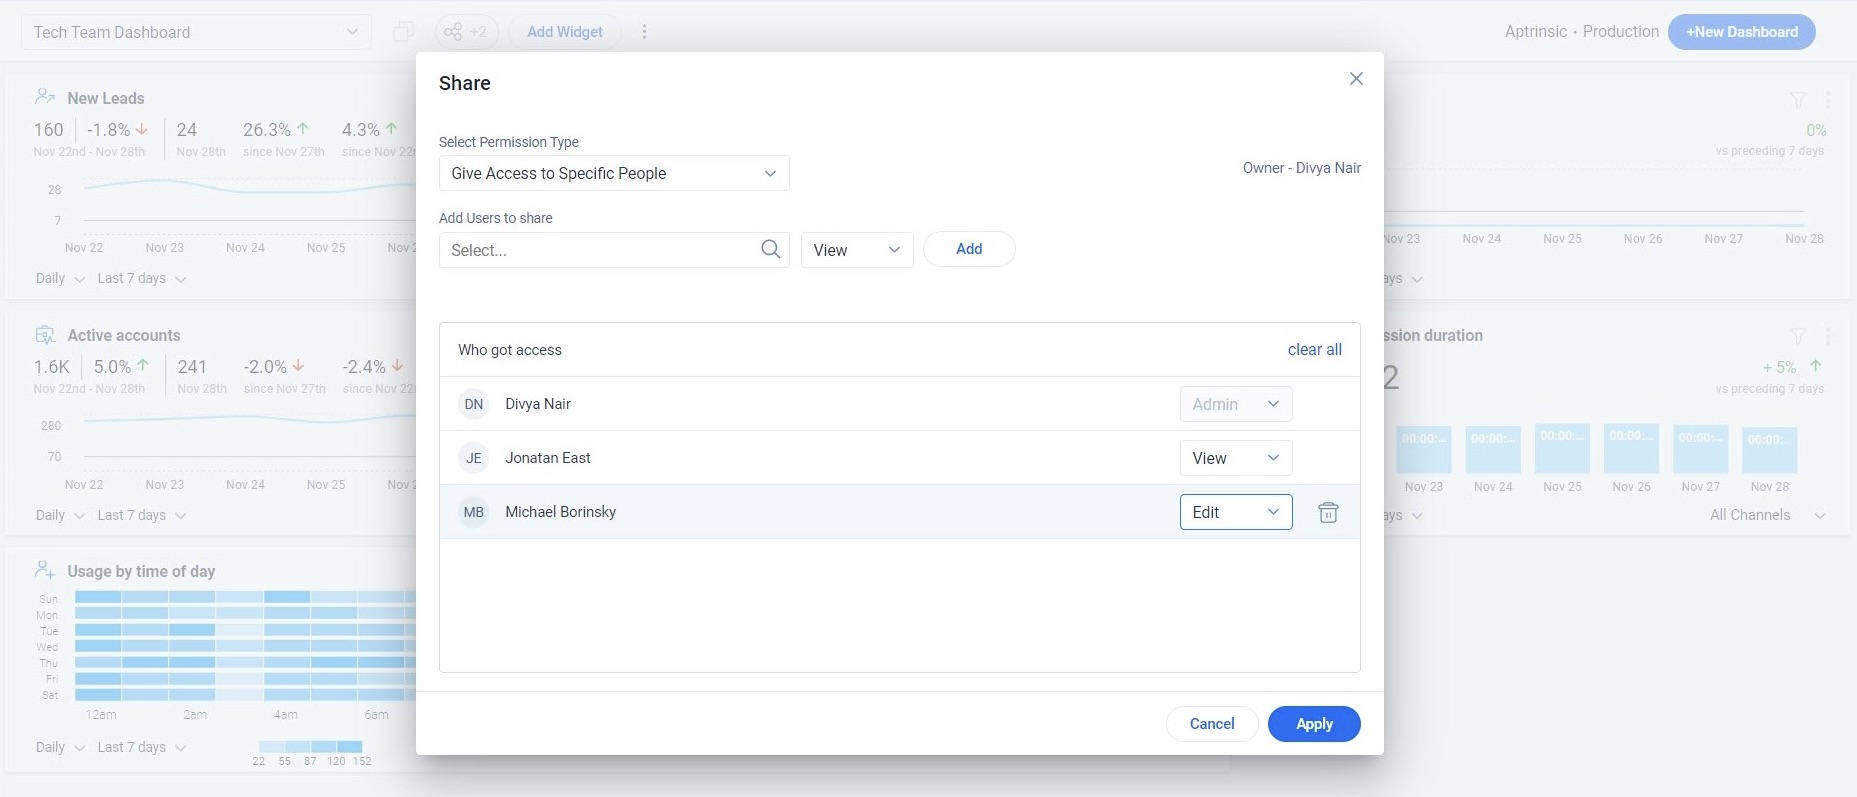
Give Access to Specific People
Assign access to specific people using this permission type. You can select the required users for sharing the dashboard from the Add Users to share dropdown. You can select view/edit access permission for each user and also delete any user from the shared list.
Note: The dashboard owner's name and permission details are displayed when you hover over the Share icon in the Dashboard Home page.
Actions on Dashboards
Gainsight PX allows you to create, maintain, and use multiple Dashboards effectively. The various actions that can be performed on dashboards are:
- Create Dashboard: For more information, refer to the Create Dashboard section of the Configure PX Dashboards article.
- Add Widgets to Dashboard: For more information, refer to the Add Widgets to Dashboard section of the Configure PX Dashboards article.
- Compare Widgets: For more information, refer to the Compare Widgets Data section of the Configure PX Dashboards article.
- Export Dashboard: Export PX dashboards or individual widgets as a PDF or PNG file. For more information, refer to the Configure PX Dashboards article.
- Update dashboard: For more information, refer to the Update Dashboard section of the Configure PX Dashboards article.
- Clone Dashboard: For more information, refer to the Clone Dashboard section of the Configure PX Dashboards article.
- Remove Dashboard: For more information, refer to the Remove Dashboard section of the Configure PX Dashboards article.
Interact through Dashboard
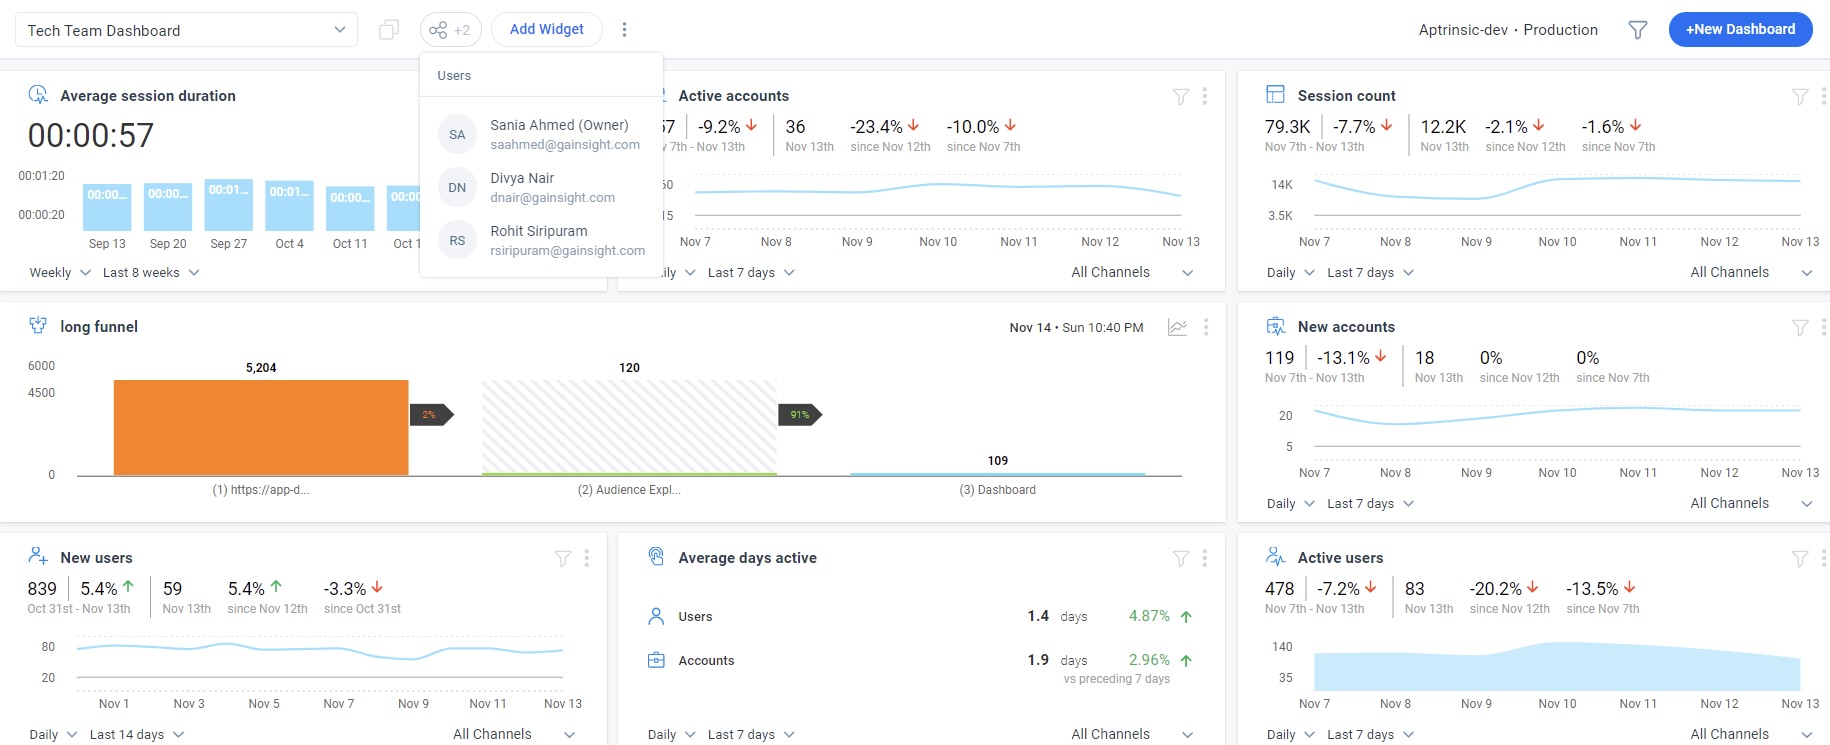
Hovering over certain sections in Dashboards reveals additional information. For example,
- the Active users and Session count on the dashboard provide more specific results as you hover left to right.
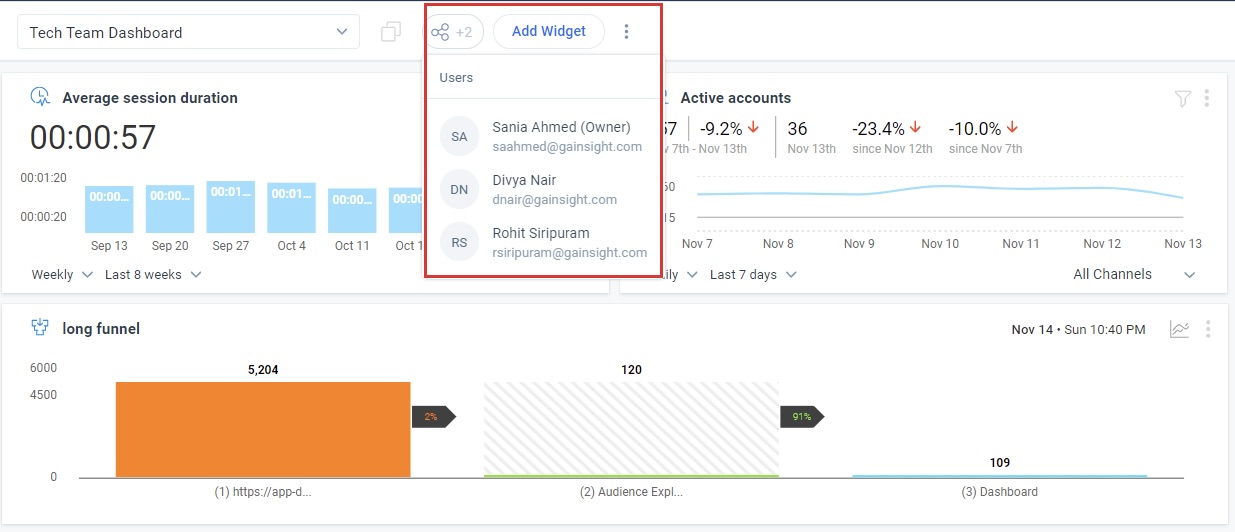
- The info icon provides the following details:
- Owner of the dashboard.
- Multiple products in the dashboard, with the count of the widget from each products.
- The environment for example, Production, QA and so on.
- Dashboard Description.
.jpg?revision=1)
Widget Customization
Each widget can be configured, cloned, and deleted. While configuring you can decide what type of graph you want to select.
Usage Time Scope
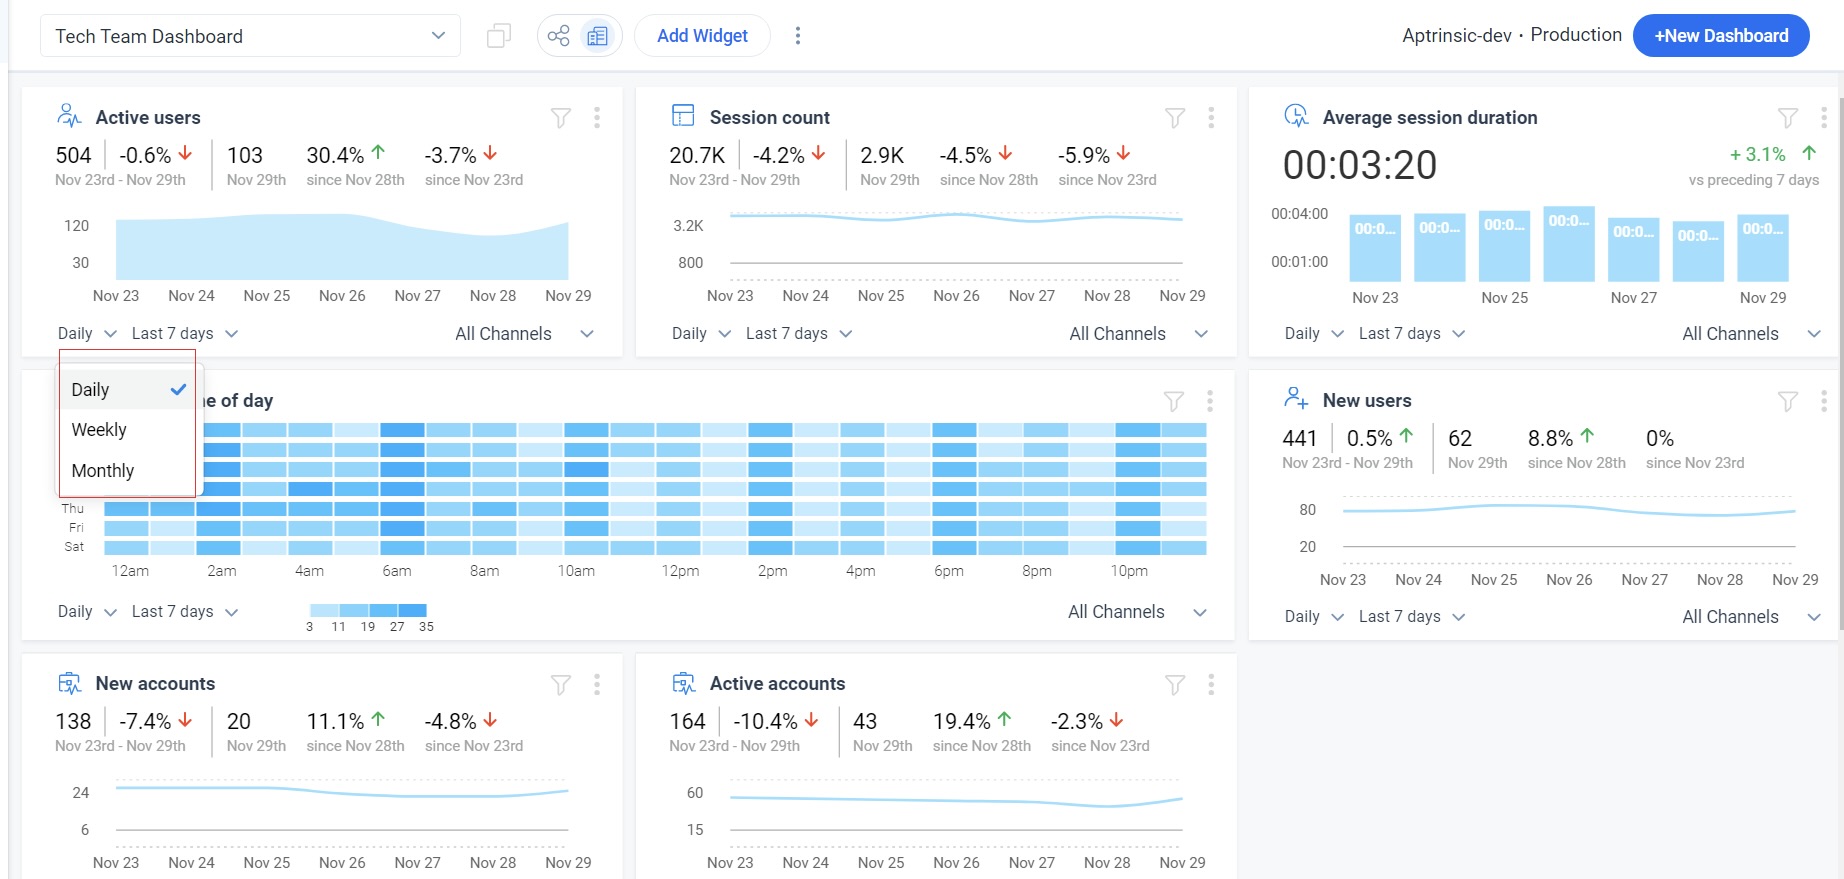
You can select the option to see the update Daily/Weekly/Monthly. You can even customize the data to produce the report/graph.
The image below shows a widget for Active users. When you select the Daily frequency, a unique user’s login count is set to 1, irrespective of the number of logins in a day. Similarly, if you select the Weekly frequency, a user’s login count is set to 1, irrespective of the number of logins throughout the week.
Each widget also compares the existing data with data that existed in the same preceding time period. For example, if you have set a time frame to the Last 7 days, the widget displays data for the last 7 days and also compares this data with the preceding 7 days and provides a percentile increase or decrease value.
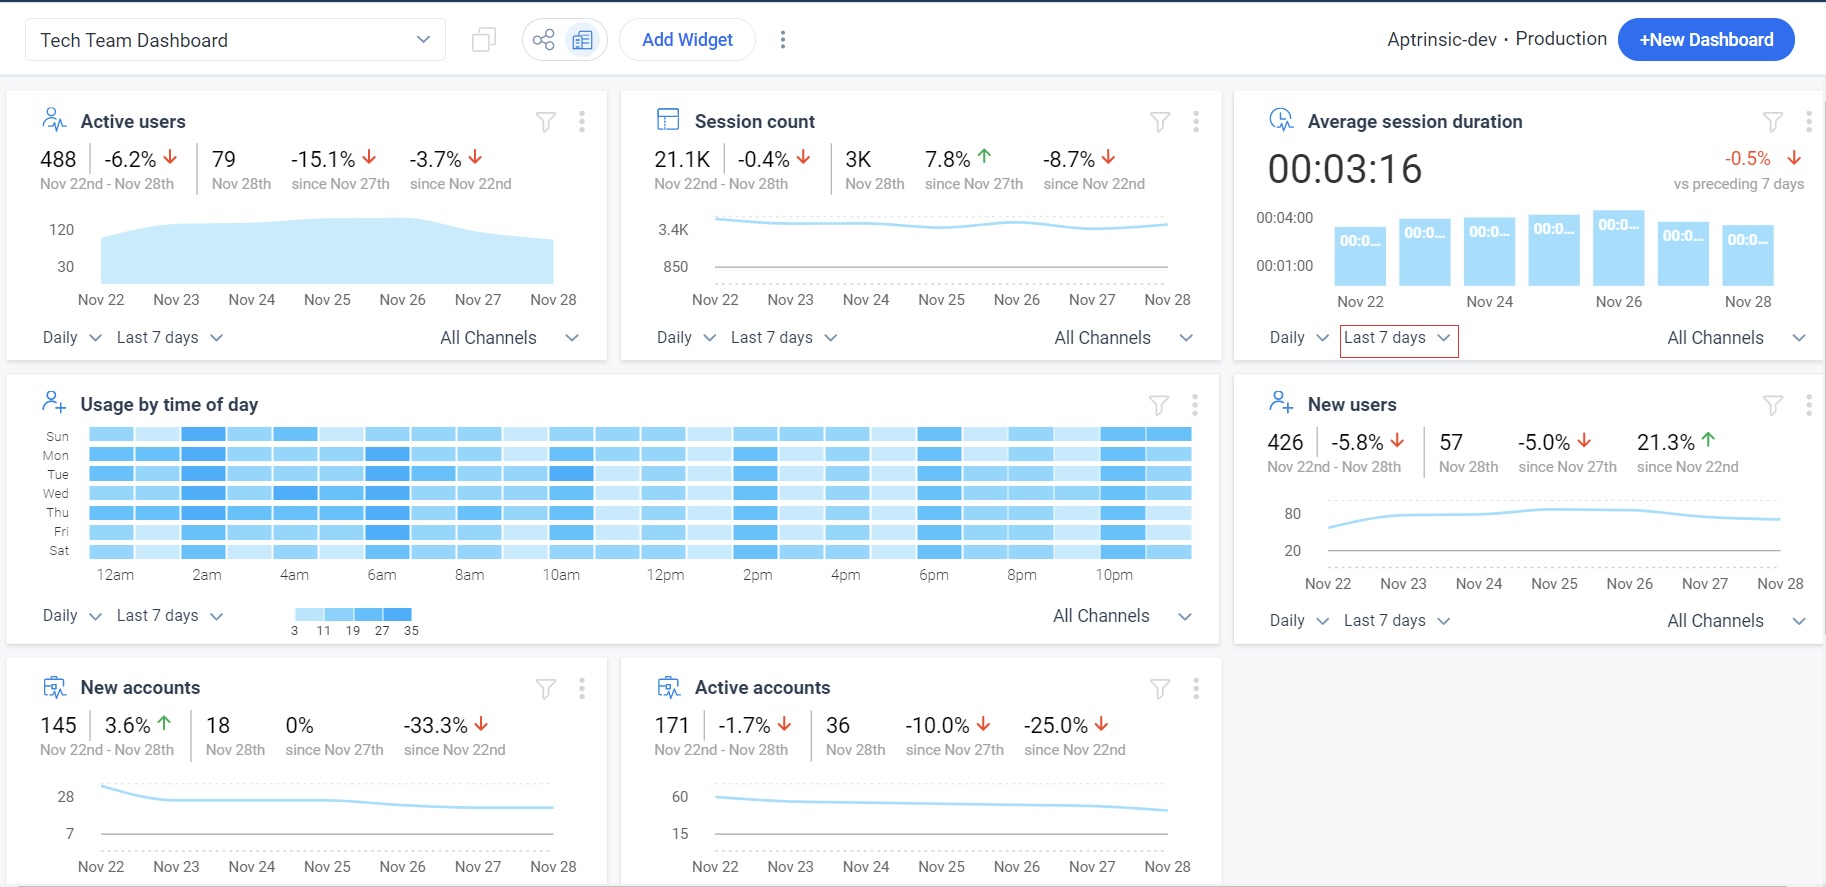
In the above image, there was a 3.7% decrease in the number of Active Users in the last 7 days, as compared to the number of Active users who existed in the 7 days, which preceded this period.
Similarly, if you have a set time frame as 30 days, the widget displays data for 30 days and also compares the existing data with the preceding 30 days to provide you with a percentile increase or decrease figure.
For more information about how to configure Dashboards, refer to the Configure PX Dashboards article.
For more information on frequently asked questions, refer to the Dashboard FAQs article.
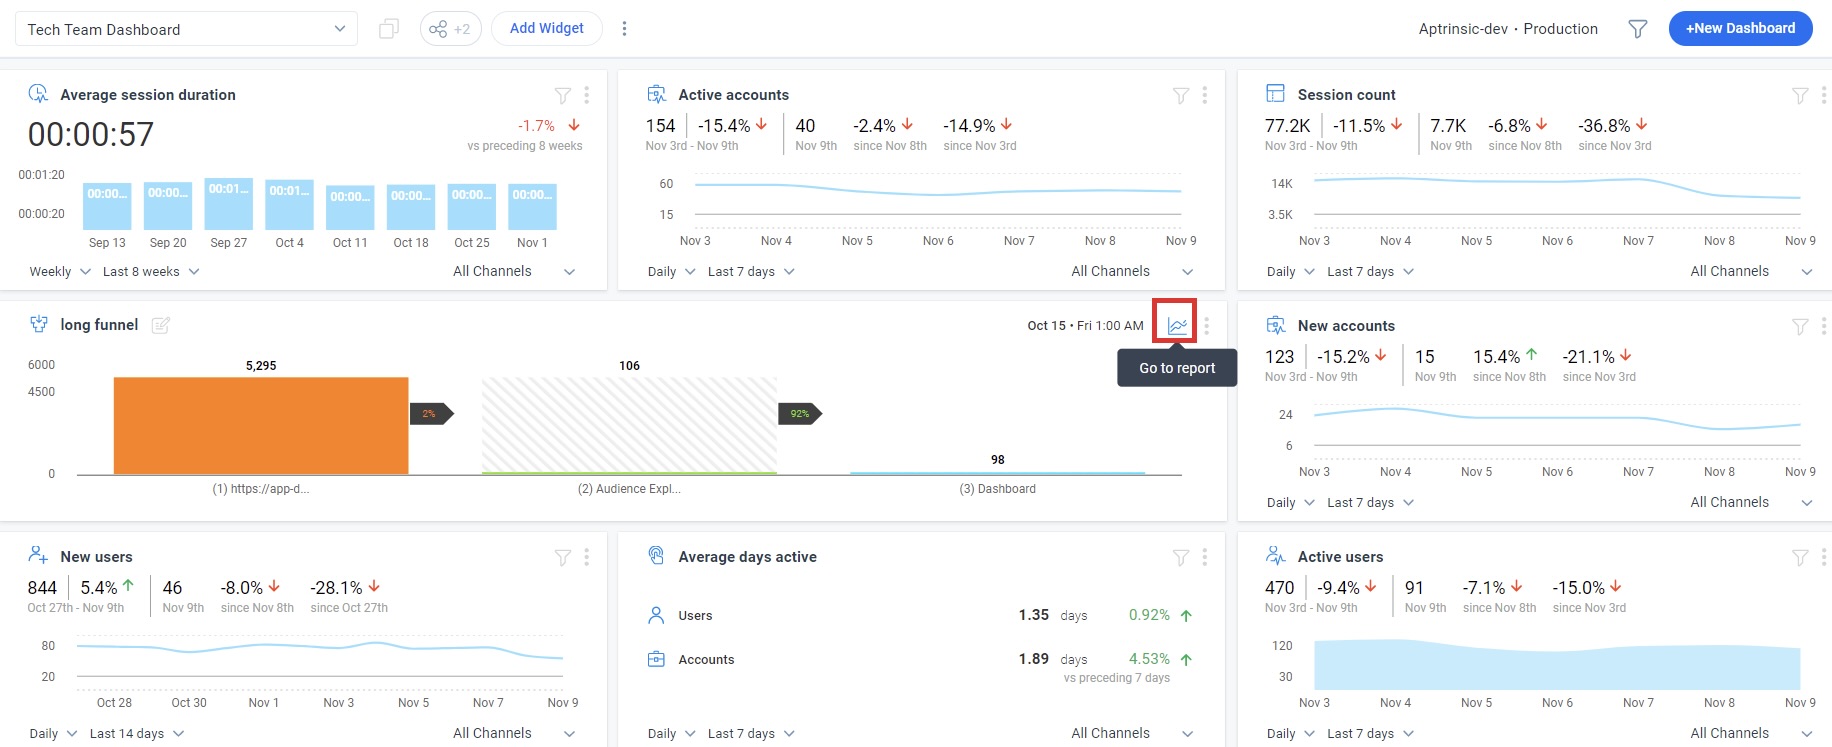
Drill-down to Analytics Report
Custom Dashboard widgets facilitate one-click navigation to the Analytics report that powers the widgets. Click the Go to Report option on the widget to navigate to the respective report from the Dashboard widget. Edit, apply and save report configurations if required. The changes instantly reflect on the widgets.
Notes:
- Only the user who created the report can edit and save changes made to it. Other users can apply changes and save it as a new report.
- The Go to report option is available for the Reports, Engagements, and Feedback widgets only.