P360 Admin Guide (BETA)
Note - BETA Article
Please note that this is a BETA document. You might notice changes in the final version of this document.
If you have any feedback, feel free to share with us at docs@gainsight.com.
This article explains how admins can configure P360 to provide detailed information about CSMs.
Overview
Person 360 (P360) is designed to consolidate and organize person-related data from various product areas within Gainsight. It serves as a valuable tool for both admins and CSMs to streamline operations, enhance customer engagement, and make data-driven decisions. P360 empowers you to analyze person data comprehensively, enabling a deeper understanding of product usage, user sentiment, and the ability to build strong networks for productive business conversations. CSMs can leverage P360 to prepare for discussions, handle cases, and ensure successful meetings with contacts, ultimately leading to improved customer satisfaction and retention.
Key Benefits:
- Customize the Person 360 interface with widgets that resonate with your team's specific use cases.
- Quickly understand gaps in contact data as part of overall system data hygiene practices.
- Adjust views and data to pace with customer and market dynamics, maintaining its relevance and effectiveness of the feature.
- Enable a 360-degree view of individual contacts within a customer organization.
- Toggle between consolidated views of Companies, Relationships, and Persons to get a clear picture of escalations and opportunities with fewer clicks.
- Quickly access historical data, product usage, and interaction tracking to inform personalized engagement strategies.
- Add depth to your data from directly within P360 using timeline entries and other critical contact intelligence.
Prerequisites
Ensure that there is sufficient data in Gainsight for the person record that you select. This is crucial for the P360 layouts and widgets to display relevant information.
P360 Navigation
Navigate to Administration > 360 Layouts > P360 to configure the Person 360 layouts.
Configure P360
You can effectively configure the P360 feature in Gainsight to provide a comprehensive and tailored view of customer data, enabling more informed decision-making and enhanced customer engagement strategies. The configuration steps include creating layouts for each user persona, configuring the relevant sections, and then assigning them to each persona.
IMPORTANT: Admins must enable this feature for end users using the Enable P360 for Users toggle.

On the Configurations > General Settings page, two options are selected by default:
- Always show overview:
- When this option is selected, end users who search for a person record are taken to the Person Overview page, even if the person is associated with only one active company.

- To enable direct access to the Company Person profile, clear Always show overview.

- When this option is selected, end users who search for a person record are taken to the Person Overview page, even if the person is associated with only one active company.
- Enable Person from global search:
- When this option is selected, end users can search for person records using the global search bar.

- To exclude person records from global search, clear Enable Person from global search.

- When this option is selected, end users can search for person records using the global search bar.
Create Layout
In P360, it is feasible to design distinct layouts tailored to various end-user groups, as not all end-users are required to view the same information.
Default Layout
Gainsight provides a pre-built layout named Default Layout in the P360 Layouts tab. This layout is specifically designed for CSMs. It provides a high-level overview of key metrics and summaries, enabling decision-makers to quickly grasp the overall health and status of customer relationships and business operations. It includes sections such as Summary, Product Usage, Timeline, Text Analytics and People Maps. In the Summary section, the layout includes widgets such as Community Metrics, Recent 5 Community Interactions, Overall Product Usage, Top 5 Features and so on.
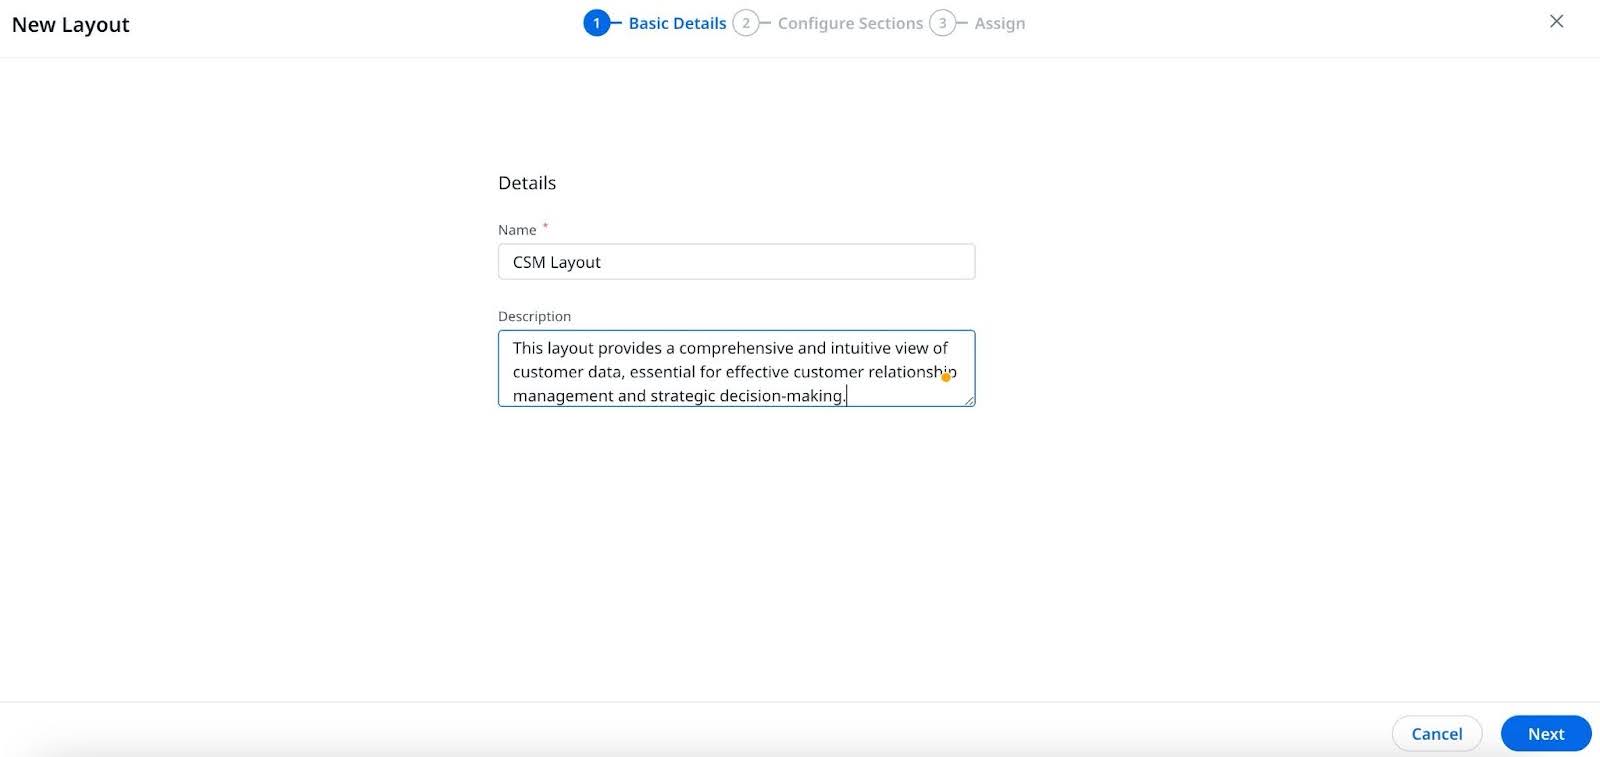
Configure Basic Details
In this section you can configure the basic details of the layout. Enter information in the following fields for the basic details:
- Name: Provide a contextual name for the layout.
- Description: Provide a brief outline of the layout use case.
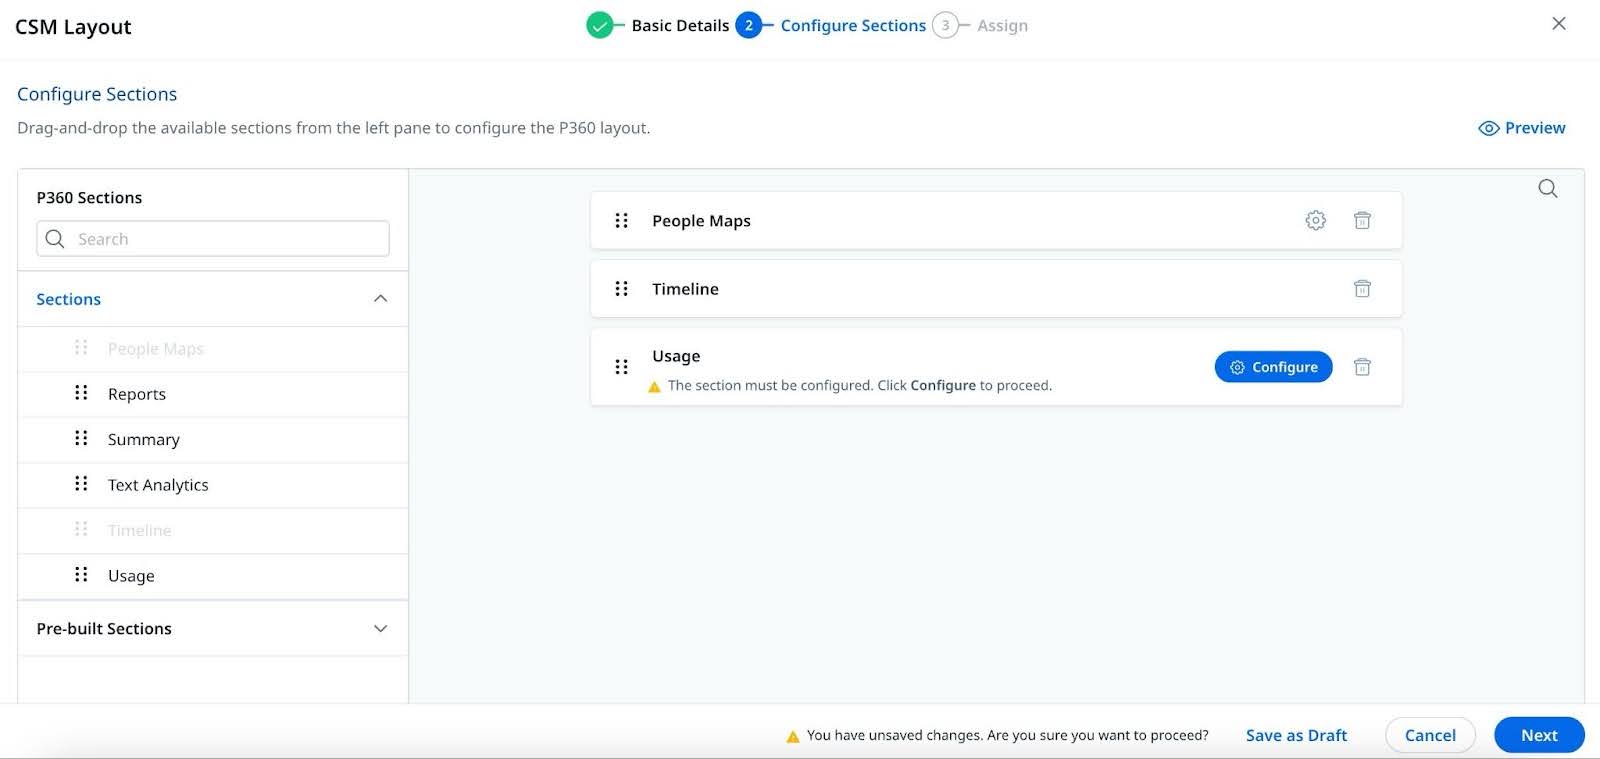
Configure Sections
As an admin, you can use the pre-built sections created by Gainsight or you can configure the standard sections and add them to the layout.
The following sections are available for P360 Layout:
- Summary
- Timeline
- Usage
- Reports
- Text Analytics
- People Maps
Use Pre-Built Sections
Gainsight provides prebuilt sections for the ease of creating quick P360 layouts. You can create a section and re-use them across layouts. Any changes made to the pre-built sections reflect in every layout where the sections are used.
To add a section as the pre-built section, click the Save as Pre-built section button after completing the configuration.
For more information on these sections, navigate to the respective content in this article:
- Summary
- Timeline
- Usage
- People Maps
Configure Standard Sections
The following sections in the P360 Layouts are available as standard sections. The Timeline and Text Analytics sections require no additional configuration, while the remaining sections need to be admin-configured.
Assign Layouts
P360 allows you to create specific layouts for different personas as required. You can even use filters to identify users across companies/relationships using the key attributes. A combination of criteria with AND logic can be used to arrive at the specific target audience.
Note: Select the checkbox beside each criteria to include the null values.

Manage Assignments
As an admin, you can create multiple layouts and assign them to different user personas. In the Manage Assignments tab, you can view the list of layouts and their assignments. The layouts assignments are prioritized in the order in which they are listed. You can reorder the list to change the priority when multiple layouts are assigned to the same user.

In the View Assigned Layout tab, you can create a criteria to select the user that needs to view the layouts.

Preview Layout
The Preview Layout option in P360 allows you to view a real-time rendering of the customized layout before finalizing. It provides an accurate snapshot of widget arrangement and data representation, ensuring the layout meets the requirements for effective monitoring and analysis of person-related information.

Layout Options
P360 provides the following options for the ease of building layouts:
- View/Edit: To view an existing layout and edit it
- Rename: To rename an existing layout
- Duplicate: To create a cloned copy of an existing layout
- Mark as Default: To make a layout as a default layout in the list view
- Assign Layout: To assign a layout to a user
- Delete: To delete a layout permanently

Sections in P360
You can add sections that represent different product areas in Gainsight. This helps to view and analyze consolidated person-related information from each feature. Gainsight offers the following sections that can be listed in P360 for every user:
- Summary
- Text Analytics
- People Maps
- Timeline
- Product Usage
- Reports
Configure Summary Section
The Summary section consists of the Highlights widget and a group of standard widgets to display the person data from various product areas of Gainsight. Users can use the global Context Switcher dropdown menu and view the following options:
- Overview : Provides the snapshot of person information across all companies that the person has created footprints on.
- Company View: Provides company-related information in the Summary widgets
- Company - Relationship view: Provides relationship-related information within each company in the Summary widgets.
You can add and configure widgets to display critical parameters of customers, important for your organization. When a widget is added into the Summary section and configured to represent a key parameter, it enables CSMs to effortlessly assess these parameters. For more information on the widgets, refer to the Widgets in P360 section.
You must configure the Summary section widget after adding it to a layout, so that it displays information in the P360. Gainsight offers 18 Standard Widgets and 18 Report Widgets out of which 10-12 can be added in the Summary section.
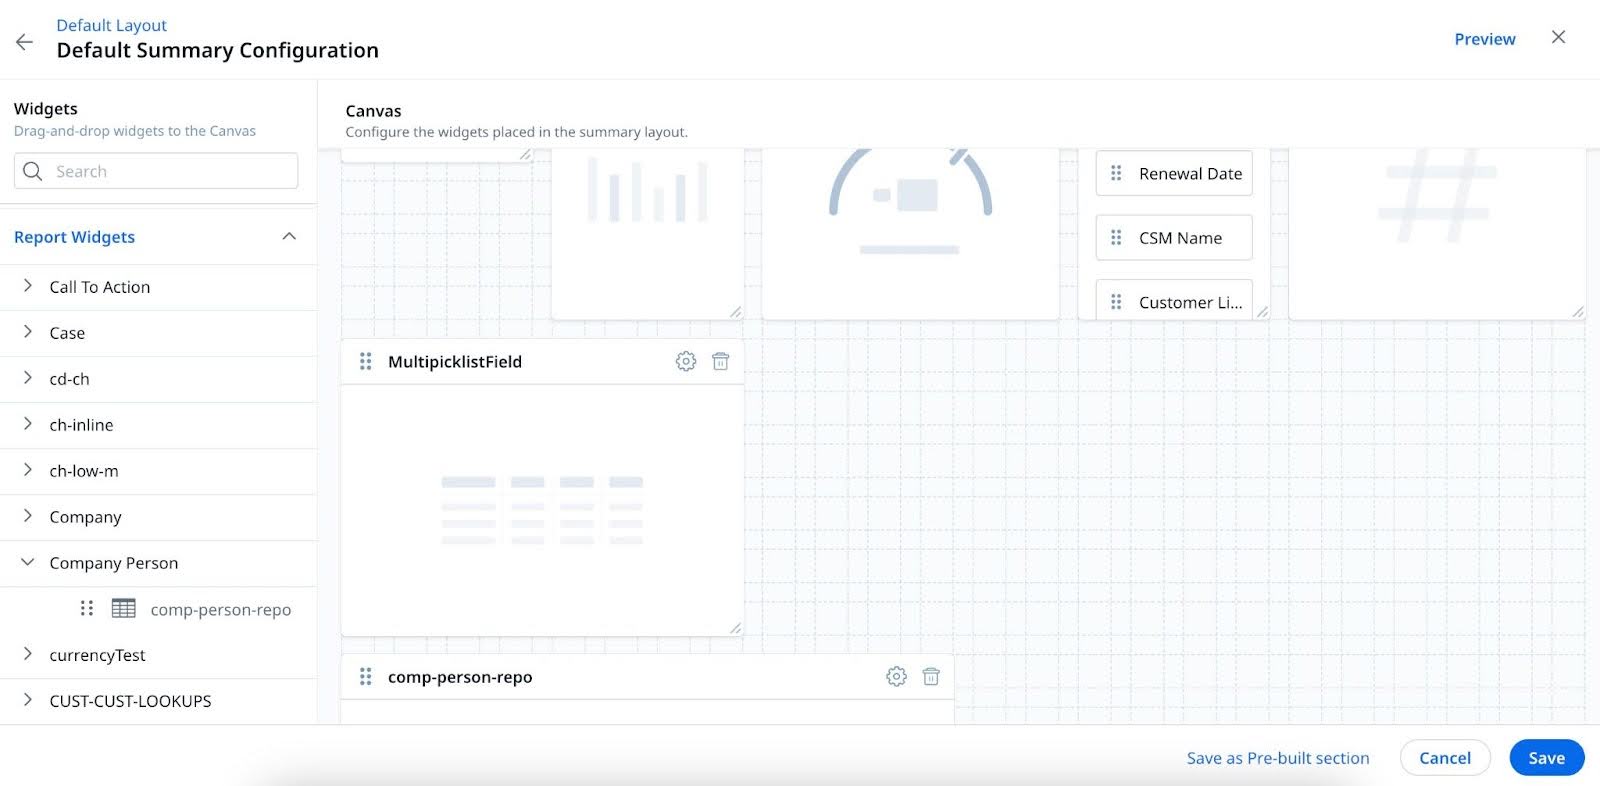
To configure the Summary section:
- In the Configure Sections step, drag and drop the Summary widget from the left pane.
- Click Configure. The Save to Configure dialog appears, if you have not saved the Layout.
- Click Yes. The Summary Configuration page appears.
- Drag and drop the required widgets from the left pane. You can use widgets from all the two widget types (Standard and Report).
- (Optional) Click the name of the widget to rename them. Once you have renamed the widget, the original widget name is displayed along with the new name.
- (Optional) Click Preview to view the Summary section before saving it.
- Click Save.
Highlights
The Highlight section provides a snapshot of a person’s profile. This section comprises standard fields and optional fields that can be added by admin.
The standard fields are:
- Person Name: This field displays the name from the Person object name field. It's the primary identifier of the person in the system.
- LinkedIn URL: This field contains the URL to the person’s LinkedIn profile, offering a direct link to their professional online presence and network.
- Location: This field displays the geographical location of the person, such as city and country. It's useful for understanding their regional context or for logistical purposes like scheduling meetings.
- Timezone: This field indicates the time zone in which the person is located. Knowing the timezone is crucial for planning interactions and communication, especially in global operations.
- Company: This field lists the name of the company where the person is currently employed. It provides context about their professional environment and potential business relationship with your organization.
- Title/Role: This field displays the person’s job title or role within their company. This information is key for understanding their level of decision-making authority, areas of expertise, and potential requirements.
- Profile Image: Displays the image uploaded by end users or admins.
Optional fields are:
- Last Engagement Date - The date of the recent Timeline activity the person is mentioned in.
- Last Engagement Type: The activity type associated with the last Timeline the person is mentioned in. You can configure the activity type to be displayed. More than one activity type can be chosen and the recent one is taken into account. All the activity types available for a tenant are available for selection.
- Survey Response Rate: Total number of Surveys responded compared to the total number of Surveys sent to the person.
- Trend: The trend of the survey response rate and emails sent over a period of 90 days.
Configure Text Analytics Section
To configure the Text Analytics section:
- In the Configure Sections step, drag and drop the Text Analytics section from the left pane.
- (Optional) Click Preview to view the Summary section before saving it.
- Click Save.

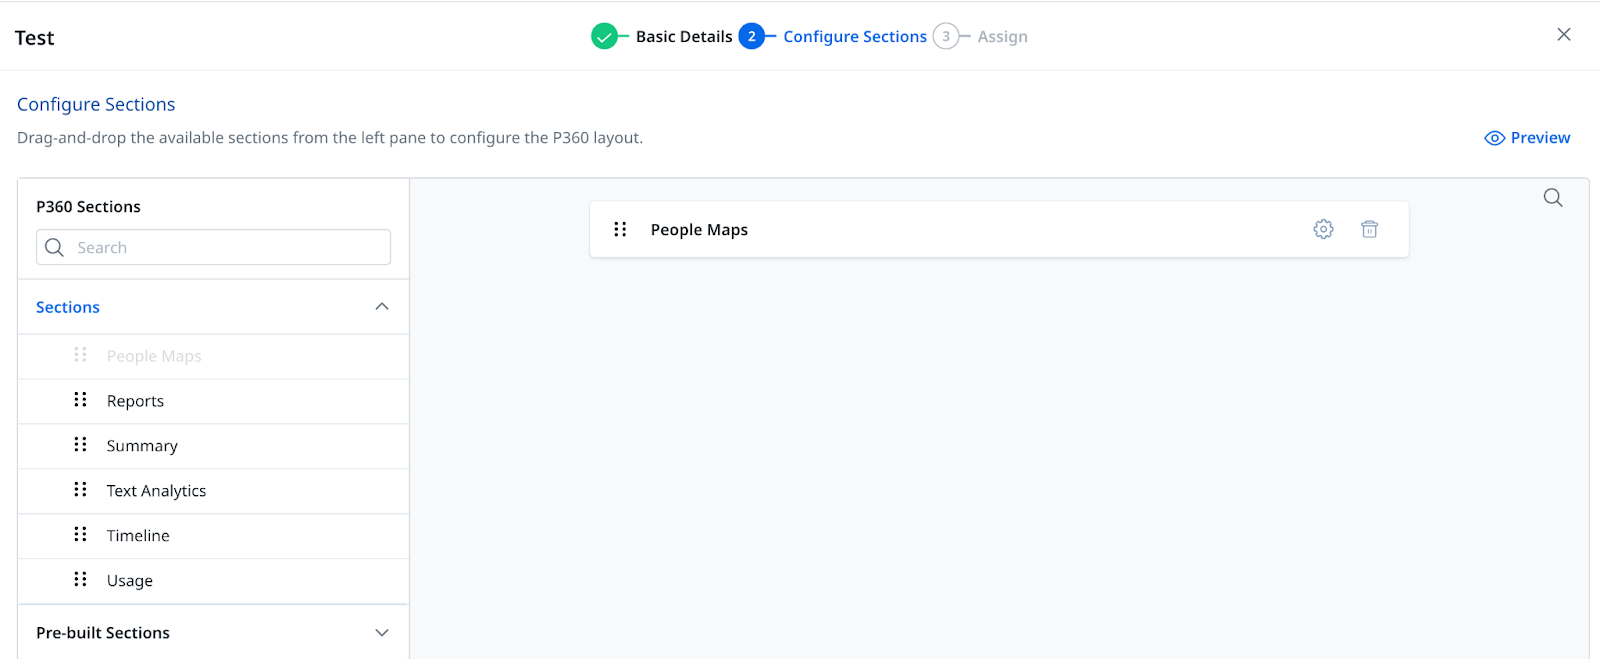
Configure People Maps Section
The People Maps section displays an overview of the companies and maps that person is a part of. You can check the details of each map by using the Context Switcher dropdown menu to drill down into specific companies and relationships.
To configure the People Maps Section in P360:
-
In the Configure Sections step, drag and drop the People Maps section from the left pane to add the People section to the P360 layout.
- (Optional) Click Preview to view the layout before assigning it to the users.
- Click the Settings icon. Choose Map Default Layout. The Save to Configure dialog appears, if you have not saved the Layout.
Note: Map Default Layout allows you to configure the default settings for the Map View. You can choose from the following two layouts:- Vertical: The peers are stacked vertically one below the other.
- Horizontal: The peers are stacked horizontally side by side.

- (Optional) Click Save as Pre-built section. This section is saved as a ready-to-use section for the CSMs. They will not be able to switch between vertical and horizontal configurations.
- Click Save. The layout is saved as a draft.
- Navigate to the Configure Card tab. The People Maps Configuration page appears.
- Drag and drop the fields that you want to display in the People Maps section.
- Click Save. The People Maps section is added to the P360 layouts successfully.

Configure Timeline Section
To configure the Timeline in the Summary section:
- Navigate to Administration>P360. Click the default layout.
- (Optional) Click Add Layout to create a new layout in P360. The Layout page appears.
- Click Configure Sections.
- Drag and drop the Timeline section from the left pane.
- (Optional) Click Preview to view the Summary section before saving it.
- Click Save.

Configure Product Usage Section
The Product Usage section help users view the usage data of a company/relationship in P360 layouts. This is achieved by adding the Product Usage section defined in Adoption Explorer project, to the P360 layout configuration page.
Prerequisite:
A connection must be configured between the Gainsight CS tenant and Gainsight PX. For more information about the configuration details, refer to the Gainsight PX Connector article.
To configure the Product Usage section:
- In the Configure Sections step, drag and drop the Product Usage section from the left pane.
- Click Configure. The Save to Configure dialog appears, if you have not saved the layout. Click Yes to save the Usage section to the layout. The Usage Configuration page appears.
- Enter a name in the Usage Name field.
- From the Projects dropdown, select the Default Project.
- From the Usage Dashboard dropdown, the Default Dashboard option is populated.
Note: The default project and dashboard are automatically selected for the Default layout, however admins can override these selections and set their preferred projects and dashboards. - (Optional) Add a Description.
- Click Save.

For more information on usage reports, refer to the Create Usage Report in a Dashboard article.
Configure Report Section
The Report section consists of all the pre-configured reports. You can drag and drop pre-configured reports to the layout to display them on your P360 Reports page. Reports created on the same object can be grouped and their order within the report group can be rearranged as per your preference. You can add multiple grouped or ungrouped reports to your P360 layout.
To configure the Report section:
- In the Configure Sections step, drag and drop the Reports section from the left pane.
- Click Configure. If you have not saved the layout, the Save to Configure dialog appears. Click Yes to save the Report section to the layout. The Reports Configuration page appears.

- Drag and drop the required reports from the left panel.
- Click Configure. The Report Group Settings slide-out panel appears. Enter the required information.
Note: Select the Company Reference, Person Reference, and Relationship Reference fields in the Report Group Settings page as required. - Click Save.
- The selected reports are displayed on the Reports tab.

- (Optional) Click Add Group to group reports created on the same object. You can also drag and drop reports built on the same object to form a group.
- (Optional) Drag and drop the Report Groups and ungrouped reports to change the order in which they are displayed in the P360 Reports tab. You can also reorder the sequence of the reports within the same group.
KPI Report Widget Group
You can create a KPI report widget group and configure the group settings to automatically resize widgets within the group when the group dimensions are changed. To create a KPI report widget group:
- Drag and drop a KPI report from the left panel. The KPI widget group confirmation window appears.
- Click Yes. A KPI group report appears on the canvas.
- Drag and drop other KPI reports to the group.
- Click Configure. The KPI Group Settings slide-out panel appears.
- By default, Allow auto re-adjusting of KPI widget size in a group toggle is on.
- Click Save.

Notes:
- You can change the widget group dimensions from the bottom-right corner. The KPI report widgets inside the group automatically resize their dimensions for better space utilization.
- You can turn off Allow auto re-adjusting of KPI widget size in a group toggle. KPI report widgets in the group retain their dimensions defined by you even if the widget group dimensions are changed.
Widgets in P360
When configuring P360, you can drag and drop the following standard and Report widgets to the Summary section :
Standard Widgets
| Widget Name | Description |
|---|
|
Highlights |
The highlight section gives a snapshot of a person’s profile. This section comprises standard fields and optional fields that can be added by admin. |
|
Company Associated |
This widget shows the company details associated with the selected person |
|
Relationship Associated |
This widget shows the relationship details associated with the selected person |
|
Attributes |
|
|
Last 5 Timeline Activities |
This widget displays the five latest Timeline activities in the Timeline P360 widget. These listed activities are filtered based on the external attendees |
|
Community Metrics |
This widget aggregates key engagement indicators from the Customer Communities platform. It helps visualize metrics such as Page Views, Posts, Topics, and Replies |
|
Last 5 Community Activities |
This widget presents the five most recent actions or engagements of a user within the Customer Communities platform over a chosen period. It provides a quick snapshot of the user's latest interactions, offering valuable context for understanding their current interests and participation levels in the community. |
|
NPS (Last Response) |
Displays the last response received for the NPS question. This CX metric helps you gauge the customer’s loyalty and likelihood for recommendation. For a deeper insight into NPS survey responses, click the NPS widget for a drill-down view of complete NPS survey responses from the person. Additionally, use the All drop-down menu to refine the survey results using the NPS filter (Promoter, Passive, and Detractor). |
|
CSAT (Last Response) |
Displays the last response received for the CSAT question. For a deeper insight into CSAT survey responses, click the CSAT widget to get a drill-down view of CSAT survey responses from the person. Additionally, use the All drop-down menu to refine the survey results using the CSAT filter (Dissatisfied, Neutral, and Satisfied). |
|
Survey Response Rate |
Displays the response rate percentage calculated based on the ratio of the number of actual survey responses to the number of total surveys sent to this participant in a timeframe of the last 90 days. Note: Survey Response Rate is computed for surveys distributed through Gainisght only. It does not include responses from external NPS or CSAT surveys loaded into an organization. |
|
Journeys |
This widget displays the count and names of programs in which a person has participated in the past 6 months, highlighting their current status (Review, New, Active, Completed, Knock-off, or Dropped) against each program. Additionally, the widget provides an activity log of the person's interactions with each program. Note: The duration for which this widget shows data is fixed at 6 months and cannot be adjusted by the admin |
|
Overall Product Usage |
This widget provides extensively the person uses the product. It shows the usage in terms of feature count during the selected time frame. |
|
Top 5 Features Used |
This widget displays the most frequently utilized features of a product by the person. It ranks the top five features based on usage metrics, providing a clear, concise view of user preferences and engagement. |
|
Least 5 Features Used |
This widget showcases the five least engaged features within a product during a specified timeframe. It offers insights into user behavior by highlighting areas of potential improvement or opportunities for targeted customer education. |
Report Widgets
Under Report Widgets, you can select the reports to be displayed as widgets in the Summary section. All reports created in Report Builder are listed here and are grouped by the objects they are created on. You can drag and drop reports to the layout. Once a report is added to the layout, click Configure and select a value from the Company, Person, and Relationship Reference fields.
Gainsight Licences for P360
Admins can manage users and their licenses from the Administration > Users and Permission > User Management page. They can filter the users based on license type and create reports on the licensed users in a company.
All the licensing permissions that are applicable to C/R360 apply to P360 as well. For more information on the licenses, refer to the User Licence Management article.
| Net Promoter®, NPS®, NPS Prism®, and the NPS-related emoticons are registered trademarks of Bain & Company, Inc., NICE Systems, Inc., and Fred Reichheld. Net Promoter ScoreSM and Net Promoter SystemSM are service marks of Bain & Company, Inc., NICE Systems, Inc., and Fred Reichheld. |