Mobile Dashboards
This article explains how users can access Dashboards from the Gainsight mobile app and use the Dashboards tab options.
IMPORTANT: The Mobile Dashboards feature is applicable only to the customers who are onboarded to the Horizon Analytics Dashboards. For more information on Horizon Analytics Dashboards, refer to the Horizon Analytics Overview article.
Overview
Accessing dashboards from anywhere is an excellent resource for users who are on the move or who do not have access to a computer or laptop all the time. Gainsight Mobile app provides this resource to all mobile app users.
Gainsight Dashboard is a collection of reports and widgets, which help users track and analyze the customer success data.
Users can access the Dashboards on their mobile devices and tablets, provided they have the necessary permissions assigned to them by admins. Users can switch between multiple dashboards. Users can also apply rules on the global filters that are already set at the web application level.
For more information on how admins can assign dashboards to users, refer to the Dashboard Permissions article in the Additional Resources section at the end of this article.
Example Business Use Cases:
- CSMs want to access their dashboards (configured by my admins) anywhere.
- CSMs want to get insights into the renewal dashboard from their phone or tablet.
Access Dashboards in Gainsight Mobile
To access the Dashboards, log in to the Gainsight Mobile app. The Dashboard tab is displayed.
Note: If the Horizon Analytics dashboard is not enabled in your org, you will land on the Timeline tab.
For more information on logging into the Gainsight Mobile app, refer to the Gainsight Mobile Overview in the Additional Resources section at the end of this article.
Dashboard Tab
The Dashboard tab displays the dashboard selected by the user in the web application. However, users can switch between the dashboards and view the information in preview mode.
The following are the options available in the Dashboard tab:
- Select Dashboard
- Dashboard Filters
- Refresh Dashboard
- Chats and Options
Select Dashboard
The Select Dashboard dropdown list displays all the dashboards that are available in the web application.
To select a dashboard:
- Tap the Select Dashboard dropdown list.
- Type in the dashboard name.
- Select the dashboard.
Dashboard Filters
Users can view all the global filters that are already set in the web application and can apply rules to them.
To apply Filter rules:
- Tap the Filter icon.
- Tap ADD FILTER.
- From the list of global filters, tap the required filter name. In this example, the Created Date Filter is selected.
- Select the required operator. In this example, the Equals operator is selected.
- Select the required date. In this example, the Current Year is selected.
- Select the Include Nulls checkbox if you want to include null records in the report.
- Tap ADD FILTER to add more filters.
- Tap APPLY FILTERS to set this filter rule (or) Tap RESET to restore the dashboard to its original settings.
- Tap Save.
Note: A red dot is shown on the filter icon when a filter is applied on a Dashboard. Users can delete the filter rules set at the dashboard level anytime based on their business needs.
Refresh Dashboard
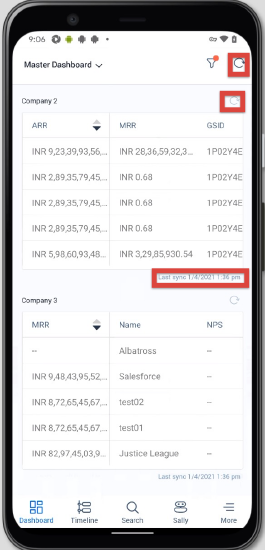
The dashboard data refreshes automatically every time the dashboard loads. However, users can also manually refresh the dashboard at any time. The Refresh option is available at the dashboard and widget level. Users can see the last sync/refresh time at each widget level.
To refresh a Dashboard or Widget, tap the Refresh button as shown in the following image.
Charts and Options
The following are the options available in the mobile dashboard:
- Chart Types
- Maximize Report
- Drill-down Report
- Report Detail View
Chart Types
The mobile dashboard supports all the basic and advanced chart types that are supported in the web application, including the KPI widget. Users can see the chart type mentioned at the top left of the widget.
The following table details the basic and advanced chart types that are supported in the mobile dashboard:
| Basic Charts | Advanced Charts |
|---|---|
| Pie | Stacked bar/column |
| Donut | Scatter |
| Bar (Horizontal charts) | Bubble |
| Column (Vertical charts) | Column Line |
| Line | Heatmap |
| Area | Packed Bubble |
Maximize Report
Widgets in a dashboard are arranged vertically to optimize the mobile experience. Users can tap on any data point to maximize the report view.
Notes:
- In the preview Dashboard tab, only the Pie and Donut chart types show the legends. The remaining chart types show the legends in the maximized view.
- The maximized report view also supports displaying the data as a landscape view for better visualization.
Drill-down Report
To access a Drill-down report:
- Tap on any data point of the report.
- Tap View Data. The drill-down report screen appears.
Report Detail View
The following are the options available in the report detail view:
- Report Filters
- Refresh data
- Download report
Report Filters
The Mobile app honors all the reporting filters that are set in the web application. Users can only view these filters and cannot edit or add a new filter.
The following image shows an example of both Filters on fields and Filters on measures.
Refresh Report
The Refresh option in the report detail view works the same as the Refresh Dashboard or Refresh Widget options on the preview Dashboard tab. For more information on how to refresh the report, refer to the Refresh Dashboard section in this article.
Download Widget (Report)
Users have an option to download a report as an image or data. Once a report is downloaded, the system automatically creates a folder named “Gainsight” and stores all the downloaded images/files in this folder.
To download a report:
- Tap the Download icon.
- Select either DOWNLOAD AS IMAGE or DOWNLOAD AS DATA.
Limitations
The following reporting capabilities are not supported in mobile:
- Scorecard mass edit
- Grid level filters
- Export option in drill-down reports
Additional Resources
- For more information on Gainsight mobile overview, refer to the Gainsight Mobile Overview article.
- For more information on the dashboard overview, refer to the Dashboards Overview article.
- For more information on how admins can assign dashboards to users, refer to the Dashboard Permissions article.