Use Data from Google BigQuery in Data Designer
| IMPORTANT: This feature will be available for customers from April 27, 2024 onwards. |
This article helps admins create datasets by ingesting data from Google BigQuery using Data Designer.
Overview
This article provides a comprehensive guide for administrators on how to create and manage datasets in Data Designer by using Google BigQuery as a data source.
Business Use Case: If your organization uses Google BigQuery to manage business data, you can integrate this data with Gainsight. This integration allows you to combine BigQuery data with other customer information in Gainsight's Data Designer. You can then use these datasets for reporting, creating rules, and Journey Orchestrator (JO) campaigns.
Prerequisites
The following pre-requisites are required for you to create datasets in Data Designer:
- Establish a connection: Create a Google BigQuery connection on the Connectors 2.0 page.
For more information on creating a Google BigQuery connection, refer to the Google BigQuery Connector article. - Data Transfer Permissions: Ensure you have granted the create stage permission on the schema to allow Gainsight to import data sets larger than 5GB using the Google BigQuery connector.
Create Google BigQuery
To create Google BigQuery Dataset:
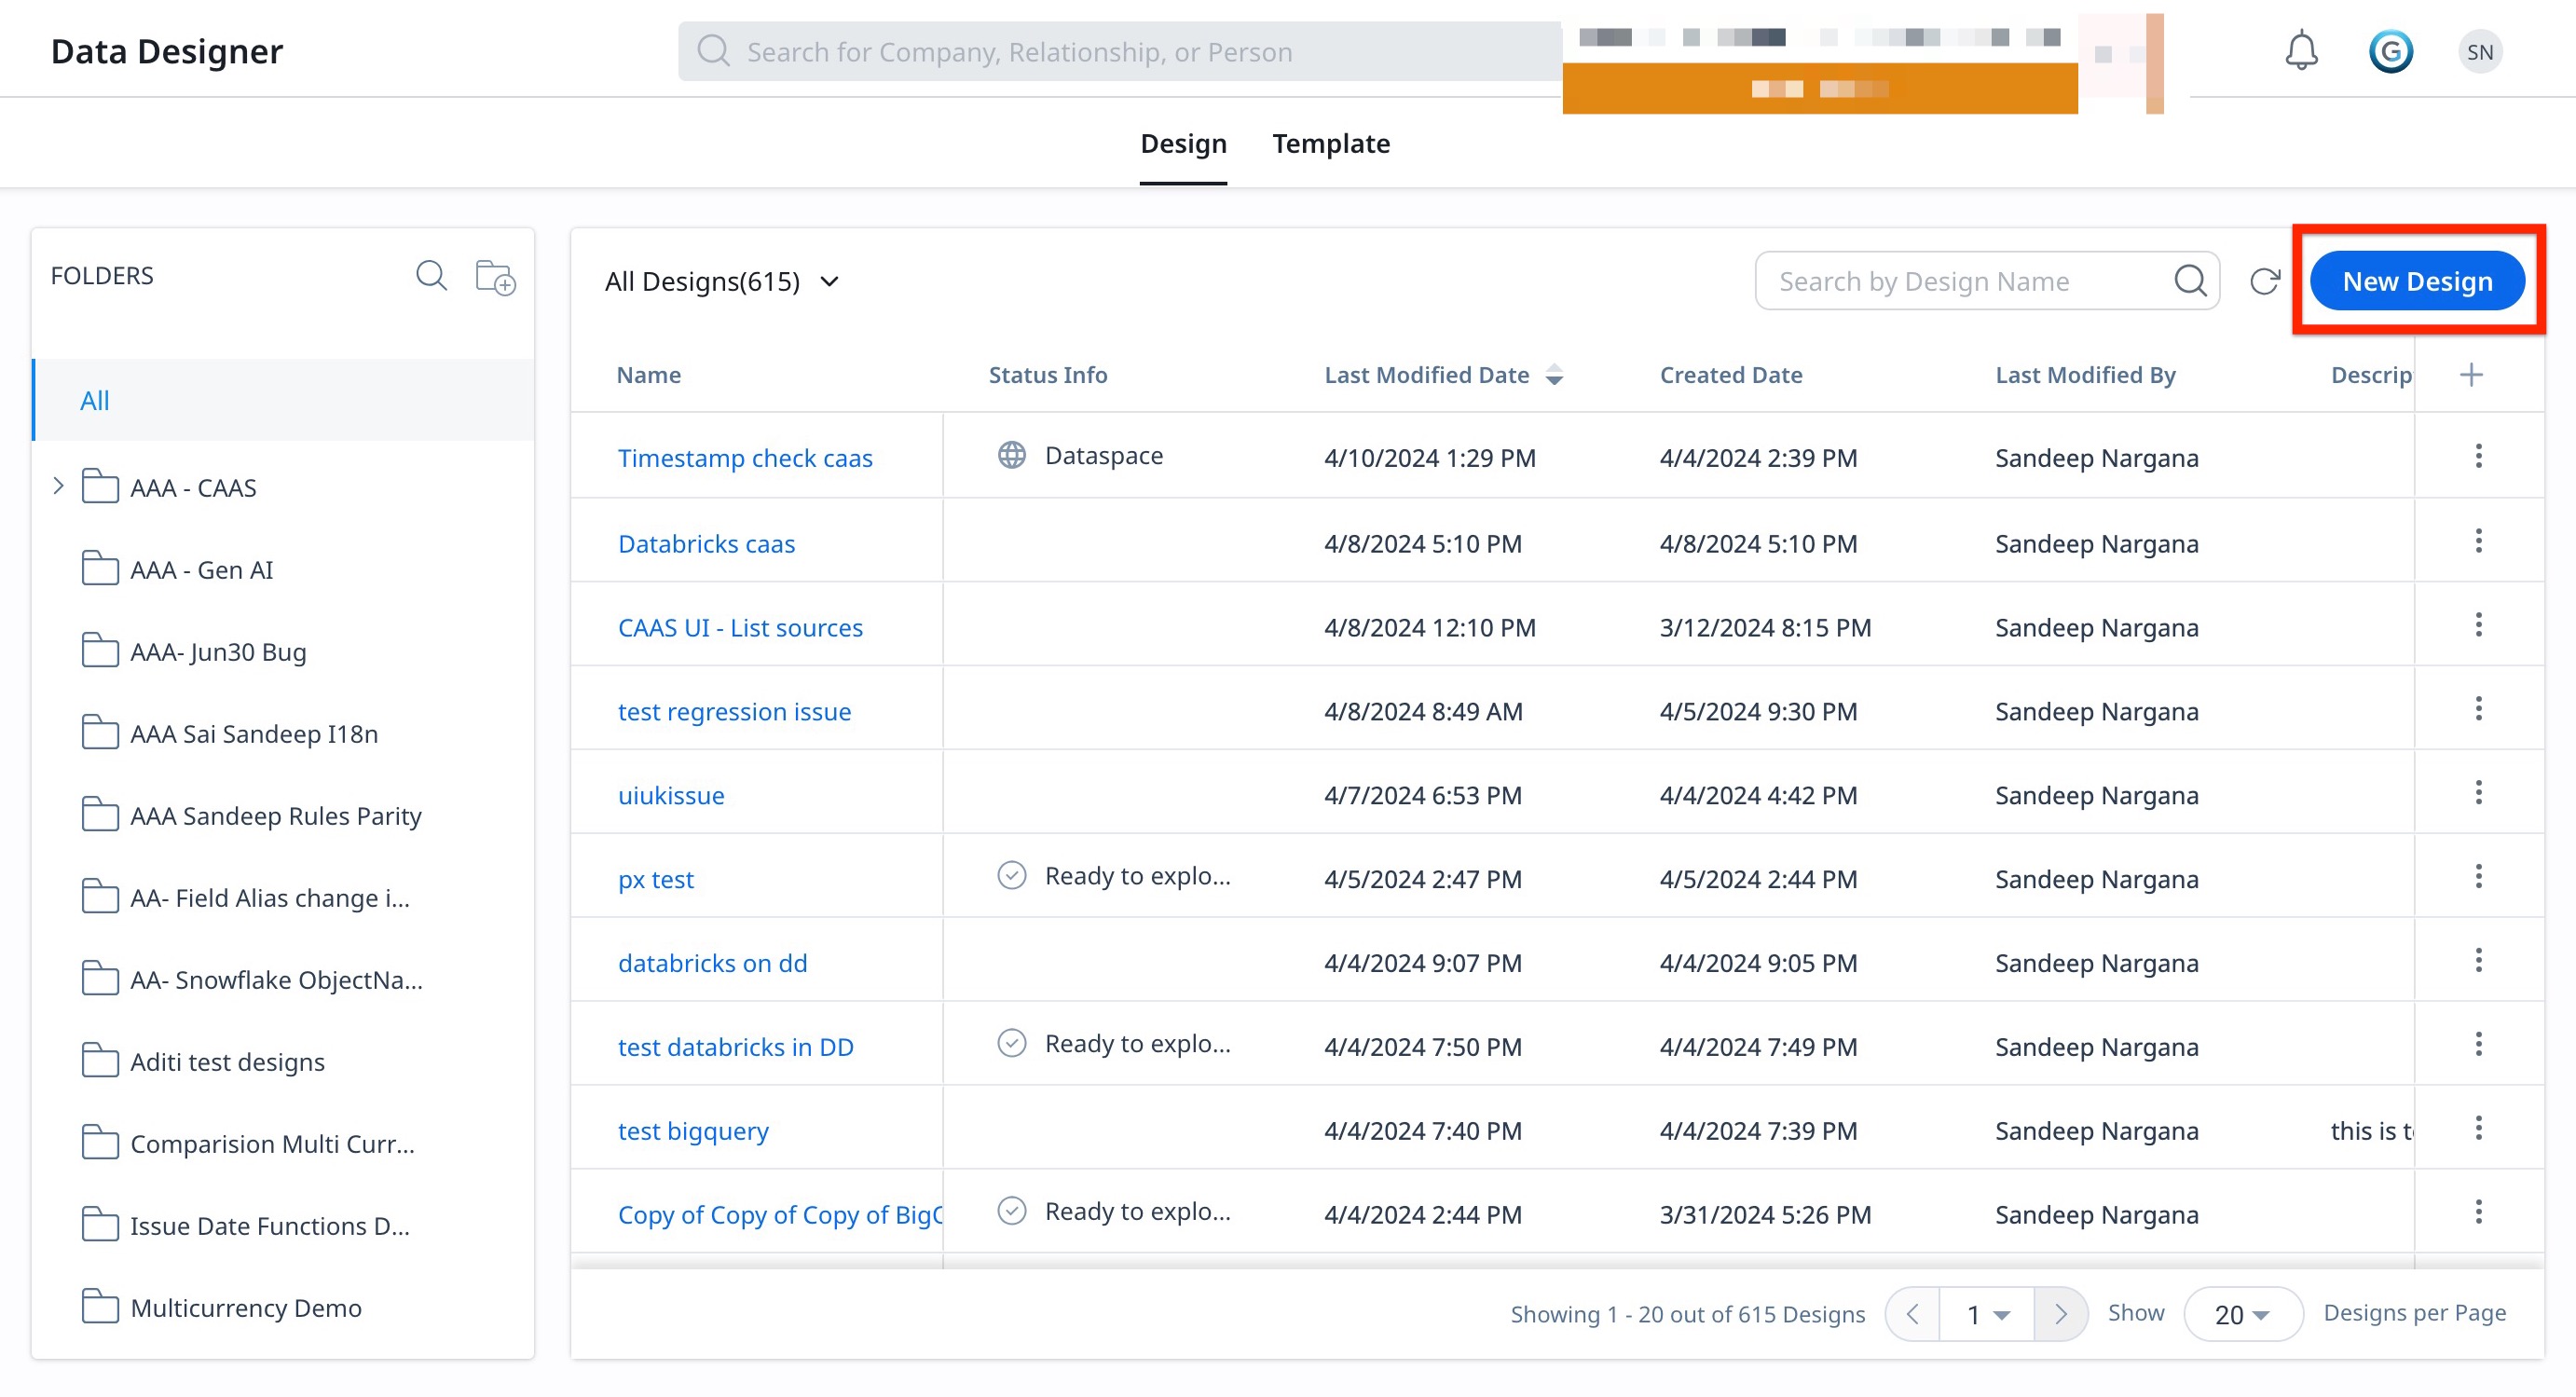
- Navigate to Administration > Data Designer. The Design List page appears.
- Click New Design. The New Design page appears where you can see four tabs: Details, Preparation, Explore, and Configure.
Details
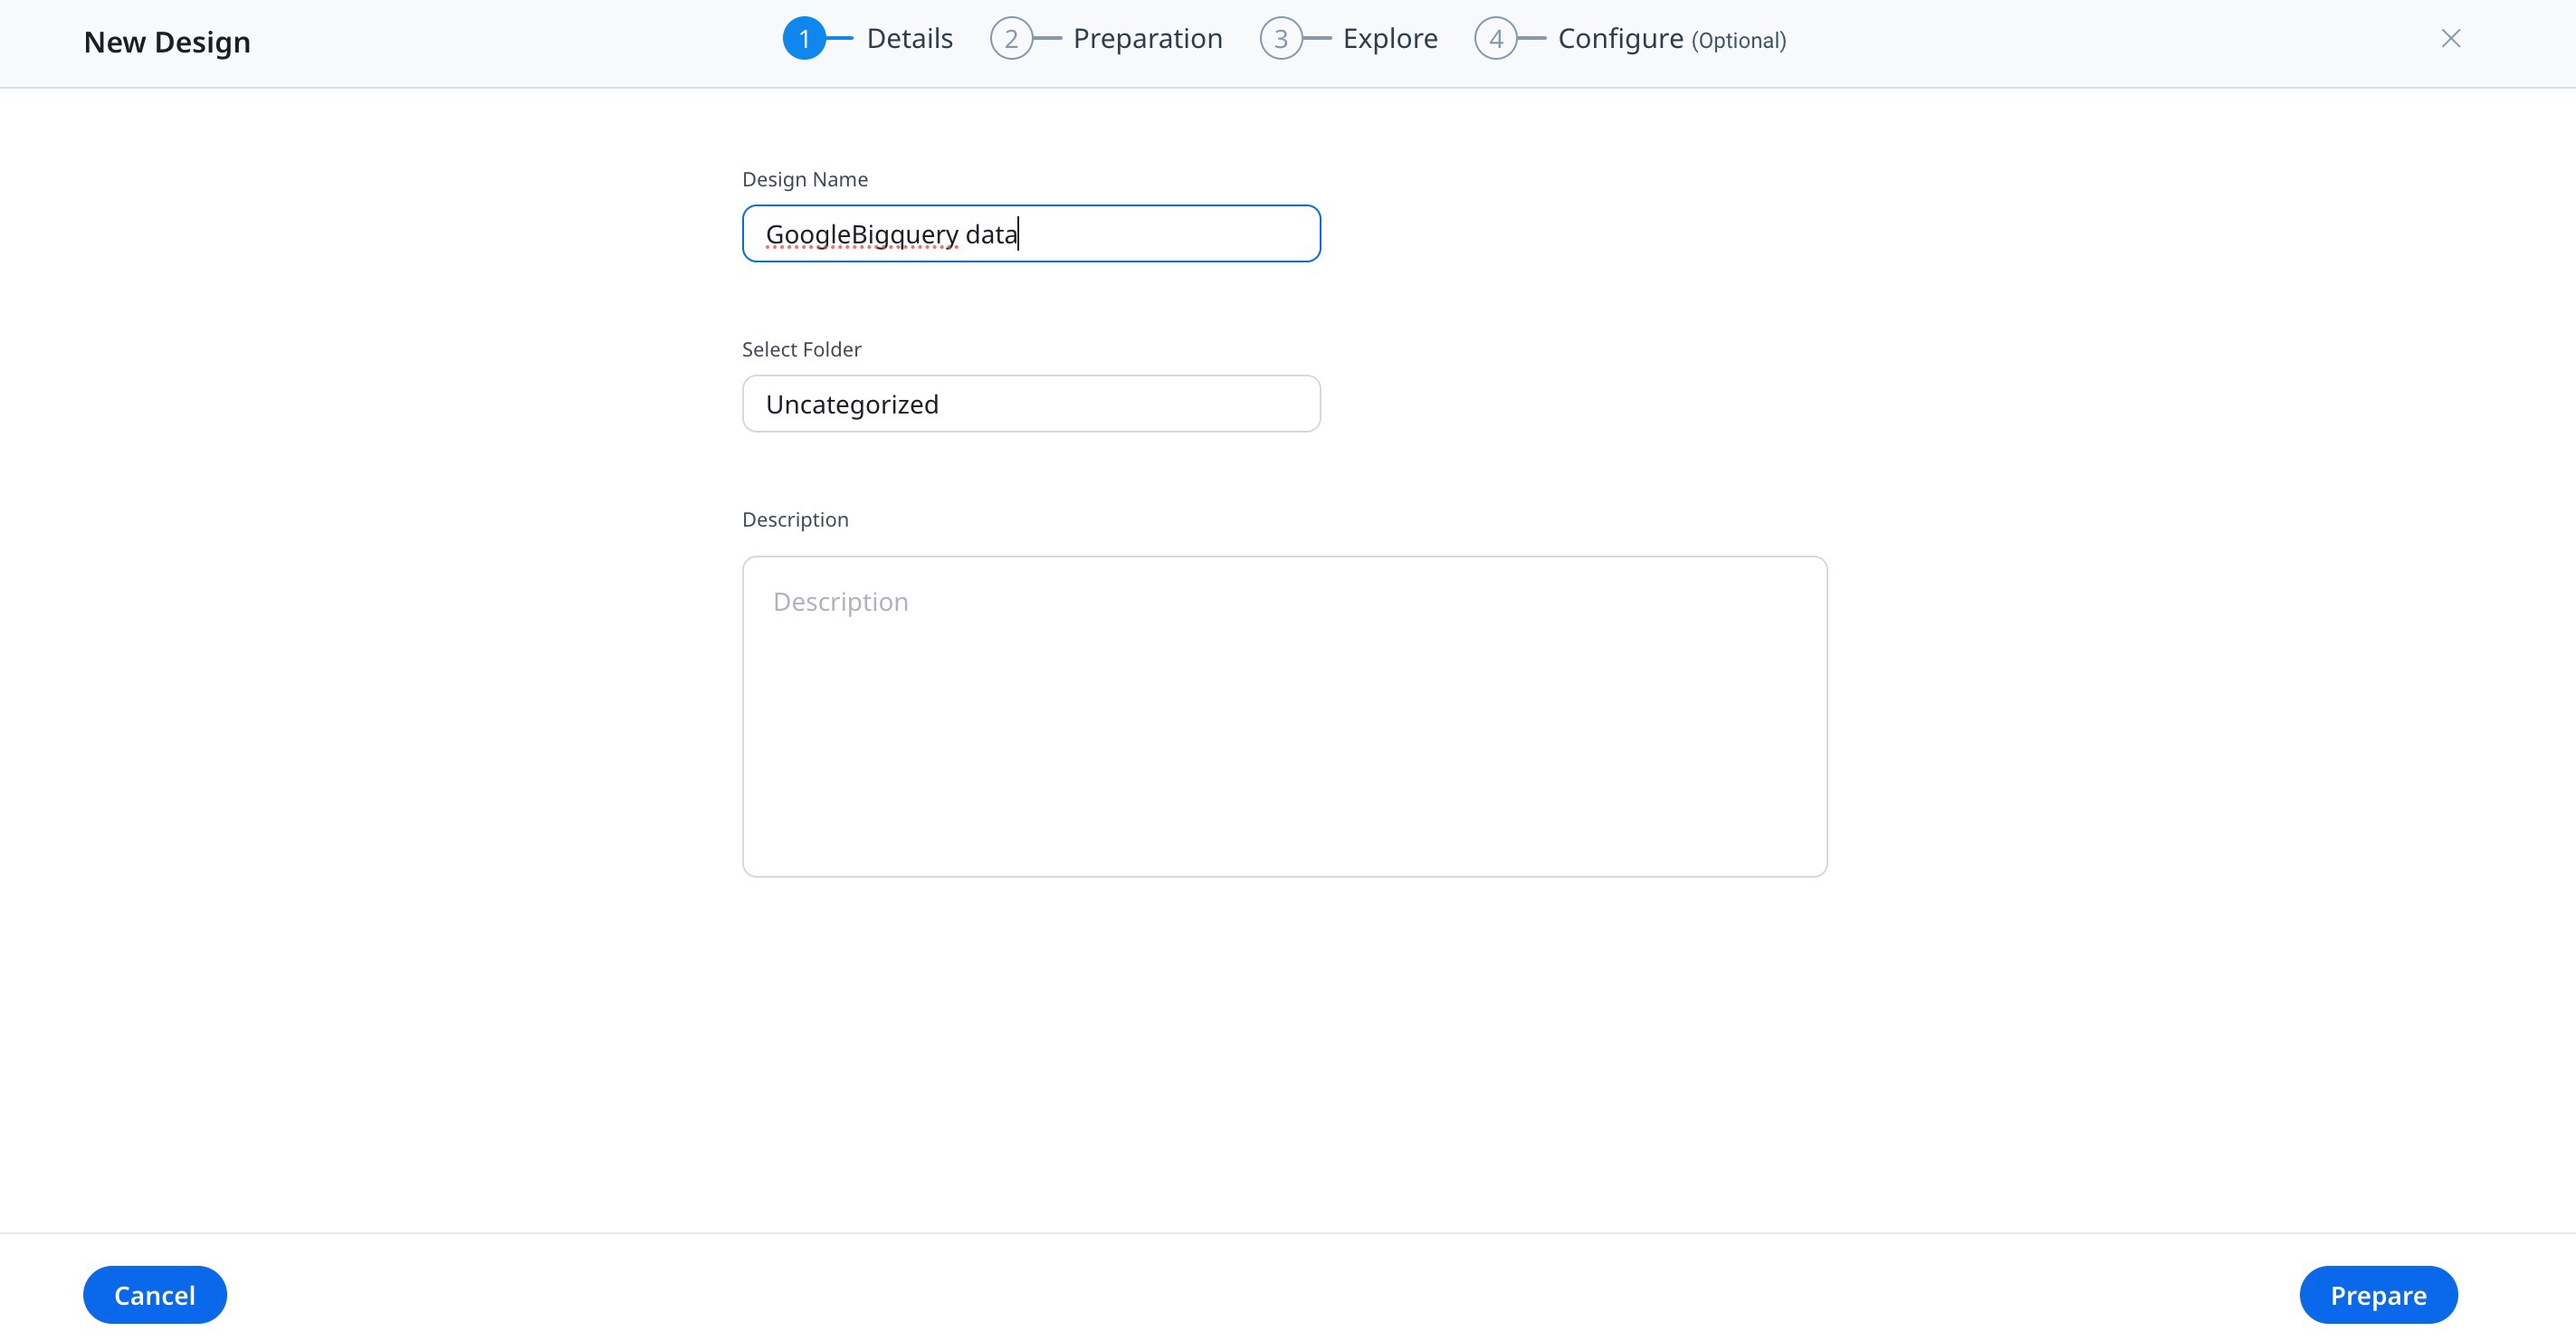
Enter the following information in the Details tab:
Note: The Details tab allows you to add basic information related to the dataset that is being created.
- In the Design Name, enter the name of the Data Design.
- In the Select Folder, select the folder in which the design needs to be saved.
- (Optional) In the Description, enter the details in the Description textbox as required.
- Click Prepare. The Preparation tab appears.
Preparation of Dataset
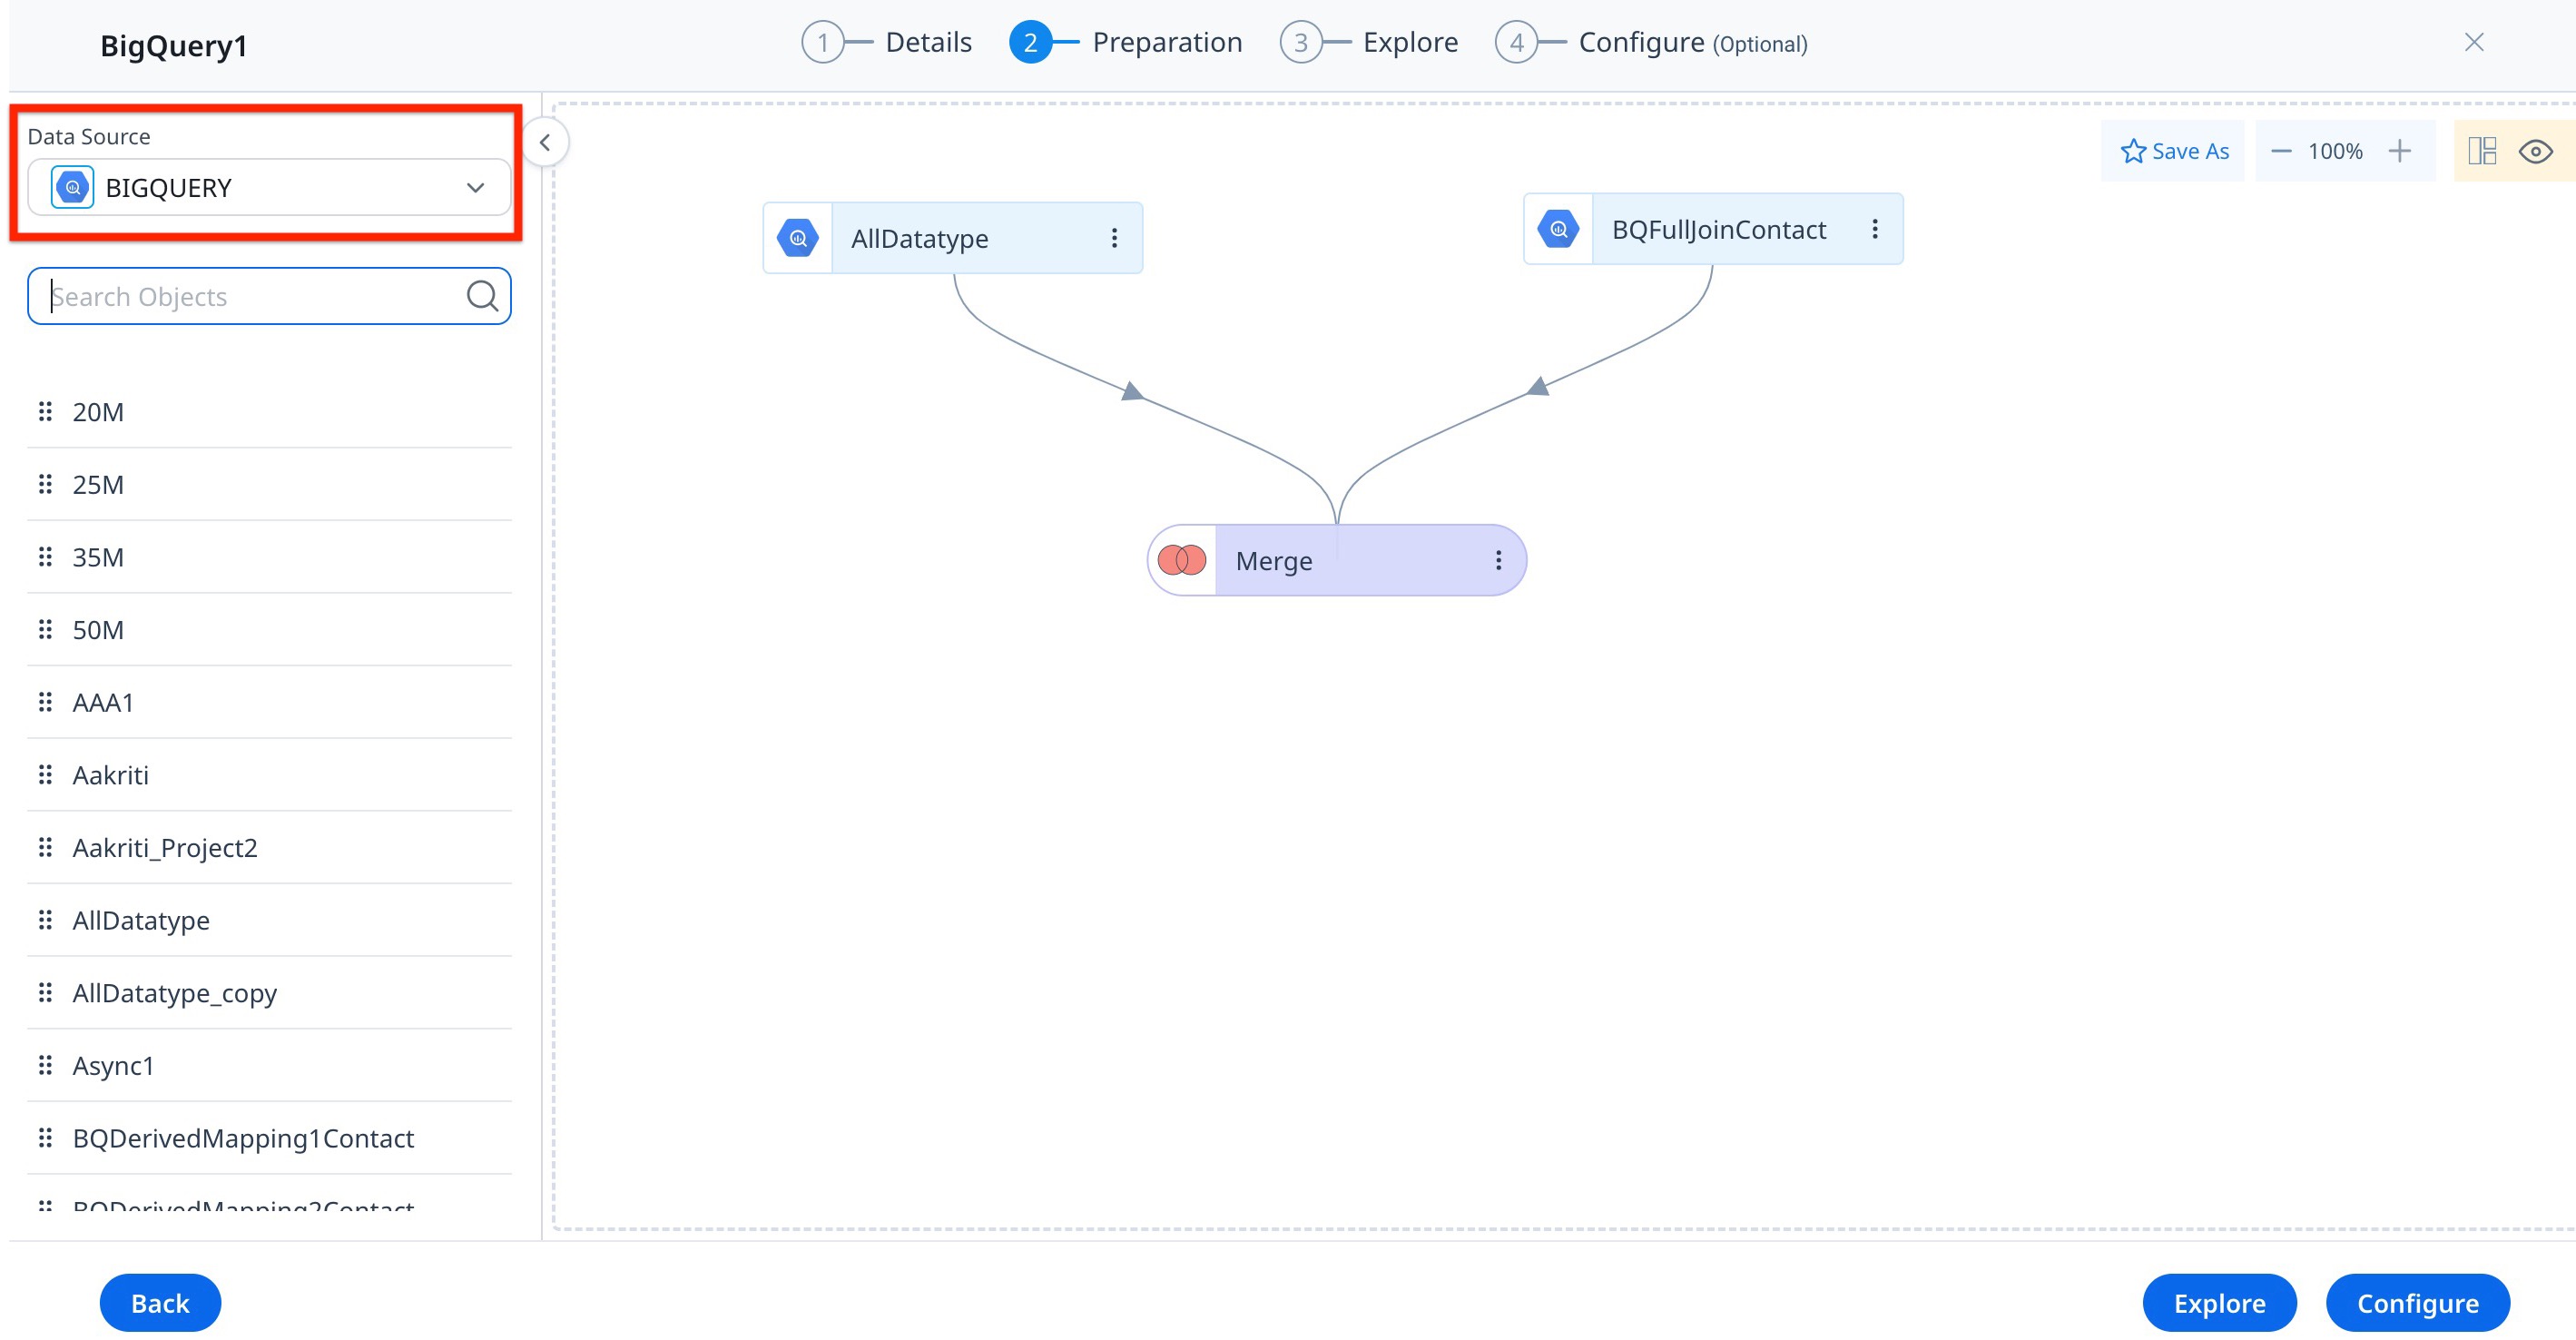
In the preparation stage, you can create the dataset by selecting the Data Source and its objects.
To prepare a Dataset:
- From the Data Source drop-down list, select the required Google BigQuery data source. You can see all the objects available under the selected Google BigQuery source.
Note: You can see the Google BigQuery data source here if you have established a Google BigQuery connection on the Connectors 2.0 page as shown in the Prerequisites. - Drag the required objects from the left pane to the canvas screen. The Select Fields window appears.
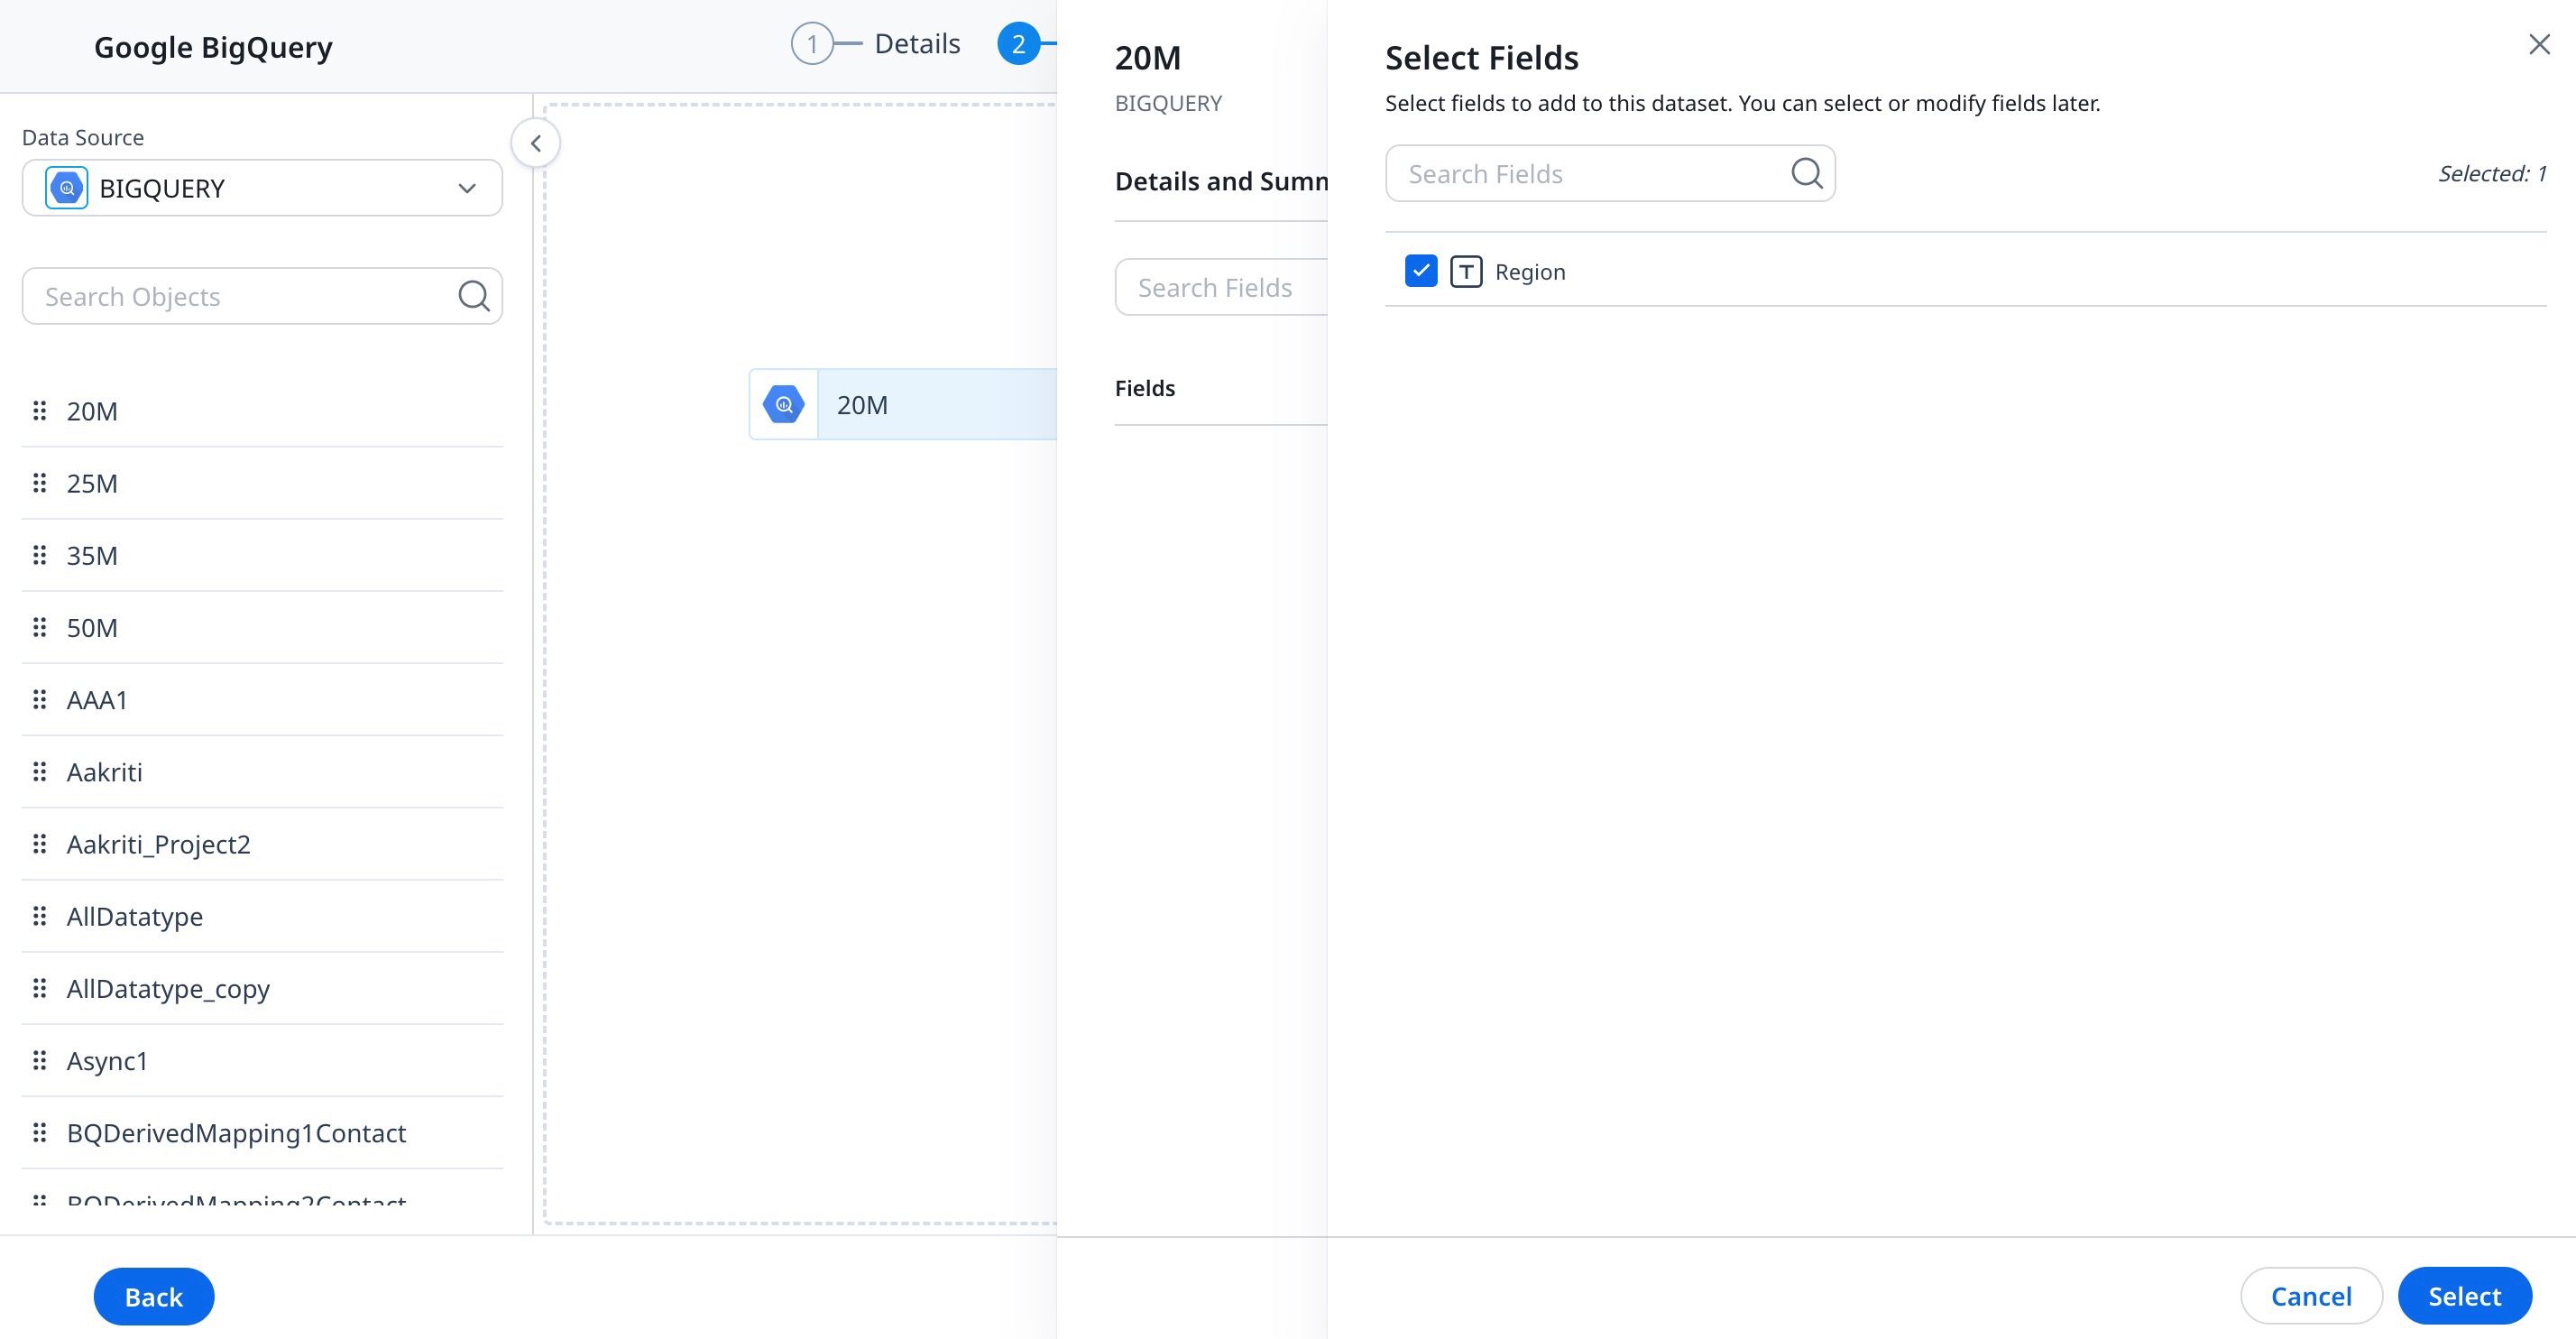
Select Fields
In the Select Fields side pane, all the fields available for the source object are displayed.
To select Fields:
- Select the required fields you want to add to the dataset.
- Click Select. The Object slide-out pane appears. This page displays the three tabs:
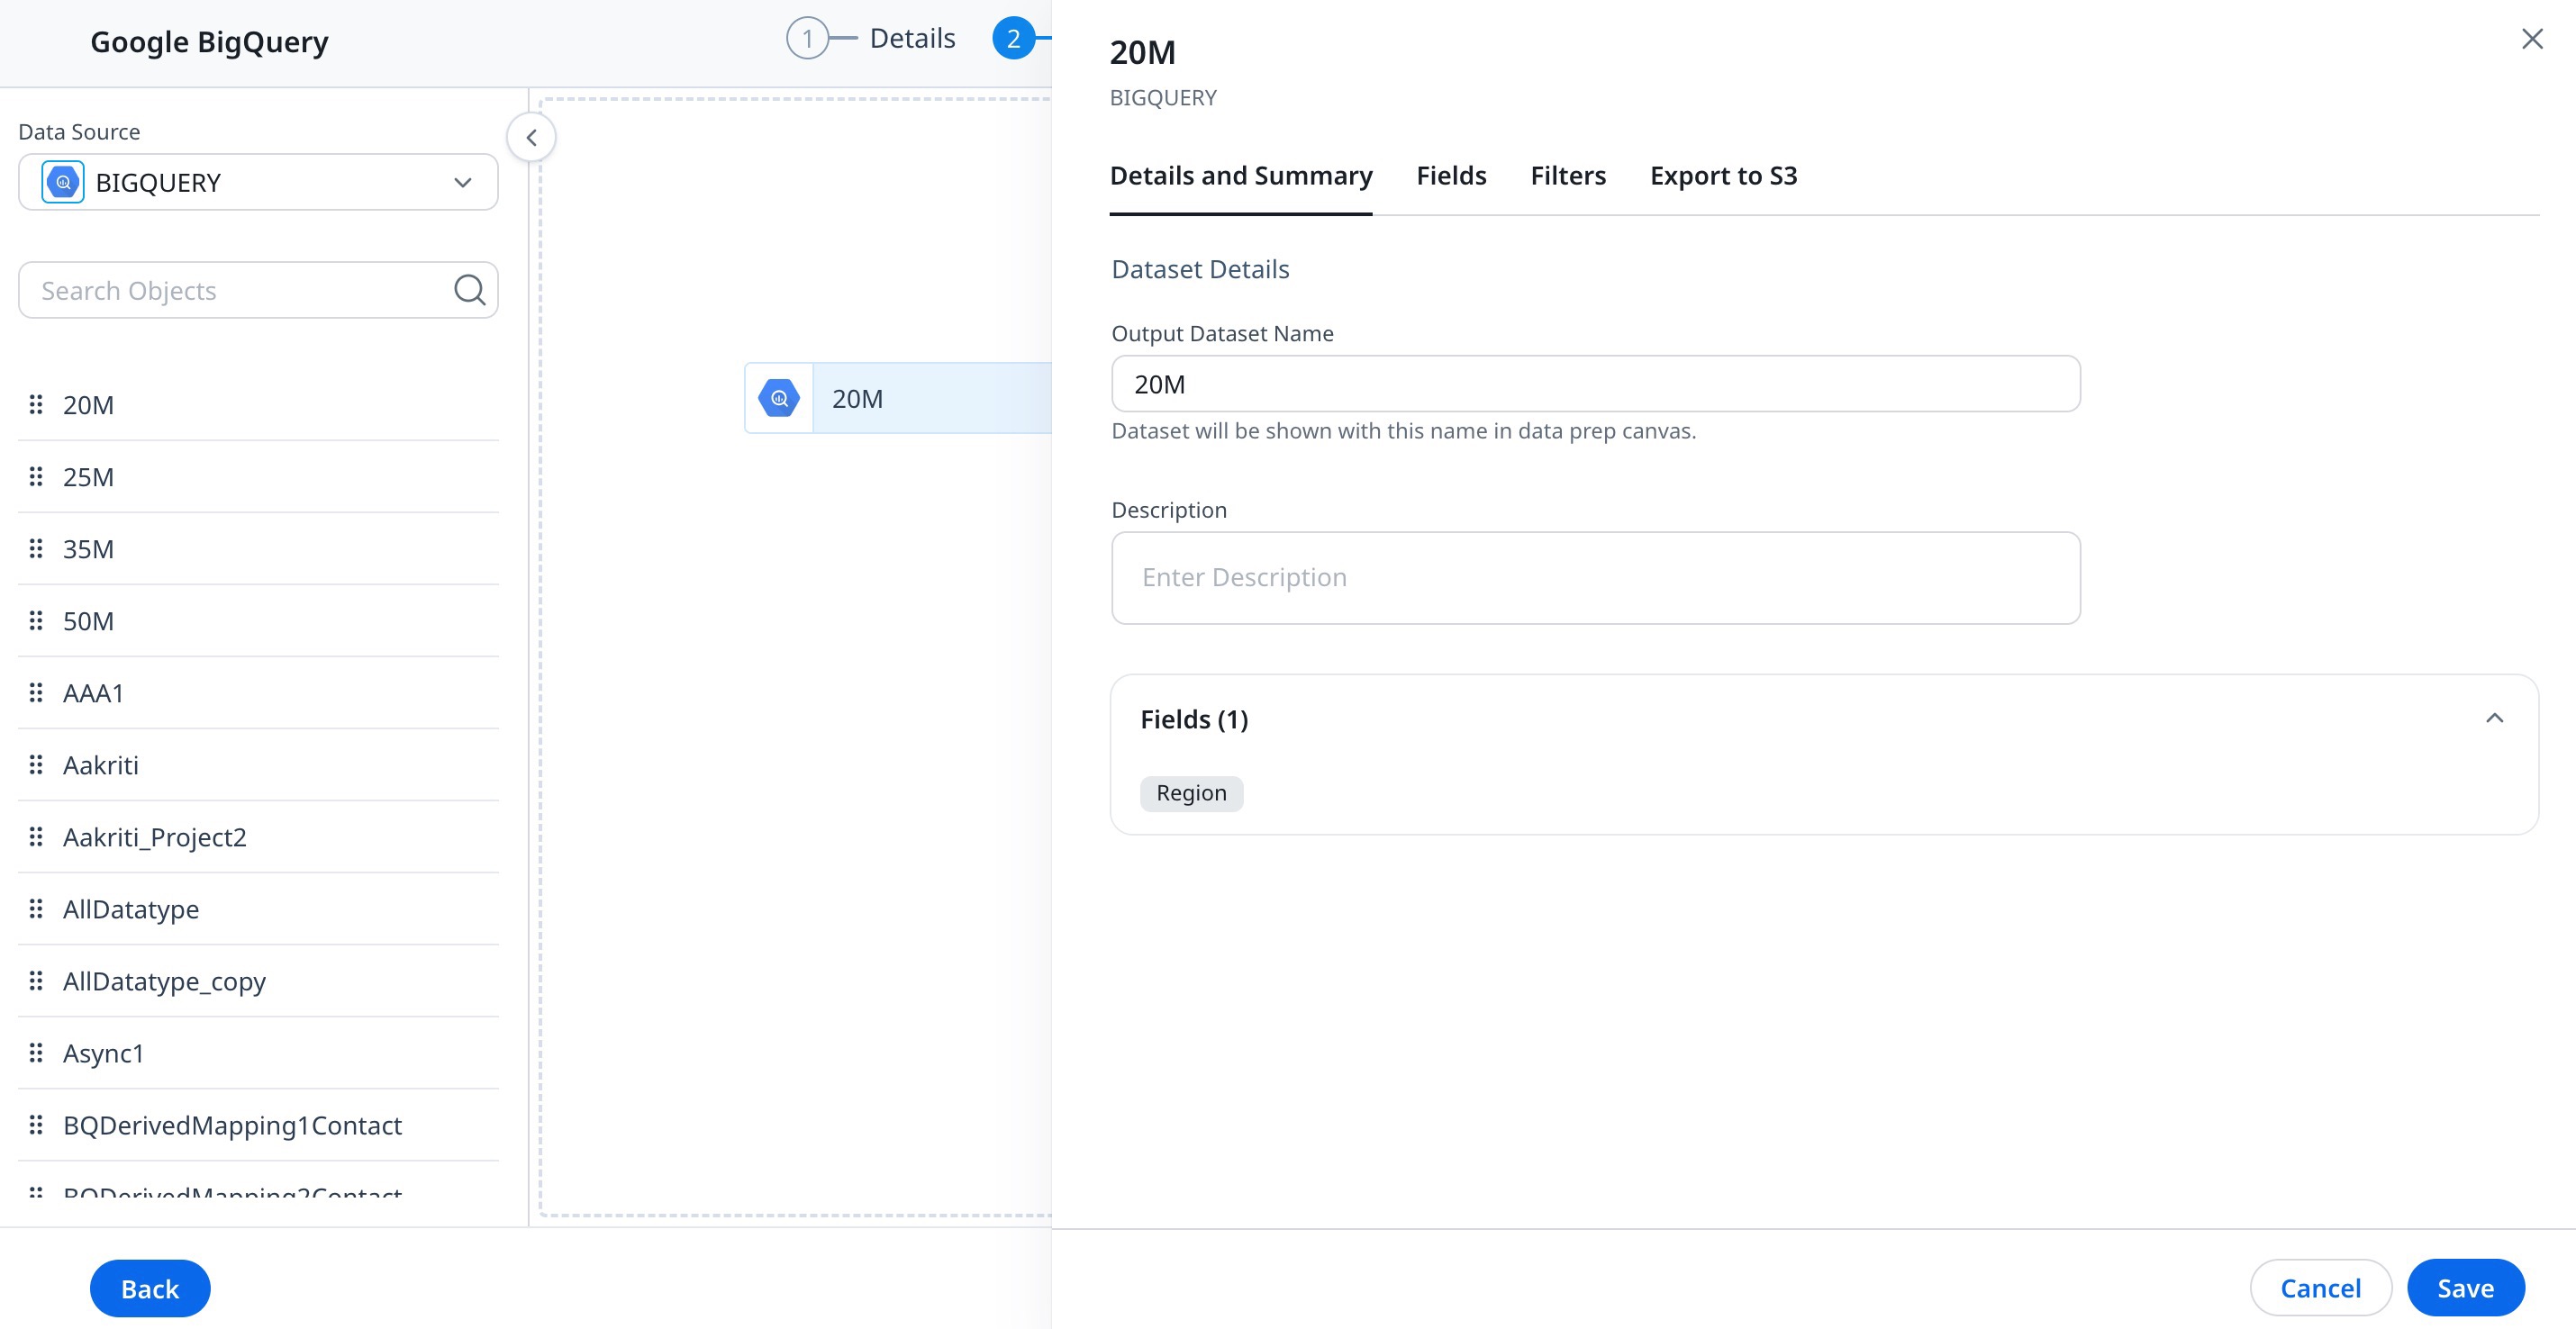
Details and Summary Tab
The following information is available in the Details & Summary tab:
- In the Output Dataset Name, enter the dataset name.
- (Optional) In the Description textbox, enter the description of the dataset as required.
- Fields & Filters: You can view a list of all Fields (including Group By, if any) and Filters in the Dataset.
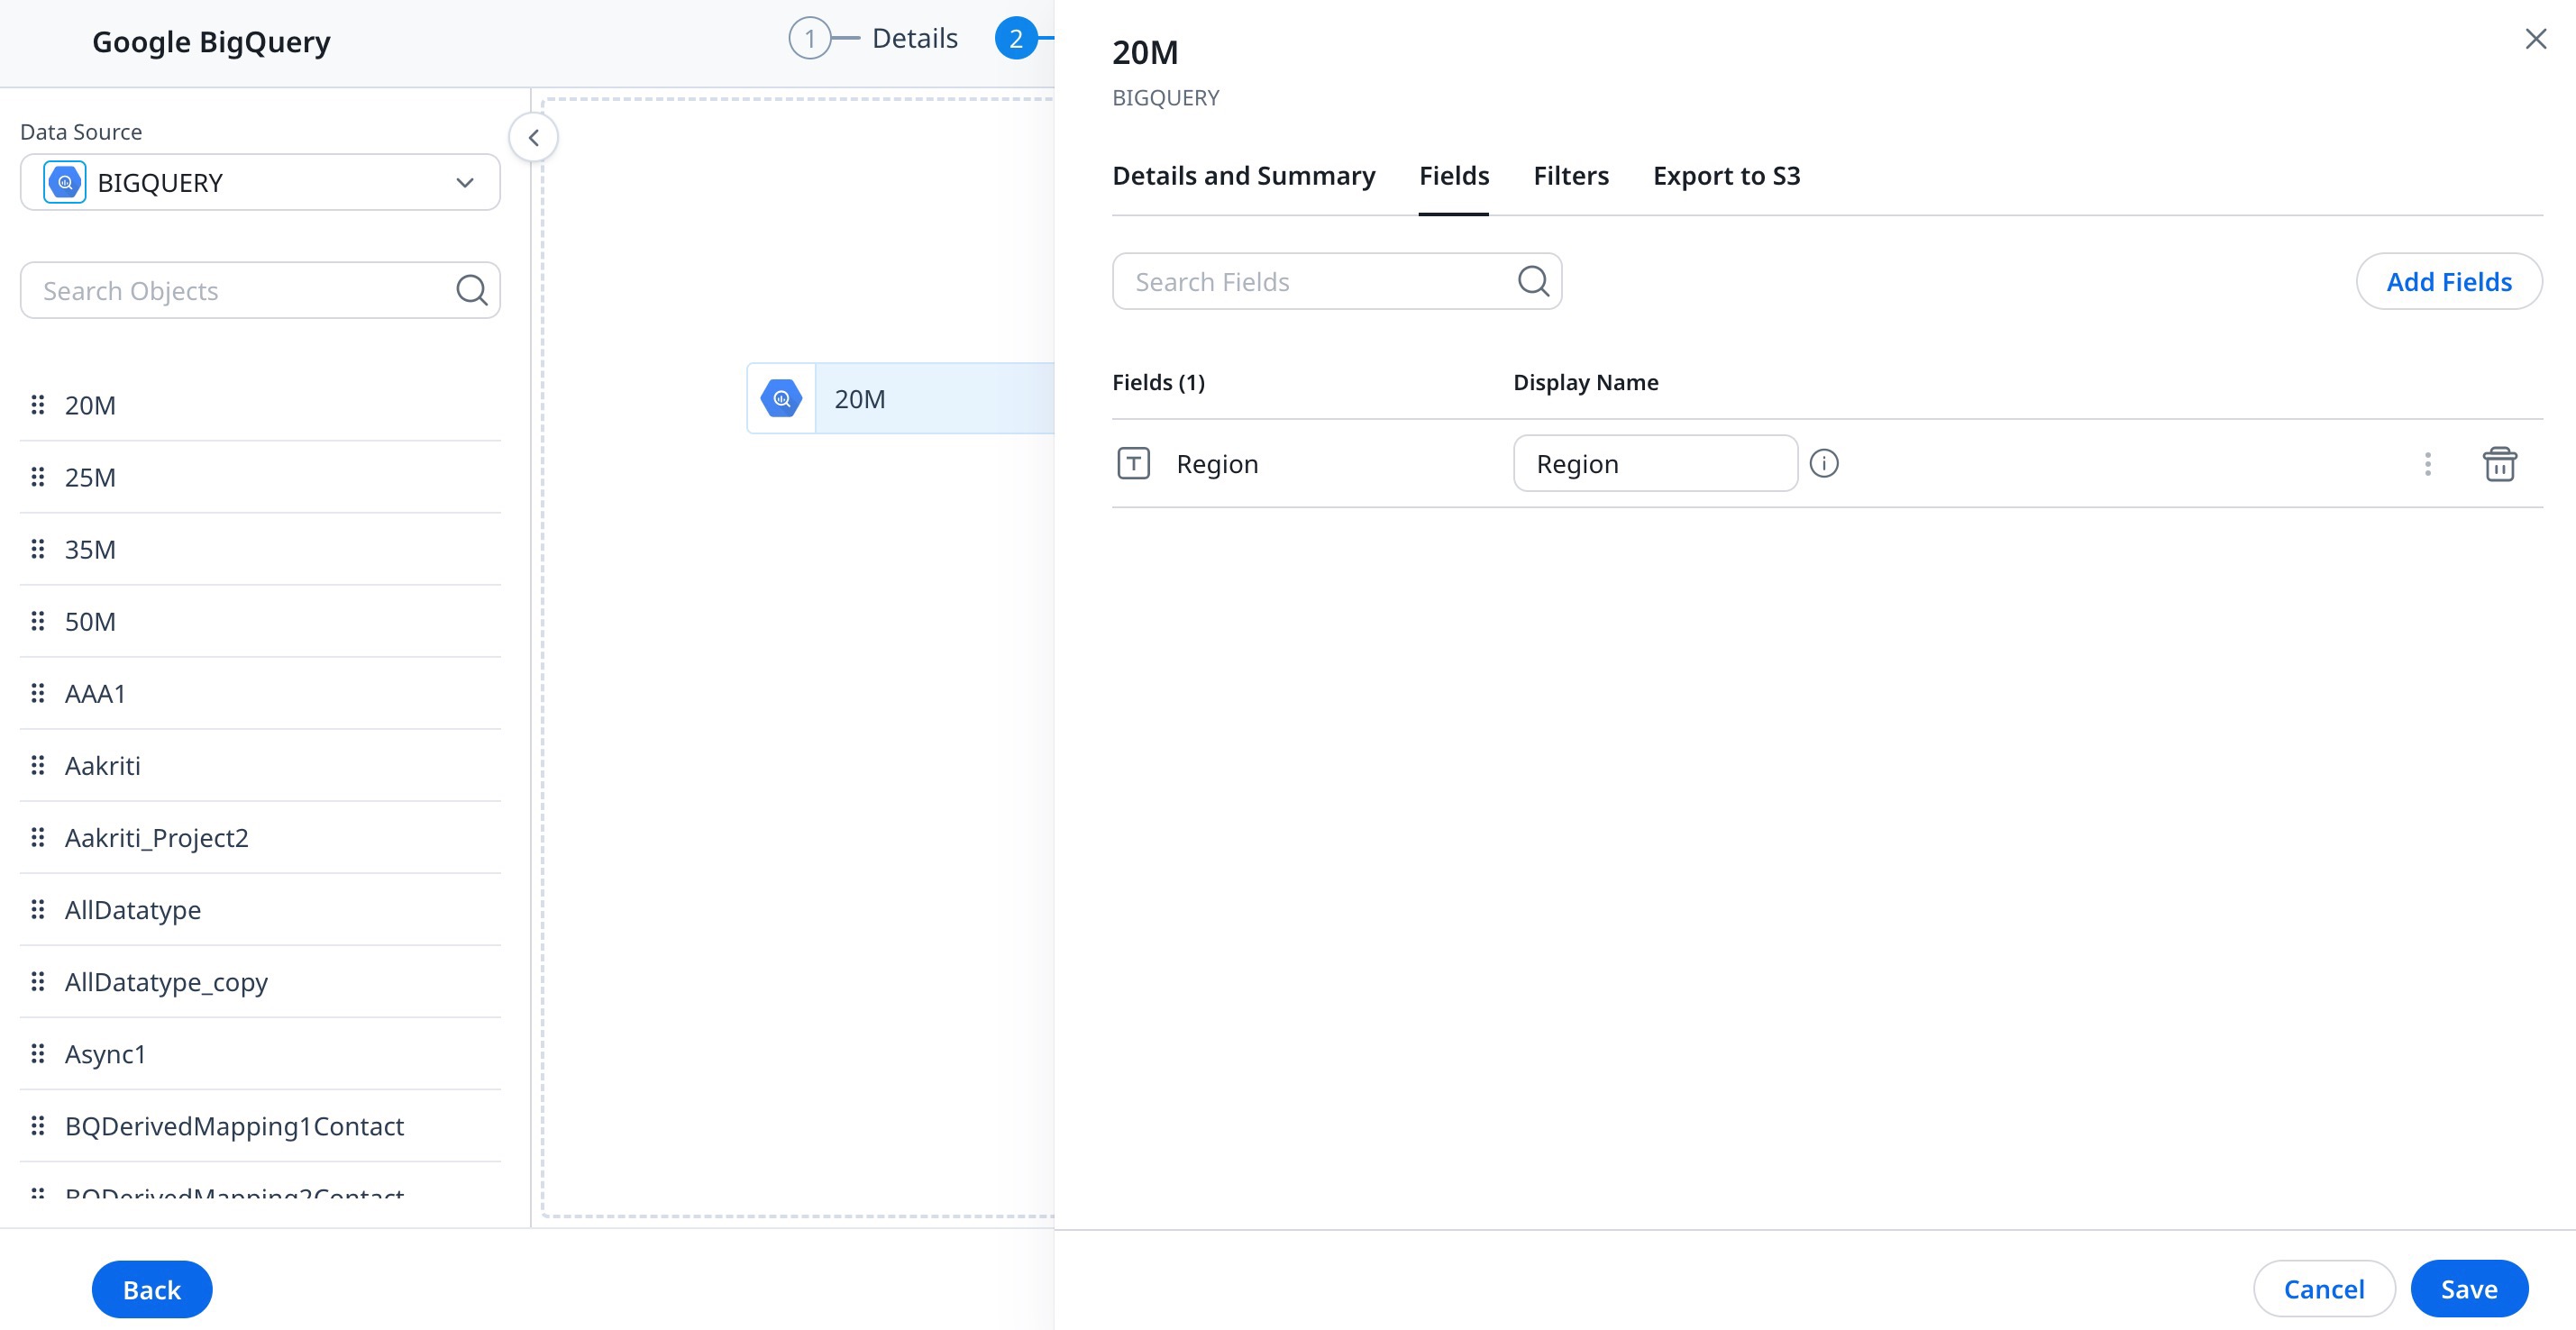
Fields Tab
This displays the following information:
- Fields: The name of the fields selected in the above step.
- Group By: You can select the required fields to Group By, to slice and dice the data in the dataset. Once you select a Field to Group By, all the other fields in the dataset will become aggregated.
- Aggregation: You can select the required aggregation type from the Aggregation dropdown list.
- Display Name: By default, the field name appears in the Display Name textbox. You can modify it as required. Display names are shown in the Datasets and reports.
To add additional fields:
- Click Add Fields, if additional fields are to be added.
- Click the Settings/Gear icon to make changes to numeric data type fields. For more information refer to the Preparation details in Data Designer article.
- Click the Delete/Trash icon to delete the field from the dataset.
- Click Save.
Filters Tab
To apply Filters:
- Navigate to the Filters tab.
- Click Add Filter.
- From the Field dropdown list, select the field to which the filter is to be applied.
- Choose the Operator and then input the data in the Value textbox.
Notes:- You can also Add more filters by clicking the + icon next to Value textbox.
- You can Delete a filter by clicking the x icon.
- You can add advance filters such as (A OR B) AND C, type in your desired expression in the Advanced Logic text box.
- Click Save.

Edit Datasets
To edit a Dataset:
-
Click the Pencil icon (or) click the three-vertical dots menu.
- Click Edit to modify a dataset. You will land on the following page as shown below.
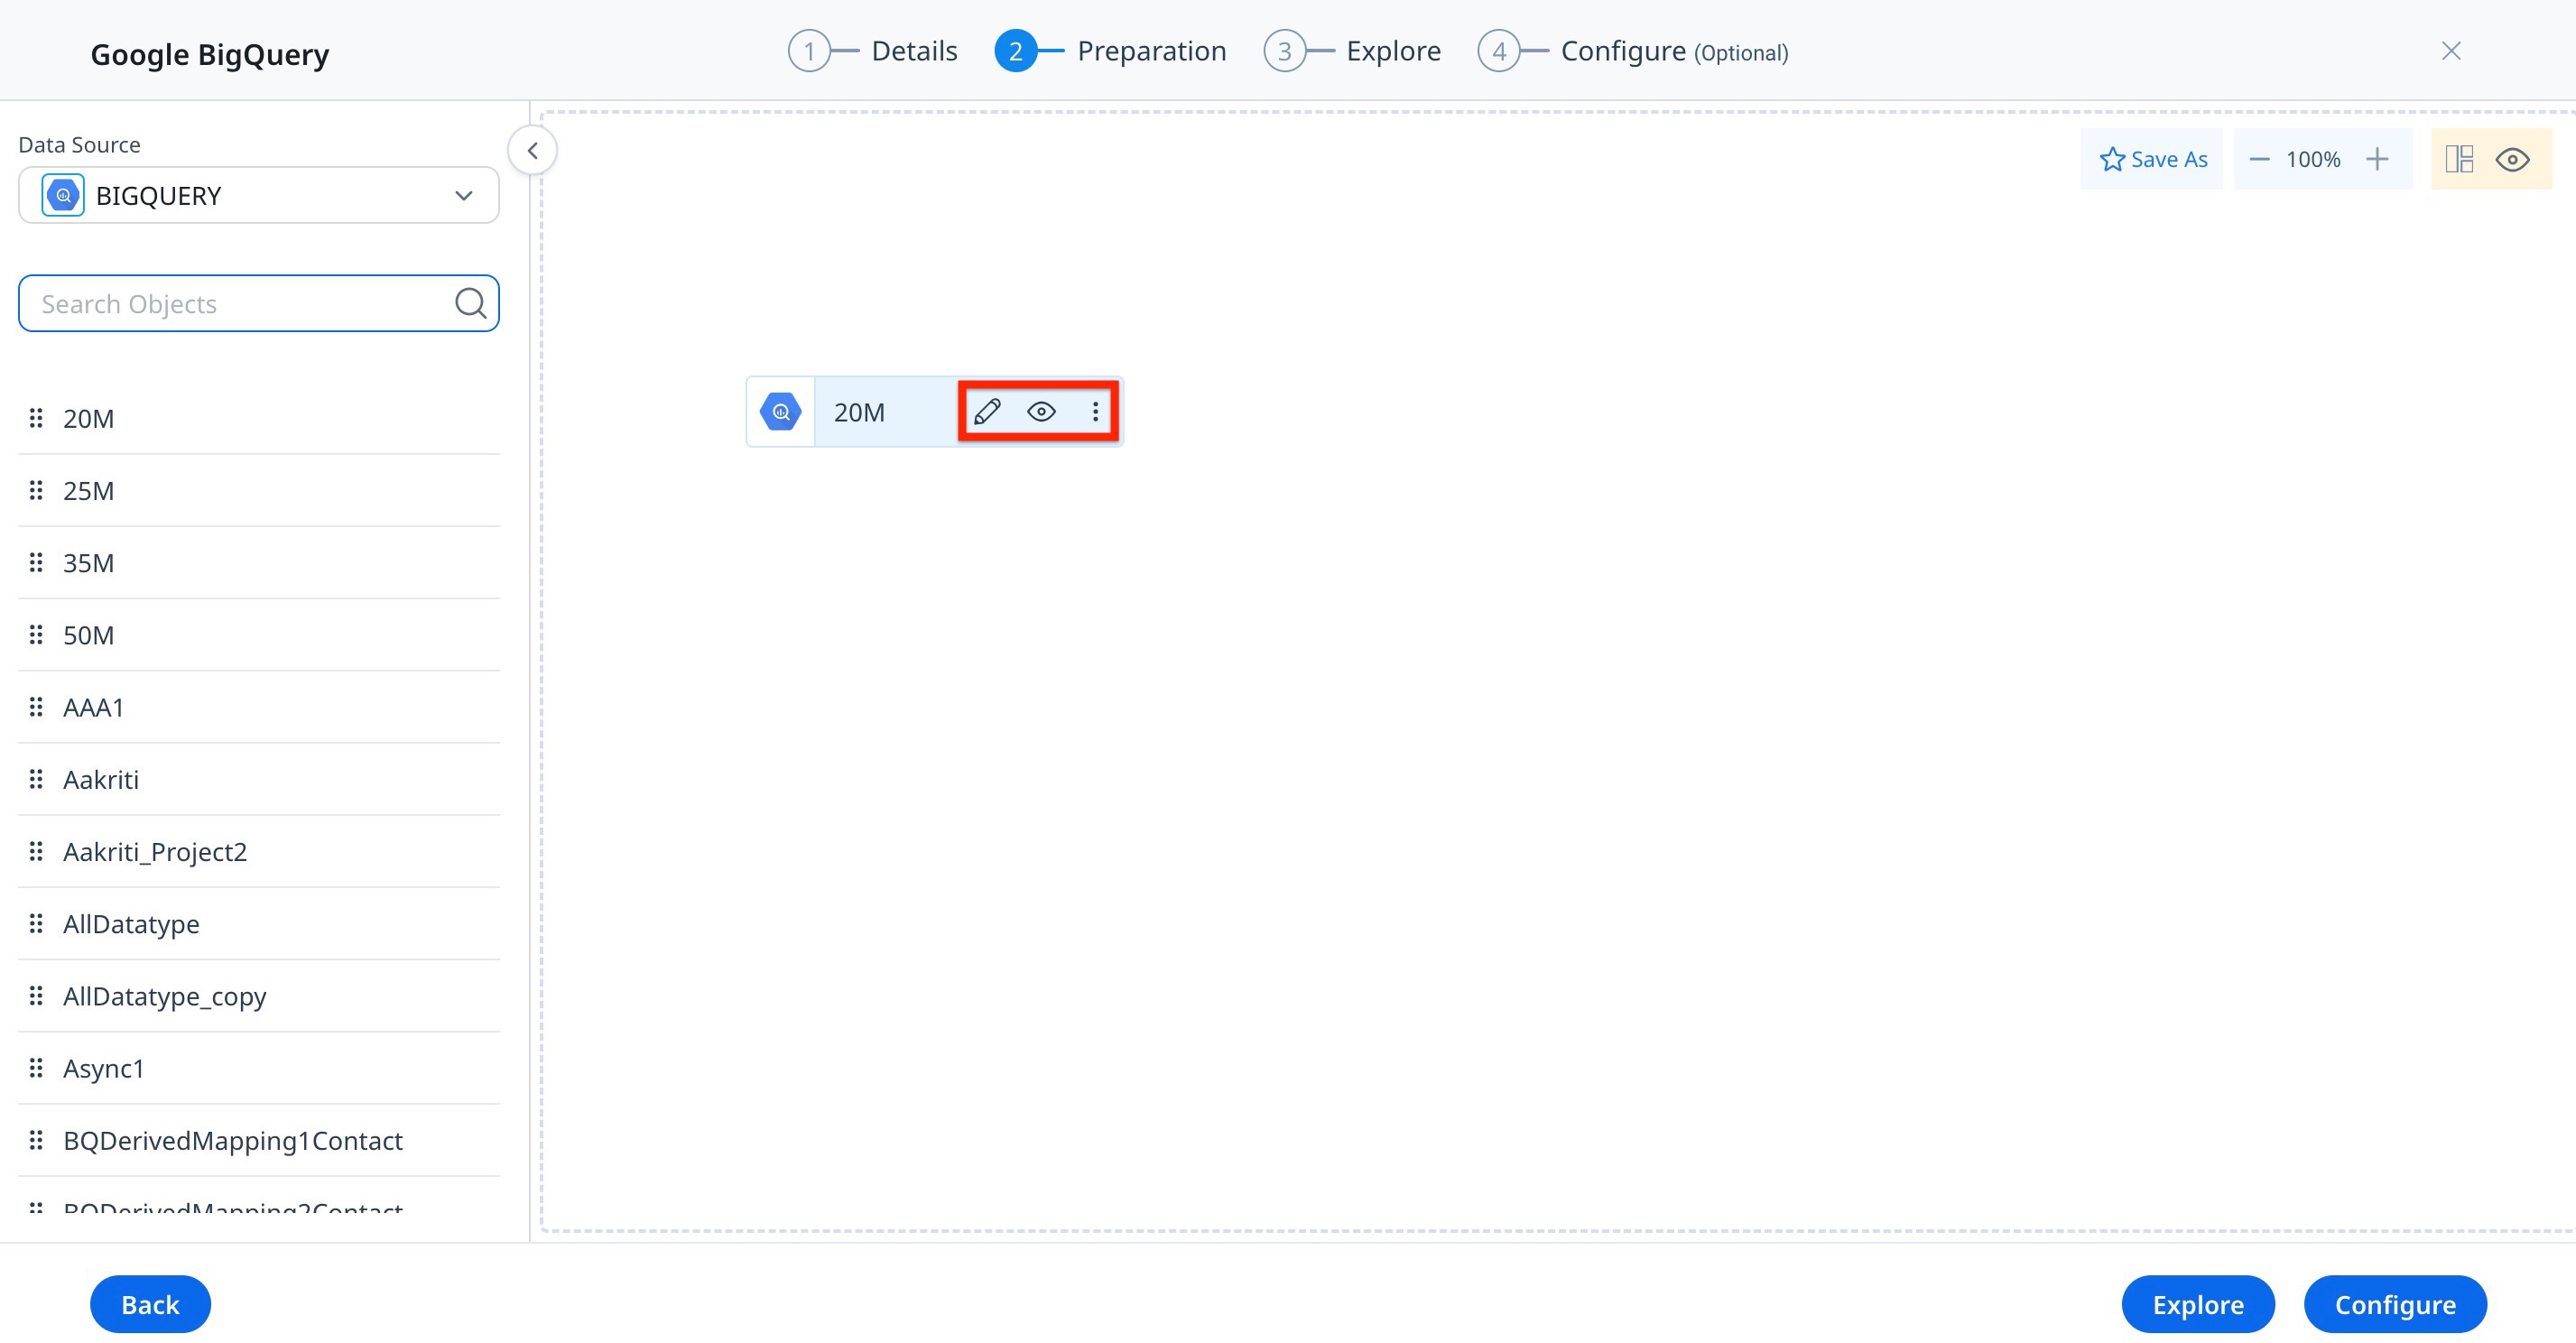
Edit the Output Dataset Name, Description, Fields, and Filters as required.
You can also create more Datasets from Salesforce, MDA data, Amazon S3, and Databricks, and perform Merge, Transform, and other actions on the created Datasets. Then, you can proceed to the Explore tab to analyze the data and create reports.
Additional Resources
- For information on how to edit, merge, or transform the datasets, refer to the Preparation Details in Data Designer article.
- For information on how to explore a dataset, refer to the Explore Details in Data Designer article.
- For information on how to create a dataset, refer to the Create Datasets in Data Designer article.
- For information on the most frequently asked questions on Data Designer, refer to the Data Designer FAQs article.