Dashboard List View and Create New Dashboards
Gainsight NXT
This article explains Dashboards in Adoption Explorer, its various types, and how to create and manage them using the ingested data.
Note: This article is the fifth item in a series of Adoption Explorer configuration articles. Gainsight recommends you to refer to the initial articles of the series and then start with this article.
Overview
This article explains the Dashboard listing page, Dashboard detail view, and how to create a Dashboard at Company and Person level using the usage data ingested into the Adoption Explorer Objects. For more information on how to ingest usage data into Adoption Explorer Objects, refer to the Configure Adoption Explorer Objects article from the Additional Resources section of this article.
You can view the Dashboard Configuration section in a project via the following paths:
- Navigate to Adoption Explorer > Administration. Click the project and then the Dashboard Configuration tab.
- Users who have access to the Analytics page, navigate to Adoption Explorer > Analytics and click the required project and then the Dashboard Configuration tab.
Note: Admins can grant access to specific users to the Analytics page using Permission Bundles. These specific users can create and edit dashboards in a project.
This document mainly describes:
Dashboards
A Dashboard in Adoption Explorer provides a snapshot of customer usage data and insights, such as Company's Total Page Views by Page Title, Who are the Top 10 users of this week, What are the Top 10 Pages viewed, Company's ARR contribution, Which segment does the customer belong to, A side by side graph of a measure from one period to another, and so on. All these individual insights are called Usage Reports and a logical grouping of such reports is called a Dashboard.
Usage Reports are the main artifacts of a Dashboard, which display usage data for a given configuration. For example, you can add Usage Report for A Company’s Total Page Views by Page Title, A Person’s Page Views by Page Title, A Company’s ARR Contribution, A Company’s Segmented ARR, etc. For more information on how to add a new Usage Report, refer to the Create Usage Report in a Dashboard article from the Additional Resources section of this article.
Types of Dashboards
Adoption Explorer has five types of Dashboards - Company, Person, CSM, Freeform, and Segment.
Company Dashboard
You can use the Company dashboard to filter data based on the Company and its Instance (optional) in a given time frame (using Start and End date).
Person Dashboard
You can use the Person Dashboard to filter data based on the Person from the selected Company and Instance (optional) in a given time frame (using Start and End date).
CSM Dashboard
You can use the CSM dashboard to filter data based on the selected CSM. The users you see in the CSM Users dropdown list are fetched from the Gainsight User Object.
Freeform Dashboard
The Freeform dashboard displays the records across all of the companies data loaded to the specific project. For example, you have a Segmented ARR field in Company Information object, and want to know the list of Companies that fall under Low band, and take necessary business actions.
Segment Dashboard
You can use the Segment dashboard to filter criteria based on the existing Segmented fields in the Company and Person Information objects. For example, to see the Sum of Unique Page Views of Companies with High ARR, you can set the Segmented ARR filter criteria as High.
Filters defined in a Segment Dashboard are available in view only mode to all the Adoption Explorer users. Users need not create a new filter from scratch if the filter is already defined by another user. For example, when two different users analyze the same set of data, one of the users can create the filter and another user can use the same one.
Note: Only the user who created the filter can modify it.
Dashboard Listing Page
To view the existing Dashboards:
- Navigate to Adoption Explorer > Administration/Analytics.
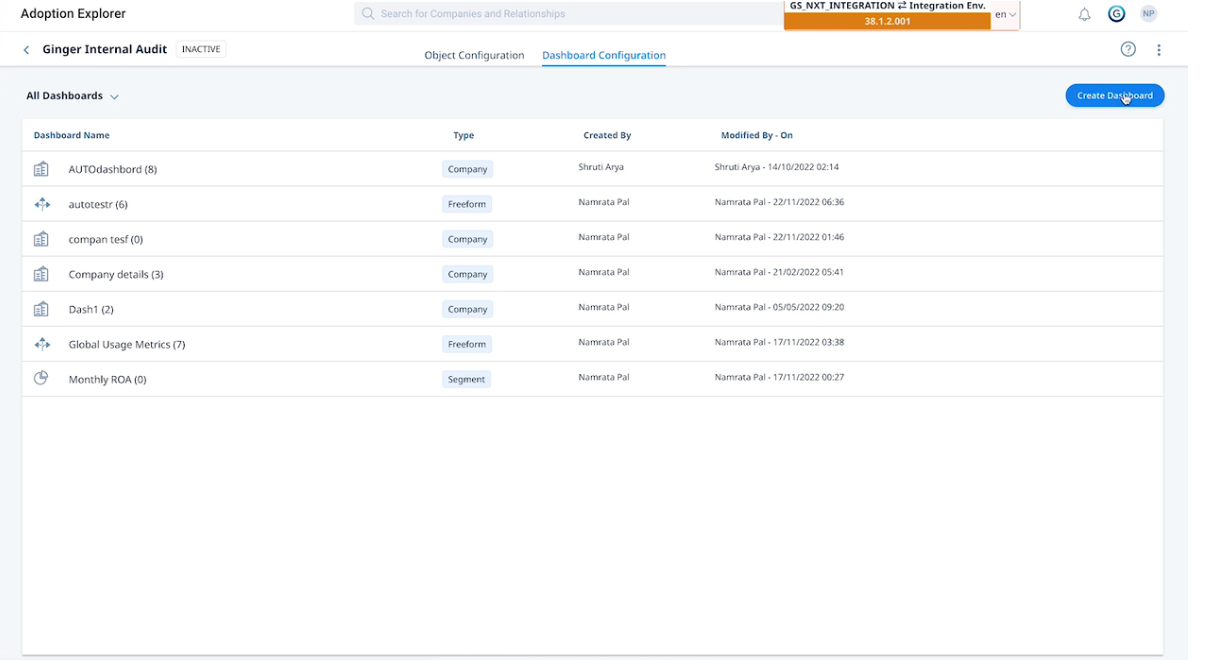
- Click the Dashboard Configuration tab to view existing dashboards in the selected project.
You can perform the following actions from the dashboards listing page:
- Switch between the list of All Dashboards, All Usage Reports, and Dashboards that you own using the dropdown menu on the top-left.
- Create a new Dashboard.
- Delete a Dashboard.
- Edit the Dashboard name.
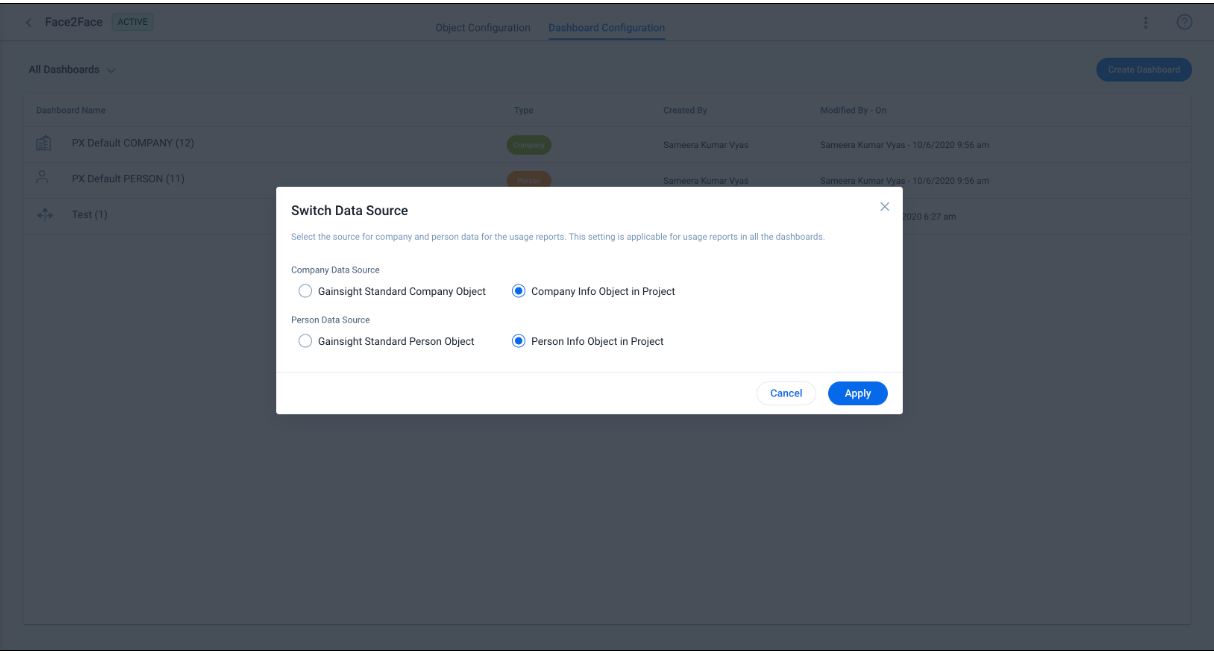
- To select the source for company and person data for the Usage Reports, click the three-vertical dots icon and then select Switch Data Source. This setting is applicable for Usage Reports in all the Dashboards.
IMPORTANT: Edit and delete operations on the Dashboards and Usage Reports can be performed only by the Super Admins and Owners (Created By). Non-super admins/users can create a Dashboard in any project and add Usage Reports to it.
Create Dashboards
To create a Dashboard:
- Navigate to Adoption Explorer > Administration/Analytics.
- Click the project name.
Note: In the selected project, ensure that usage data is ingested into the Adoption Explorer Objects and fields are configured. For more information on how to ingest usage data into Adoption Explorer Objects, refer to the Configure Adoption Explorer Objects article from the Additional Resources section of this article. - In the Dashboard Configuration tab, click Create Dashboard.
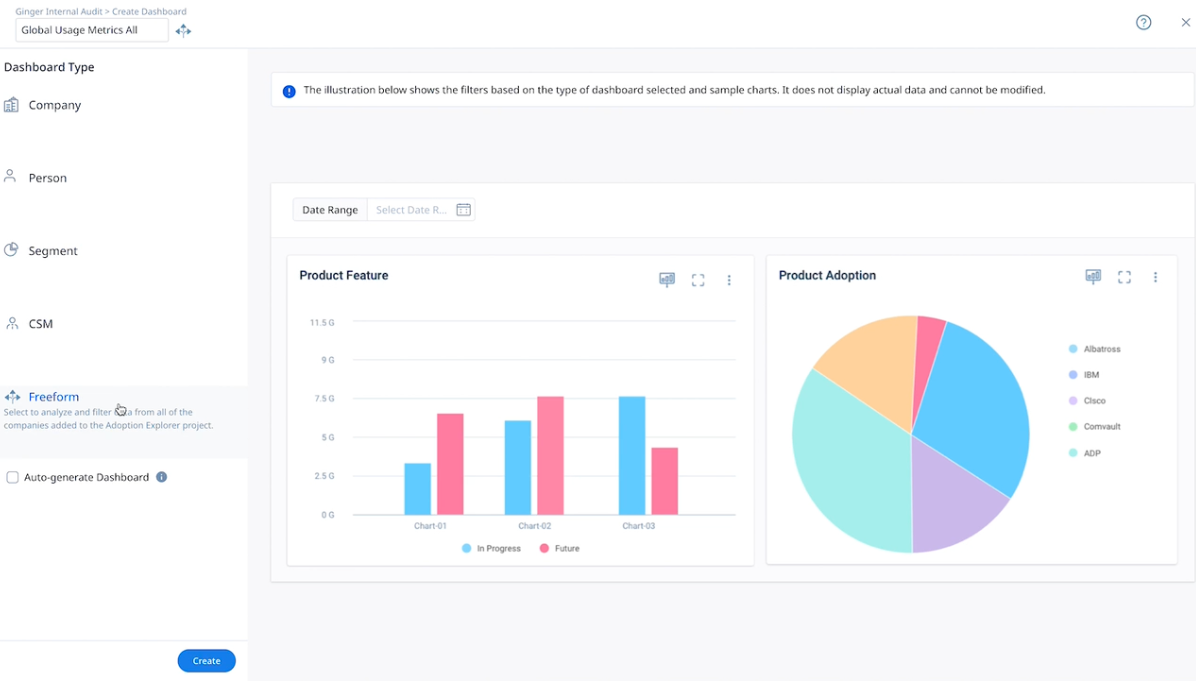
- Enter the Name of the dashboard.
- Select the Dashboard Type. For more information on dashboard types, refer to the Types of Dashboards section.
- Select the Enable Instance Level Filtering checkbox to create reports using the Company and instance level data. This option is only available for projects created with instance level data.
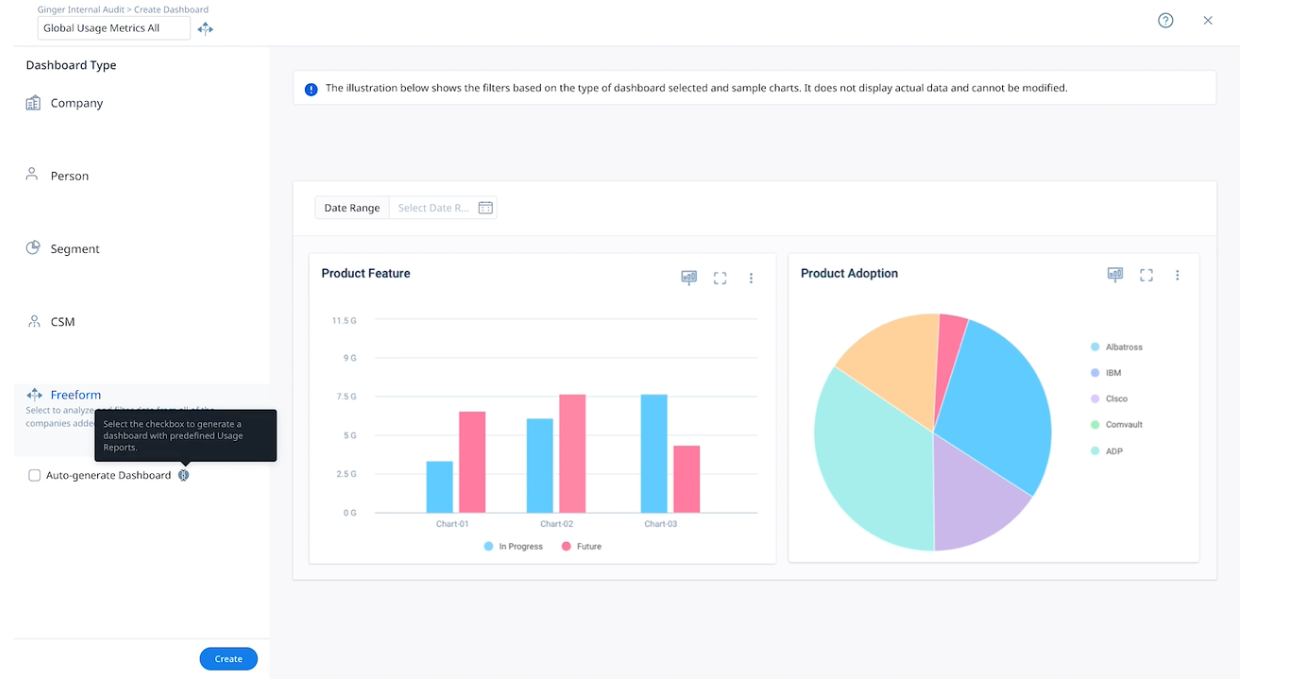
- NEW (Optional) Select the Auto-generate Dashboard checkbox to generate a dashboard with predefined Usage Reports curated based on your data. For more information on which mode to select, refer to the Dashboard Creation Mode section.
- (Optional) Select the Mark as Default Dashboard checkbox to set the dashboard as default.
- Click Save.
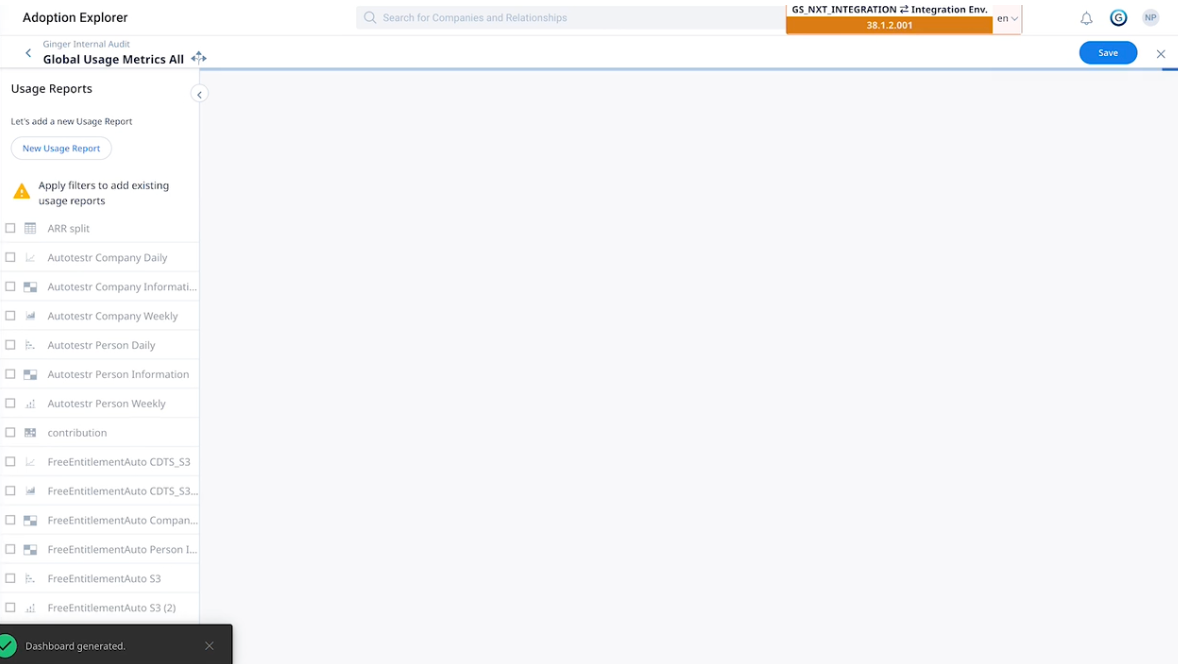
Once a Dashboard is created, you can create a new Usage Report or add an existing Usage Report to the Dashboard. For more information on how to create a Usage Report, refer to the Create Usage Report in a Dashboard article from the Additional Resources section of this article.
Auto-Generated Dashboards
While creating a Dashboard in Adoption Explorer, you have the option to select the preferred mode of how the dashboard should be created.
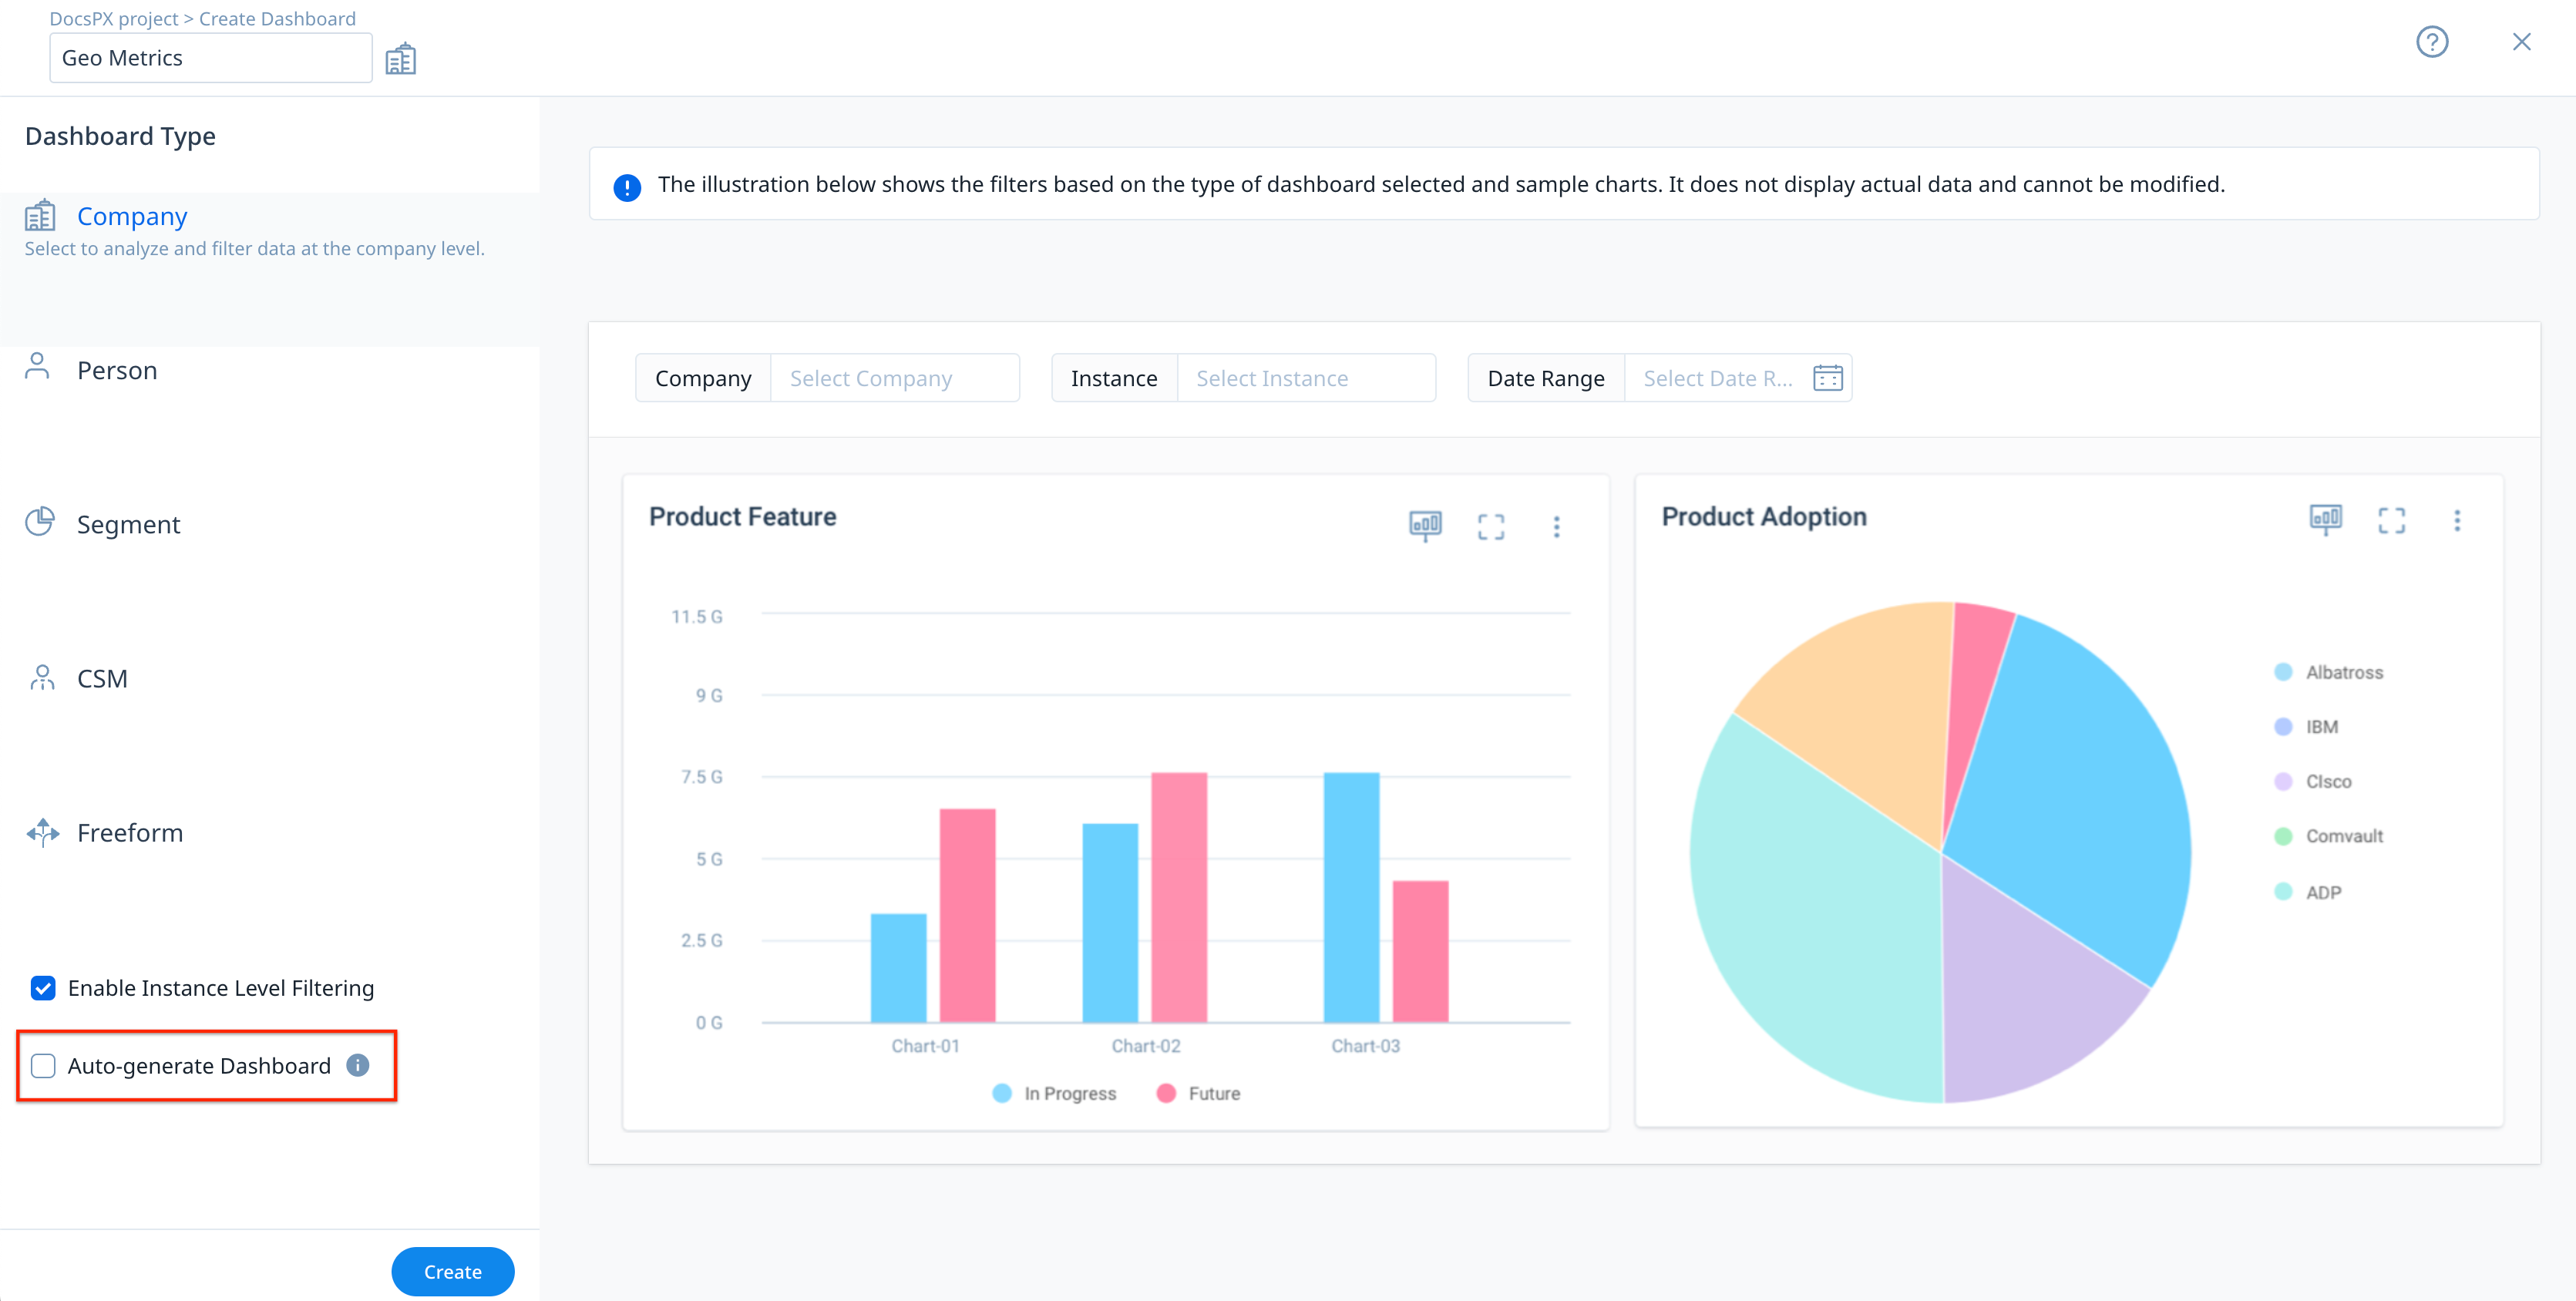
Select the Auto-generate Dashboard checkbox to allow Gainsight to automatically use Measures and Dimensions available from your objects and curate a list of Usage Reports to get you started. You can edit the Usage Reports that were created, or add or remove Usage Reports based on the requirement.
Based on the type of Project, following are the Usage Reports generated in the Automatic mode:
| Type of Project | Usage Report Name | Type of Chart | Description |
| Gainsight PX Project | Count of Total Users | Tile | Count of total Users (derived from the Company information as sum of total user, and aggregated by Instance Id) |
| Monthly Active User | Tile | Monthly Active User field | |
| Top 10 Engagements | Vertical bar | Sum of Engagement Events count and Engagement Name, aggregated by Engagement Name, primary and secondary Id, ordered by Engagement Events count in descending order for the first 10 records | |
| Top 10 Features Company Daily | Pie | Sum of Feature Events Count and Feature Name for Company object, aggregated by Feature Name primary and secondary Id, ordered by Feature events count in descending order for the first 10 records | |
| Features Used | Tile | Count of distinct feature Ids | |
| Top 10 Features Used Person Daily | Pie | Sum of Feature Events Count and Feature Name for Person object, aggregated by Feature Name, ordered by Feature events count in descending order for the first 10 records | |
| Standard Project | Time series objects | Single series | Any measure and date field |
| Info objects | Tile | Any measure field |
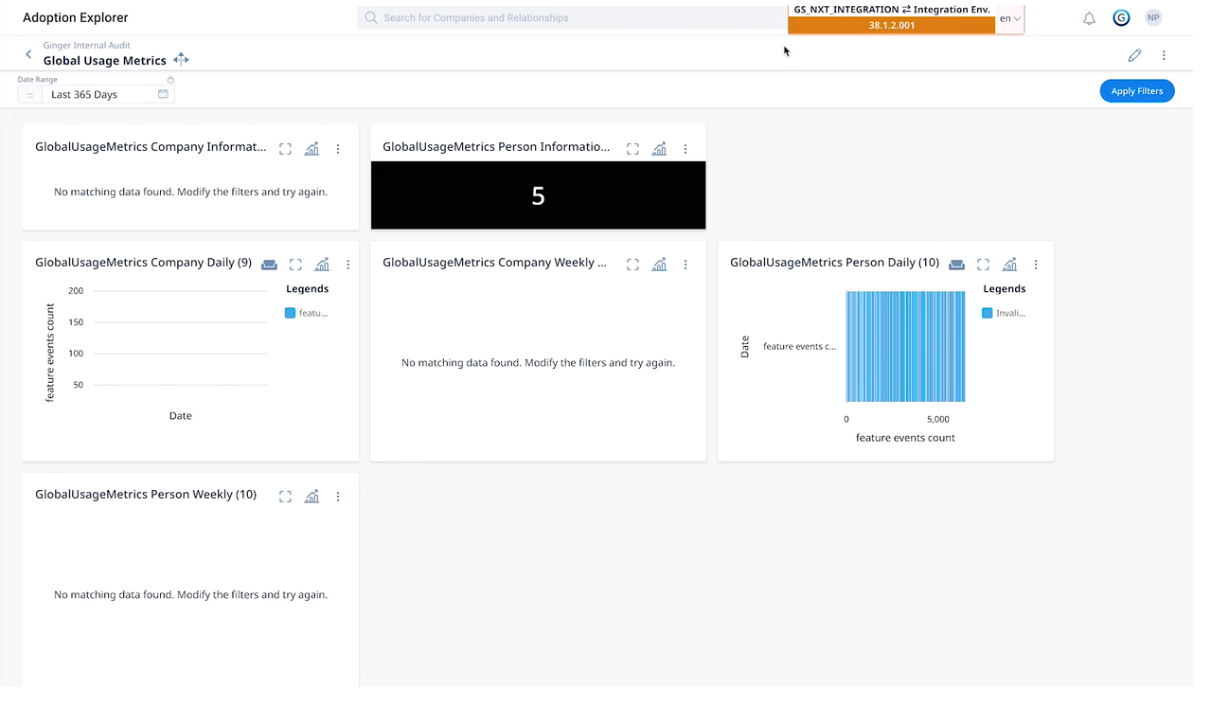
Note: In case the dashboard could not be created, click the Regenerate button to retry creating the dashboard.
Dashboard Detail View
The Dashboard detail view displays the configured Usage Reports with applied filters. You can drag and drop the Usage Reports to rearrange the positions within the Dashboard.
Following are the filters specific to each dashboard:
| Dashboard | Filters |
|---|---|
|
Company Dashboard |
|
|
Person Dashboard |
|
|
CSM Dashboard |
|
|
Freeform Dashboard |
|
|
Segment Dashboard |
|
The list of companies/persons you see in the Company/Person dropdown depends on the data source that you have selected in the Dashboard listing page.
- If you have selected the Global Filter Company Name Search via as Company Object, you will see all the records from Gainsight’s Company Object.
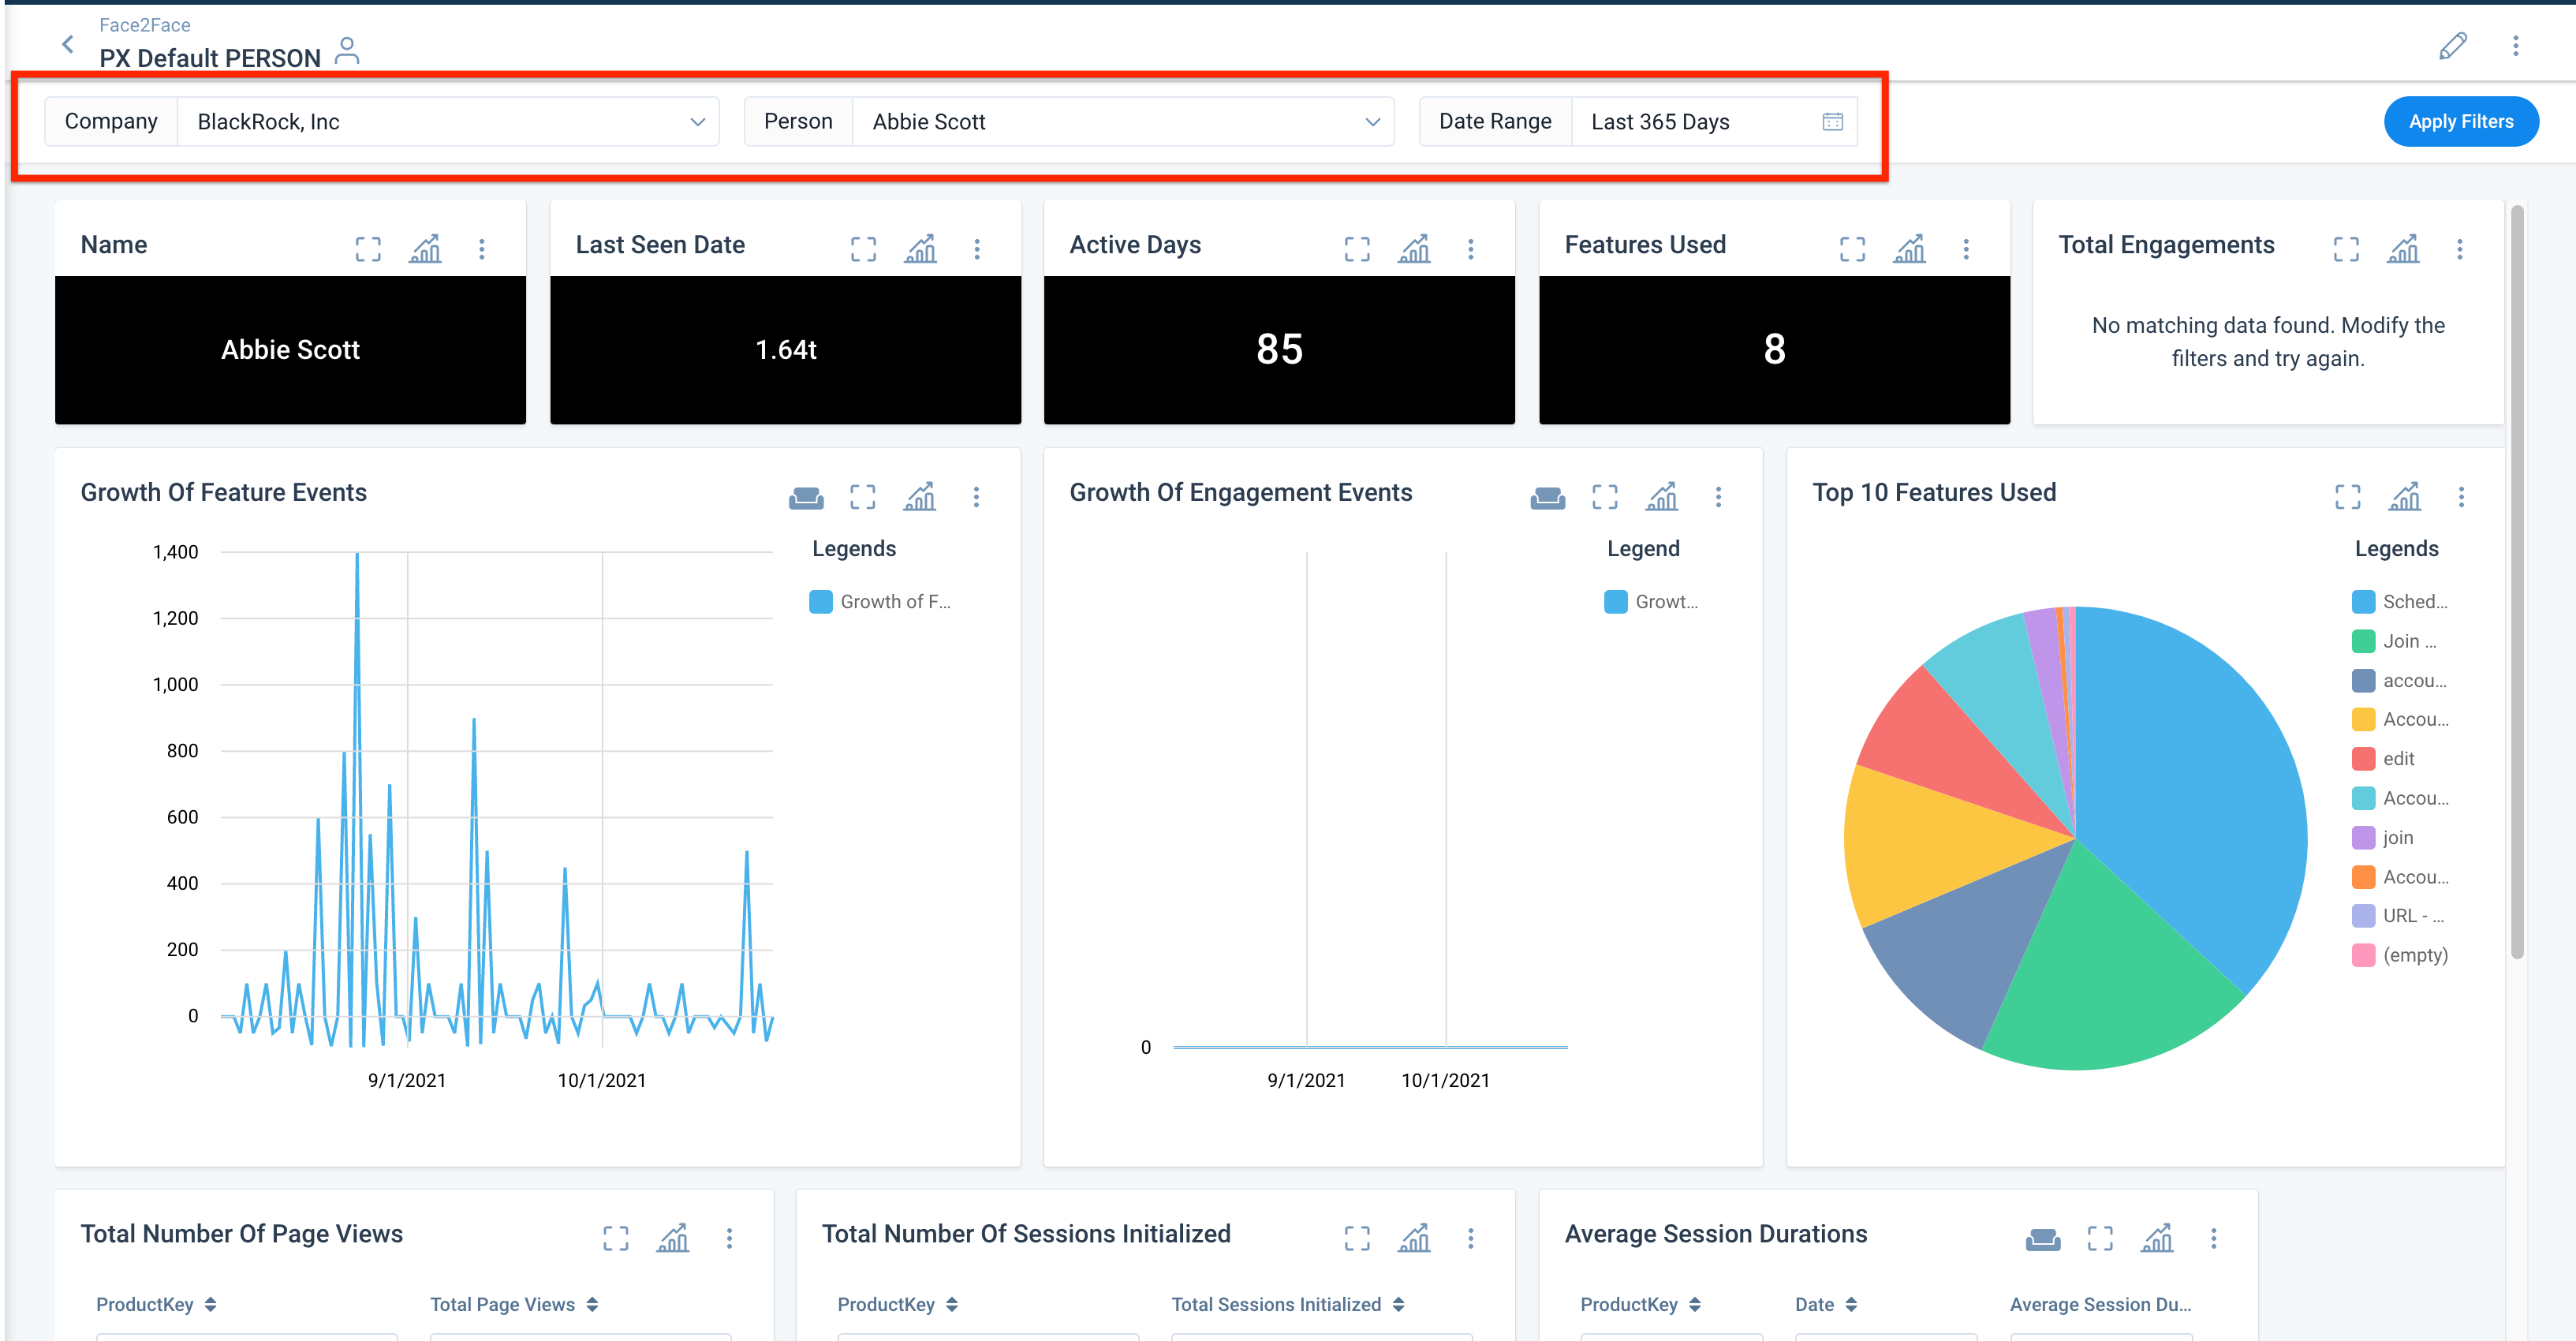 If you have selected Company Information Object, you will see all the records from Company Information Object, created from Adoption Explorer.
Note: The same settings apply for Person as well.
The following options are available for the Dashboard via the kebab menu icon:
- Save Search: Save the selected filters and use them as default search filters for that user.
- Change Theme: Display a set of themes from which you can select the theme that best suits the given Dashboard.
- Export: Export the complete Dashboard as a PDF/Image.
- Make Default: Make the dashboard as the default selection.
- Toggle Legends: Include or exclude the legends on all the Usage Reports.
- Toggle Weekends: Include or exclude the weekends usage information.
- Delete: Delete the Dashboard permanently. You can also delete a Dashboard from the Dashboard listing page.
The following options are available for a Usage Report based on the type:
- Change Visualization: Change the required chart type.
- Enlarge: View that Usage Report in an expanded view. You can also select the required chart type from the available list.
- Toggle Legends: Include or exclude the legends of that Usage Report.
- Toggle Weekends: Include or exclude the weekend usage information to calculate metrics.
- Export to CSV: Export the individual Usage Report in the Dashboard as CSV.
- Selective Measures: Filter measures for which the report is displayed.
Other Operations
In the Dashboard detail view, you can perform the following operations:
- Edit Dashboard
- Add New Usage Report
- Add Existing Usage Report
Edit Dashboard
Click the Edit icon to turn the Dashboard view page into edit mode. In the edit mode, you can perform the following actions:
- Drag and drop the Usage Report to change its position.
- Clone the existing Usage Report and modify it with required filter conditions.
- Edit the existing Usage Report.
- Delete the Usage Report.
- Configure Global Filters for all Usage Reports
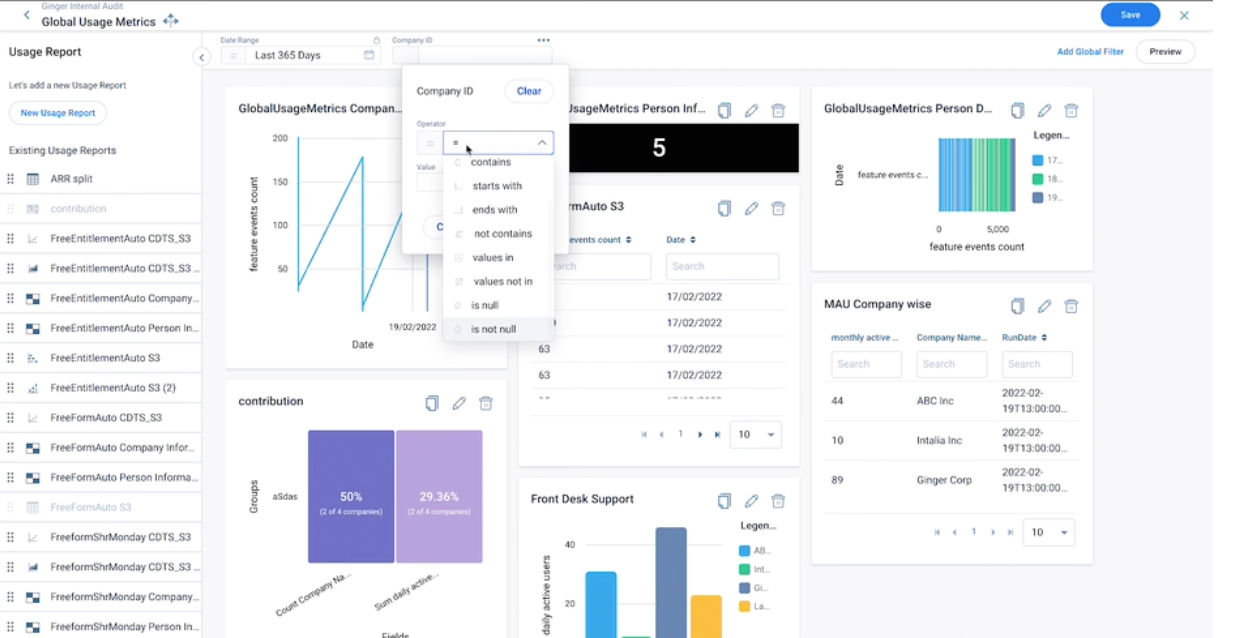
Add Global Filters to Usage Reports
A Global Filter enables you to create filters at the dashboard level. These filters allow you to slice and dice all Usage Reports on a dashboard in one go. For each Usage Report that uses the Global Filter, you can specify the field on which you want to filter and then set the value of the filter.
Note: You can add a maximum of three Global Filters to a dashboard.
To configure a Global Filter:
- Click the Edit Dashboard icon.
- From the top-right corner, click Add Global Filter.
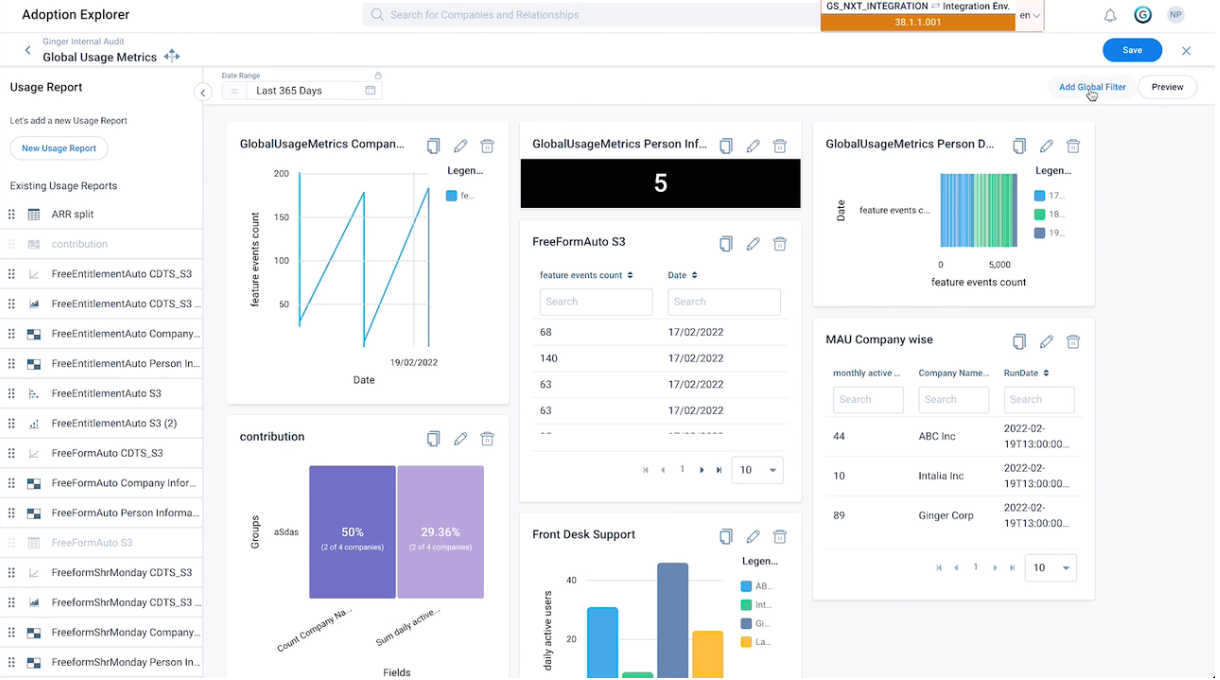
- In the Name field, enter a name for the filter.
- (Optional) In the Tooltip field, enter a description that appears upon hovering over the filter.
- From the Object dropdown menu, select the object on which the filter should be created.
- From the Select Field dropdown menu, select the reference field based on the object selected. All Usage Reports that use the selected field are automatically selected in the Reports section, along with the reference field selected.
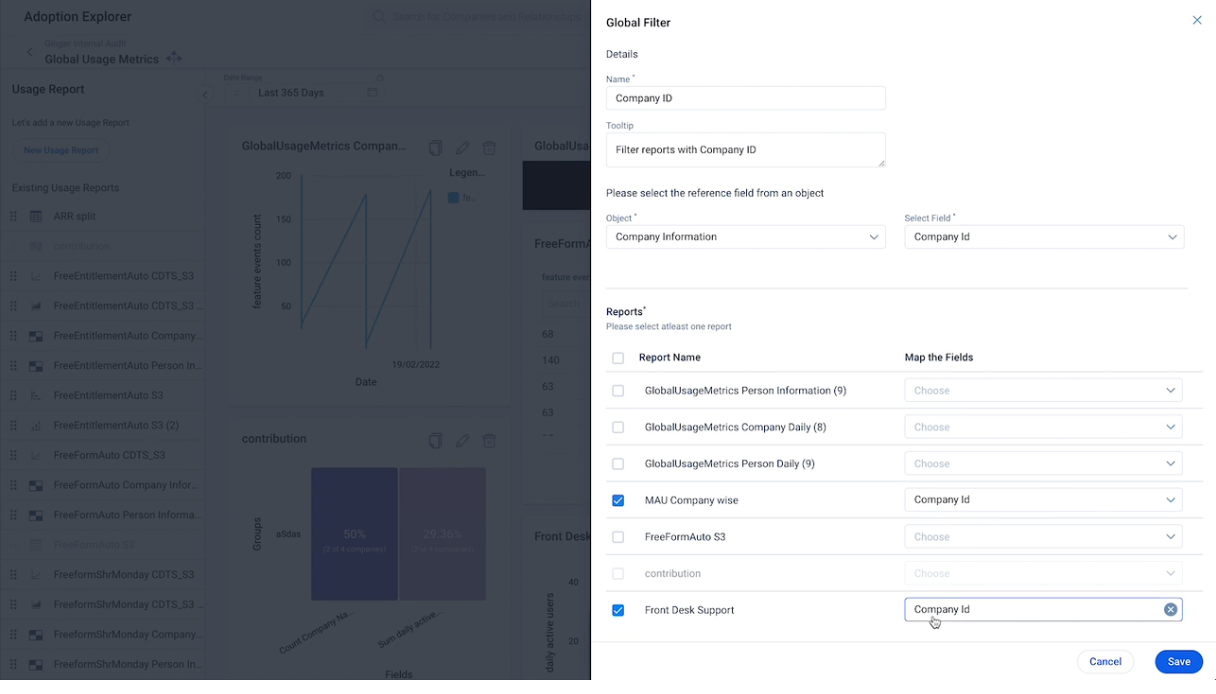
- In the Reports section, select the checkbox next to the Usage Reports for which the global filter is to be applied
- From the corresponding Map the Fields dropdown menu, select the field for which you want to apply the filter.
Note: Only fields that are of the same data type as the reference field can be seected. - Click Save.
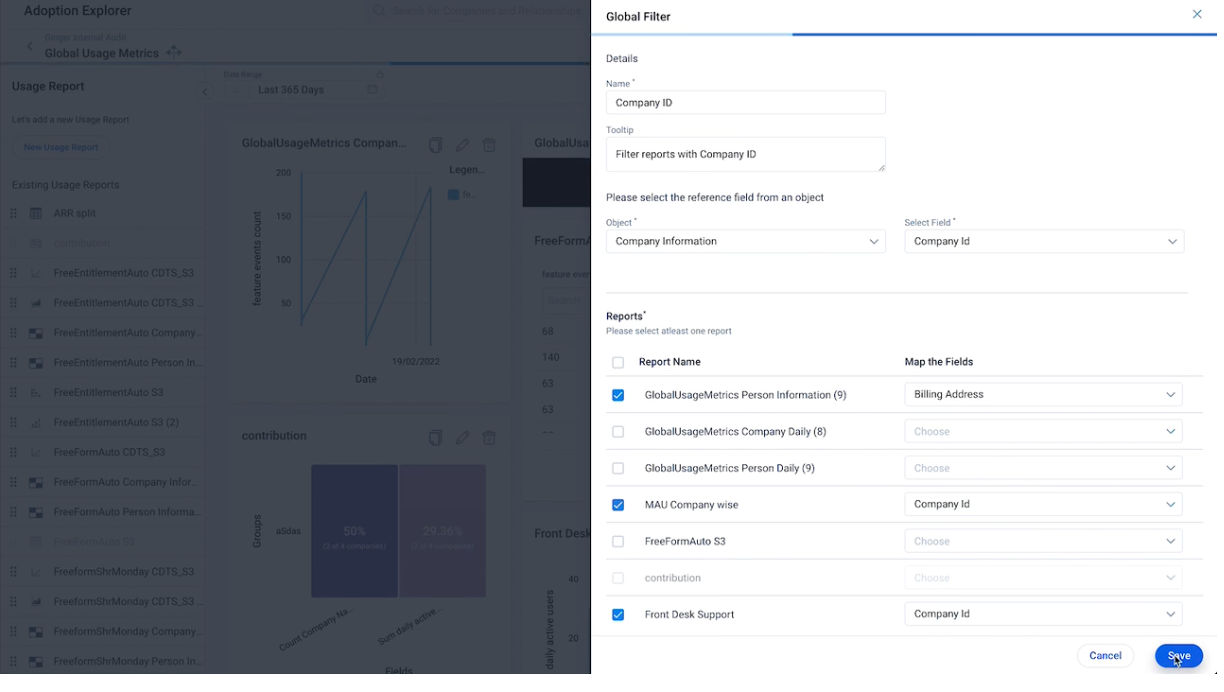
The filter is added to the header of the Dashboard. Hovering over the filter highlights the Usage Reports that uses the filter as follows:
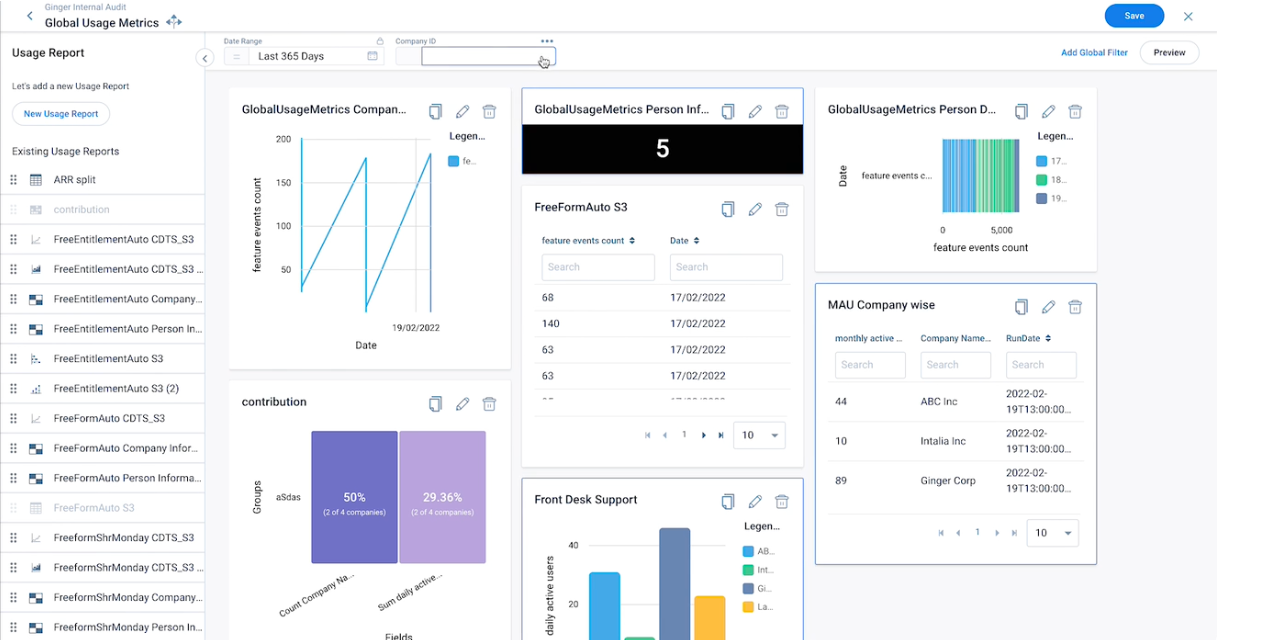
To apply a Global Filter:
- Click the filter to add a value.
- From the Operator dropdown menu, select the operator for the filter.
- In the Value field, select the value by which the Usage Reports are to be filtered.
- Click Apply.
Note: Click the three-horizontal dots icon to edit or delete the filter using the Configure or Delete option respectively.
Add New Usage Report
Click the New Usage Report button to add a new Usage Report to the Dashboard. For more information on how to create a Usage Report, refer to the Create Usage Report in a Dashboard article from the Additional Resources section of this article.
Add Existing Usage Report
To add an existing Usage Report:
- Select the Dashboard in which you want to add a usage report.
- Click the Edit Dashboard icon option on the top-right corner.
- In the Dashboard detail view, drag and drop the required usage report from the left pane.
- Click Save.