Surveys Analytics Overview
Gainsight NXT
Overview
After a survey is published, Admins can use the survey to configure Programs and Email Assist tasks in CTAs. Admins can also use the Anonymous Survey link and paste into emails or to display on a website. For more information on how to create, design, and distribute a survey, refer Configure Surveys (path).
After a published survey has been responded to by participants, responses and analytics of this survey can be tracked and stored in Gainsight.
This article explains how an admin can use the Analyze section in Surveys to view and analyze recipient responses for a published survey. Admins can also view analytics for NPS® surveys. For more information on NPS Analytics, refer to the NPS® Overview article.
To view the Analyze page of a Survey, navigate to Administration > Surveys > [select a specific Survey] > [click the ANALYZE tab]. On the Surveys Analyze page, there are three subsections: Survey Statistics, Response Report, and Text Analytics.
Survey Statistics
Survey Statistics displays information on overall participant responses. Survey Statistics displays:
- Participants chart to display the participants response data
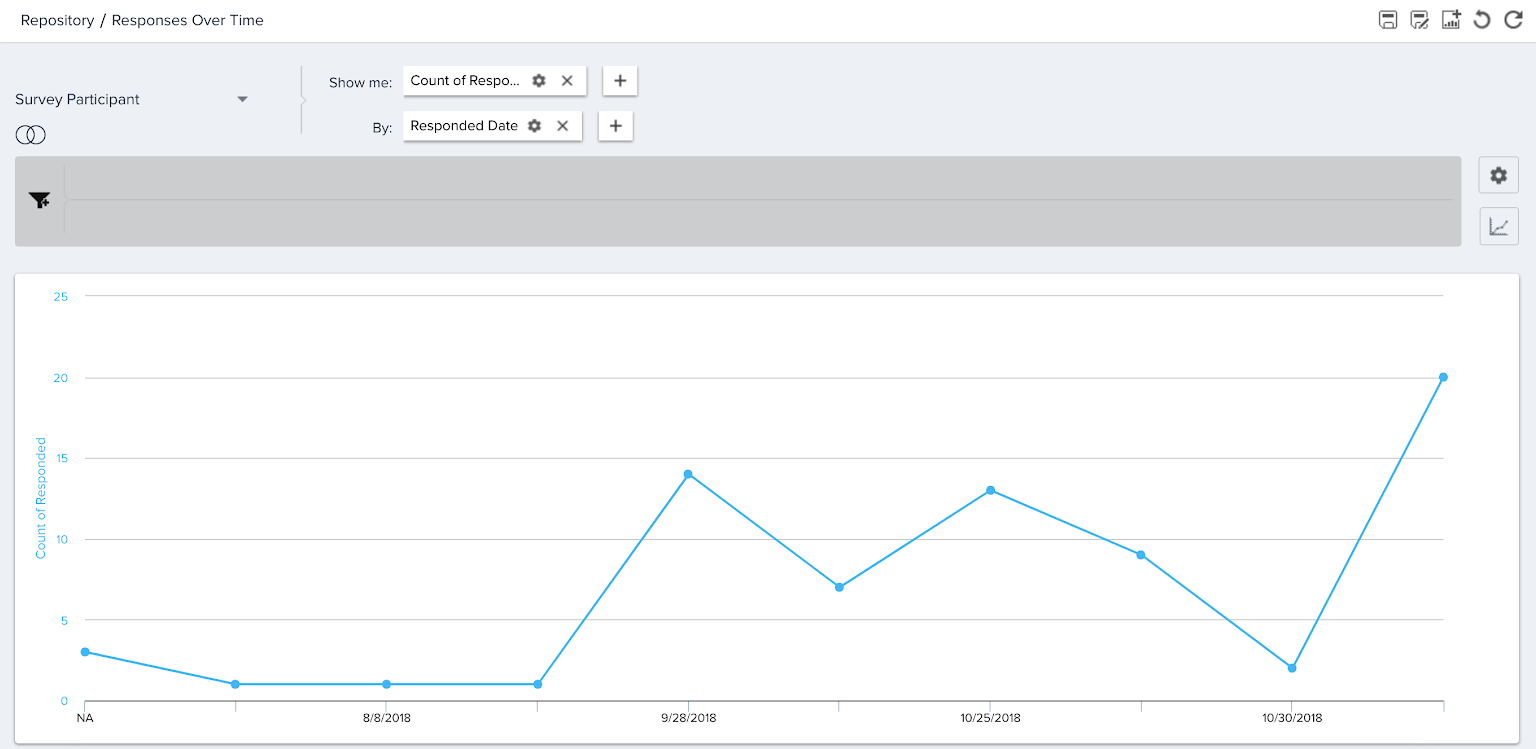
- Line graph to display the number of participant responses over time.
- List of total users for the types of participants shown in the participant chart and their associated details of the survey.
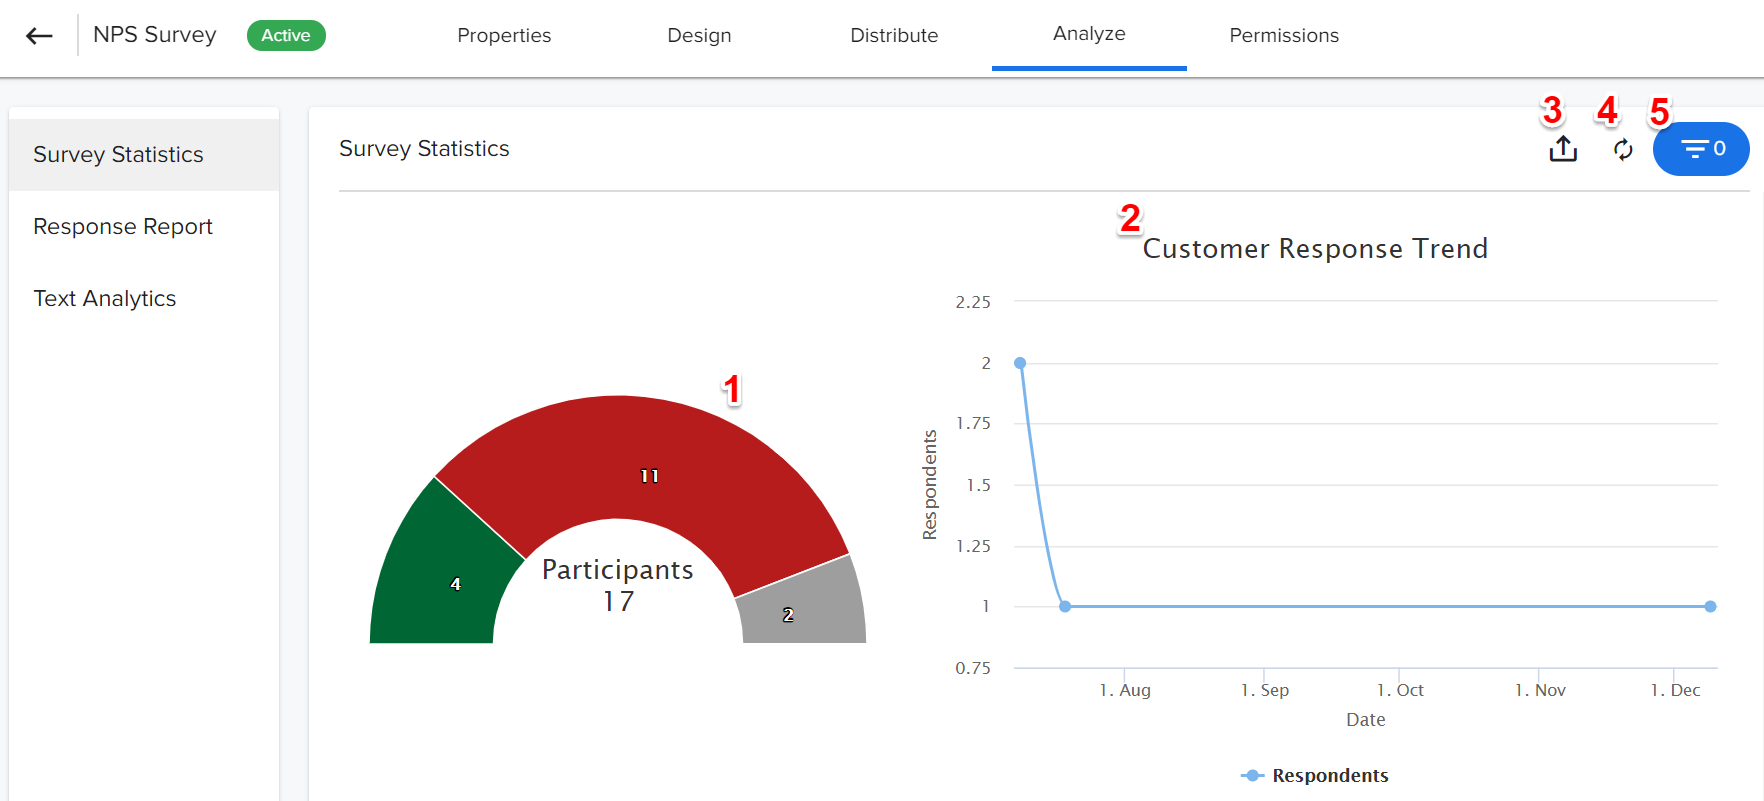
- Participants Chart: This is divided into the sections, Responded, Not Responded, Undelivered, and Partially Saved. Click a section to view the specific list of participants at the bottom of the page. You can add filters to each column of the chart. You can Preview, Edit or Delete the participant responses of submitted surveys.
- To use the Preview option:
- Select the response you want to Preview, from the participant chart.
- Click the Context menu icon.
- Click the Preview icon. A new window opens and displays the participant responses.
- To use the Edit option:
- Select the response you want to Edit, from the participant chart.
- Click the Context menu.
- Click the Edit icon. A new window opens and displays the survey question(s).
- Edit the responses.
- Click SUBMIT to view the “This will change the response. Do you want to continue?” message.
- Click Yes to save the changes.
- To use the Delete option:
- Select the response you want to Delete, from the participant chart.
- Click the Context menu.
- Click the Delete icon to view the “The selected records will be deleted from the system and will not be available for the analytics or any other use.” message.
- Click DELETE.
Note: You can select and delete a maximum of 10 responses at a time.
You can Add/Delete the fields from Company / Relationship / Company Person / Relationship Person objects as per your business need and the selected fields are user preserved.
- To Add fields:
- Click Choose Fields. Field List window appears. You can view all the fields that are added to the Participant chart.
- Click Add Fields. Select Fields window appears.
- Select the required fields.
- Click Save.
- To Delete fields:
- Click Choose Fields. Field List window appears. You can view all the fields that are added to the Participant chart.
- Click the Delete/Trash icon of the field you want to delete.
Note: You can also rearrange the fields as per your requirement. - Click Save.
If you have too many responses, you can use the pagination tool to navigate through different pages and view multiple responses, in a set of 50, 100 or 150 on a single page, based on your selection.
- Customer Response Trend: This line graph displays the number of responses received for the survey over time. You can see Date and Respondents count in the X and Y-axis respectively.
- Export: This option can be used to export the data within the Survey Statistics section as an attachment and send it as an email to the currently logged-in user.
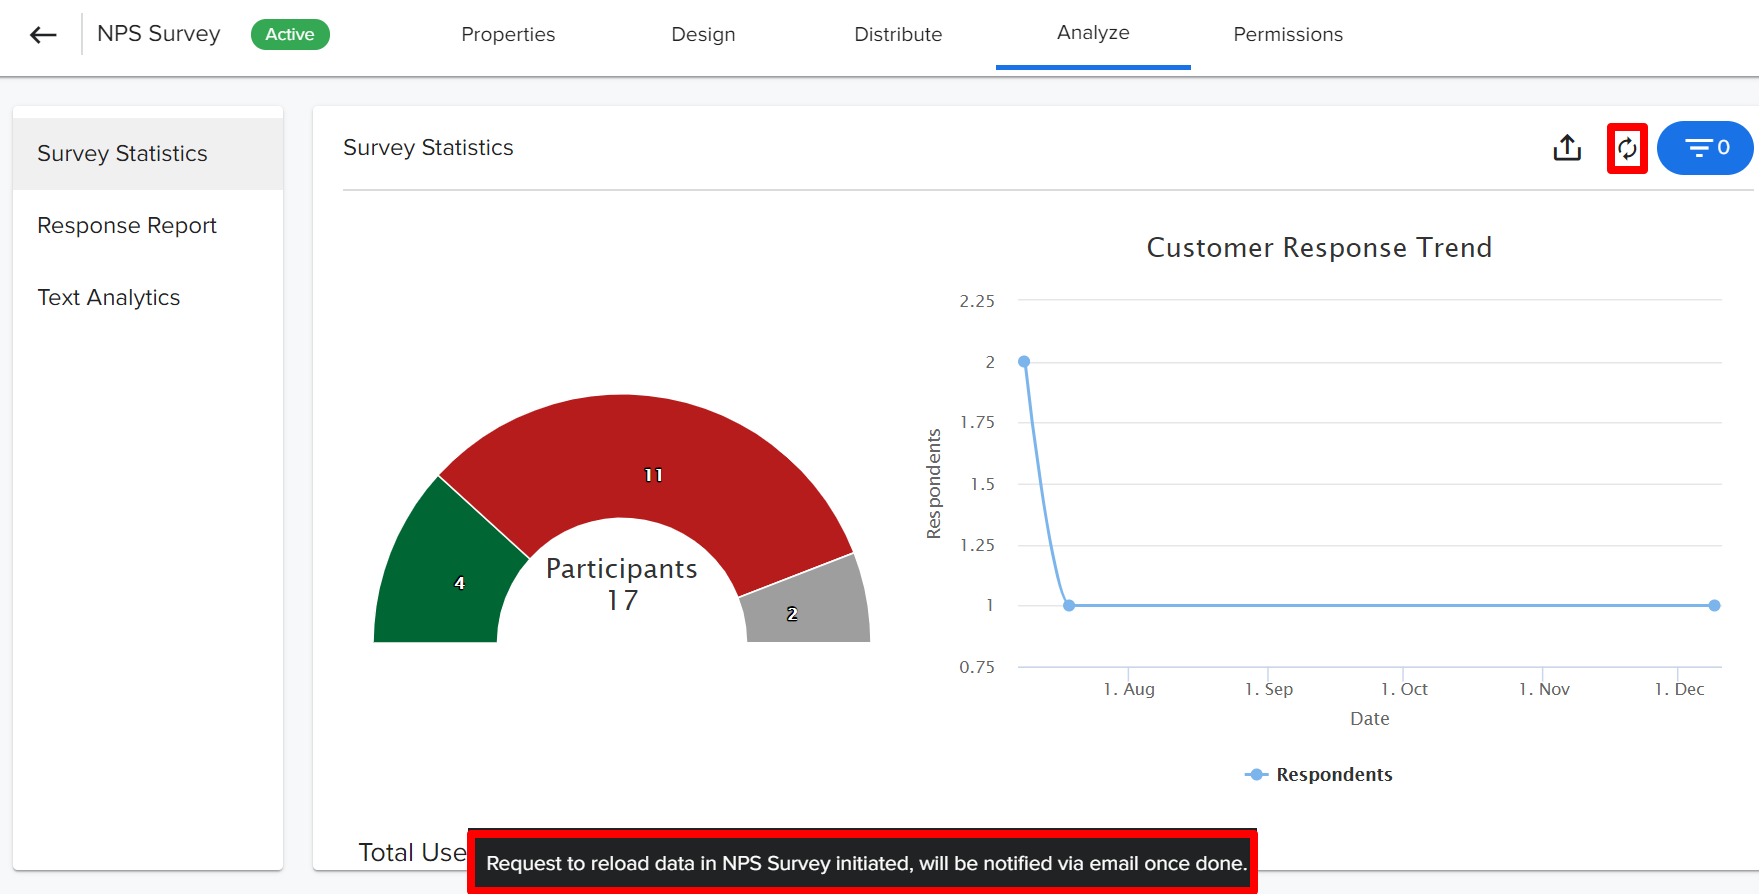
- Reset Flattening: Click Reset Flattening, to reload the data for that specific survey. You can see a message displaying ‘Request to reload data in NPS® Survey initiated, will be notified via email once done’ at the bottom of the page. For more information on Survey Flattening, refer to the Surveys Flattening Overview article.
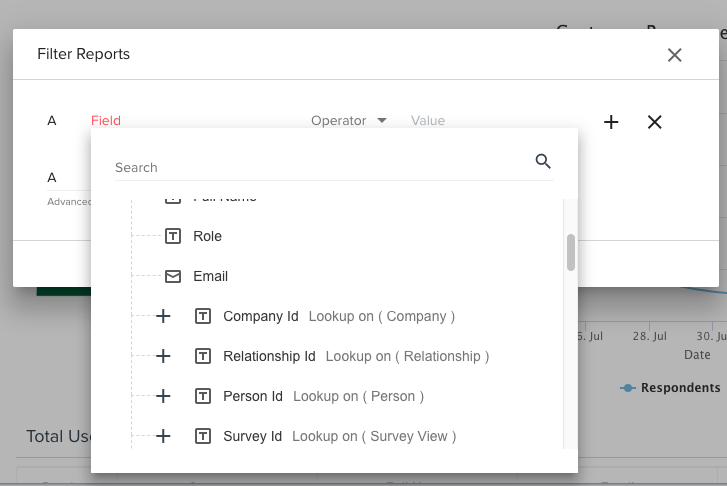
- Filter Reports: The filter option at the top-right can be used to control which Surveys data segments are displayed in all the different views on this page. You can filter the survey responses on fields from the Survey Participant object and its lookup fields. You can apply multiple filters and Advance logic between them (AND or OR) to filter the survey responses as required. The applied filters are sticky and user preserved.
Internal Submissions
For surveys that have been configured for internal submission, you can manually submit responses under Survey Statistics. For more information on Submission of Internal Responses, refer to the Submit Surveys Internally article.
Response Report
The Response Report displays the graphical representations of response information for each survey question. The following is what is displayed in a Response Report of each question:
![CSAT Analyze [2] [2].png](https://support.gainsight.com/@api/deki/files/17653/CSAT_Analyze_%255B2%255D_%255B2%255D.png?revision=1)
- Question Name: This is displayed at the top of each question.
- View Details: Click to display a table of participants who responded to the question. The table honor the same fields that are selected by the user in Survey Statistics.
- Overall/Breakdown: In the Overall section, overall responses to the NPS® question type are displayed with the percentage of Promoters, Passives, and Detractors in a stacked bar chart. And, the overall responses to the CSAT question type are displayed with the percentage of Positive, Neutral, and Negative in a stacked bar chart.
In the Breakdown section, a breakdown of the survey responses are displayed with the percentage of responses for each numerical ranking in a stacked column chart. - Report Graphic: The Report Graphic is a visual representation of the response data. The information is presented depending on the question type. You can click each section (stacked bar or column) for a drill-down view of participants. This drill-down is identical to the table displayed in View details.
- Display Method: You can select the graph (left) or table (right icon) respectively.
- Filter Reports: Click this to add filter conditions to the participant response data being displayed. These conditions can be built off of the fields in the Survey Participant object. For more information on filter reports, refer to the How to Build Basic Reports article.
- Combined: This dropdown is available when you select Matrix Question as a subquestion in the CSAT question. From the dropdown, select the required subquestion to view the graphical representation of the response data.
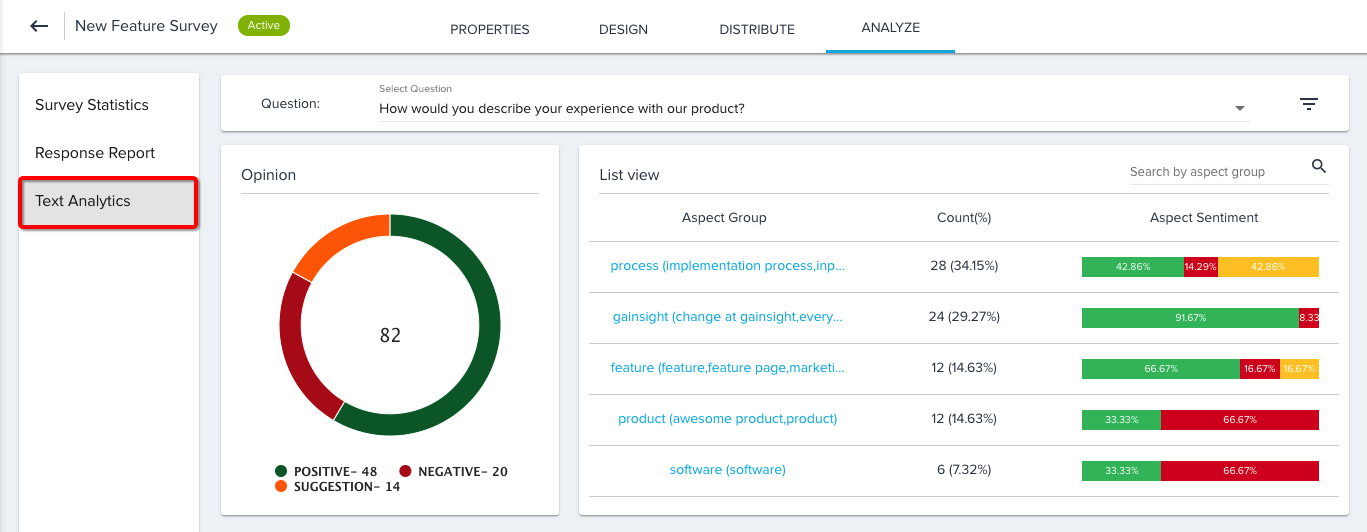
Text Analytics
The Text Analytics feature uses several analytical techniques to break down and classify the textual information contained in all of the text-based questions and for all questions that are enabled with a comments text box. It then analyzes the information for reporting purposes. This option is enabled by default for all surveys.
For more information on the functionality of Text Analytics, refer to the How Text Analytics Works article.
Note: Although Gainsight supports multilingual surveys, the Survey Text Analytics for an individual gainsight survey is supported only for the english text feeds. In other words, non-english free text responses won’t be considered for Survey Text Analytics.
Note that Text Analytics for multilingual surveys is supported in Text Analytics Overview.
Custom Reports
The Survey Participant object captures response data for Surveys. You can build custom Surveys reports in Report Builder using this object. For more information on building reports, refer to the How to Build Basic Reports article.
Edited/deleted response information is stored in the Survey Audit Log object. You can build reports using this object to see who has edited/deleted the responses for a specific survey, modified date of the responses, etc.
| Net Promoter®, NPS®, NPS Prism®, and the NPS-related emoticons are registered trademarks of Bain & Company, Inc., NICE Systems, Inc., and Fred Reichheld. Net Promoter ScoreSM and Net Promoter SystemSM are service marks of Bain & Company, Inc., NICE Systems, Inc., and Fred Reichheld. |