Audience Explorer
This article explains configuring the Audience Explorer sections in Gainsight PX.
Overview
The Audience Explorer section in Gainsight PX display the details of the users working at your customer’s organization and using your application. The data in these sections can be imported through any of the Integrations, present on the Integrations screen. The fields displayed in these sections are known as Attributes. To learn more about Attributes, refer to the User and Account Model article from the Additional Resources section.
Audience Explorer
Audience Explorer displays a list of all the users using your application. Each user is associated with an Account. You can perform all of the same actions in the Accounts Explorer with Audience Explorer as well. Apart from those actions, Audience Explorer provides you with a Full Profile option that displays a user’s various activities and associations.
Analyze User Profile
User Full Profile provides useful information about users. You can analyze the user behavior based on the details provided in this section.
To access the full profile:
- Click on the required user.
- The Audience Explorer page is displayed with details of selected user.

The information displayed by the Full Profile feature can be classified into three sections.
Tabs
This section displays six tabs. Each tab displays important information related to the user. Only the data that has been synced to Gainsight PX is displayed in the tabs. The six tabs are:
Details: This tab displays information like User’s job title, last visited date and time, Recent FullStory Session recordings, last 10 segments whose criteria(s) were matched by the user, last inferred location, and so on. For more information, refer to the Segment article from the Additional Resources section.
Attributes: This tab displays the custom, User-Preference, and default user attribute values, for the selected user.
Social: This tab displays the user’s photo, contact info, demographics, and so on. This data is provided by a third-party application; Fullcontact.
Account: This tab displays values for Inferred company, default, and custom Account attributes of the Account which the selected user is associated with.
Feedback: This tab displays the feedback given by the user. Feedback can be a response given to any of the Survey engagements or feedback is given through the KC Bot’s feedback tab.
Segments: This tab displays the product usage, subscription levels, or any custom-defined criteria.

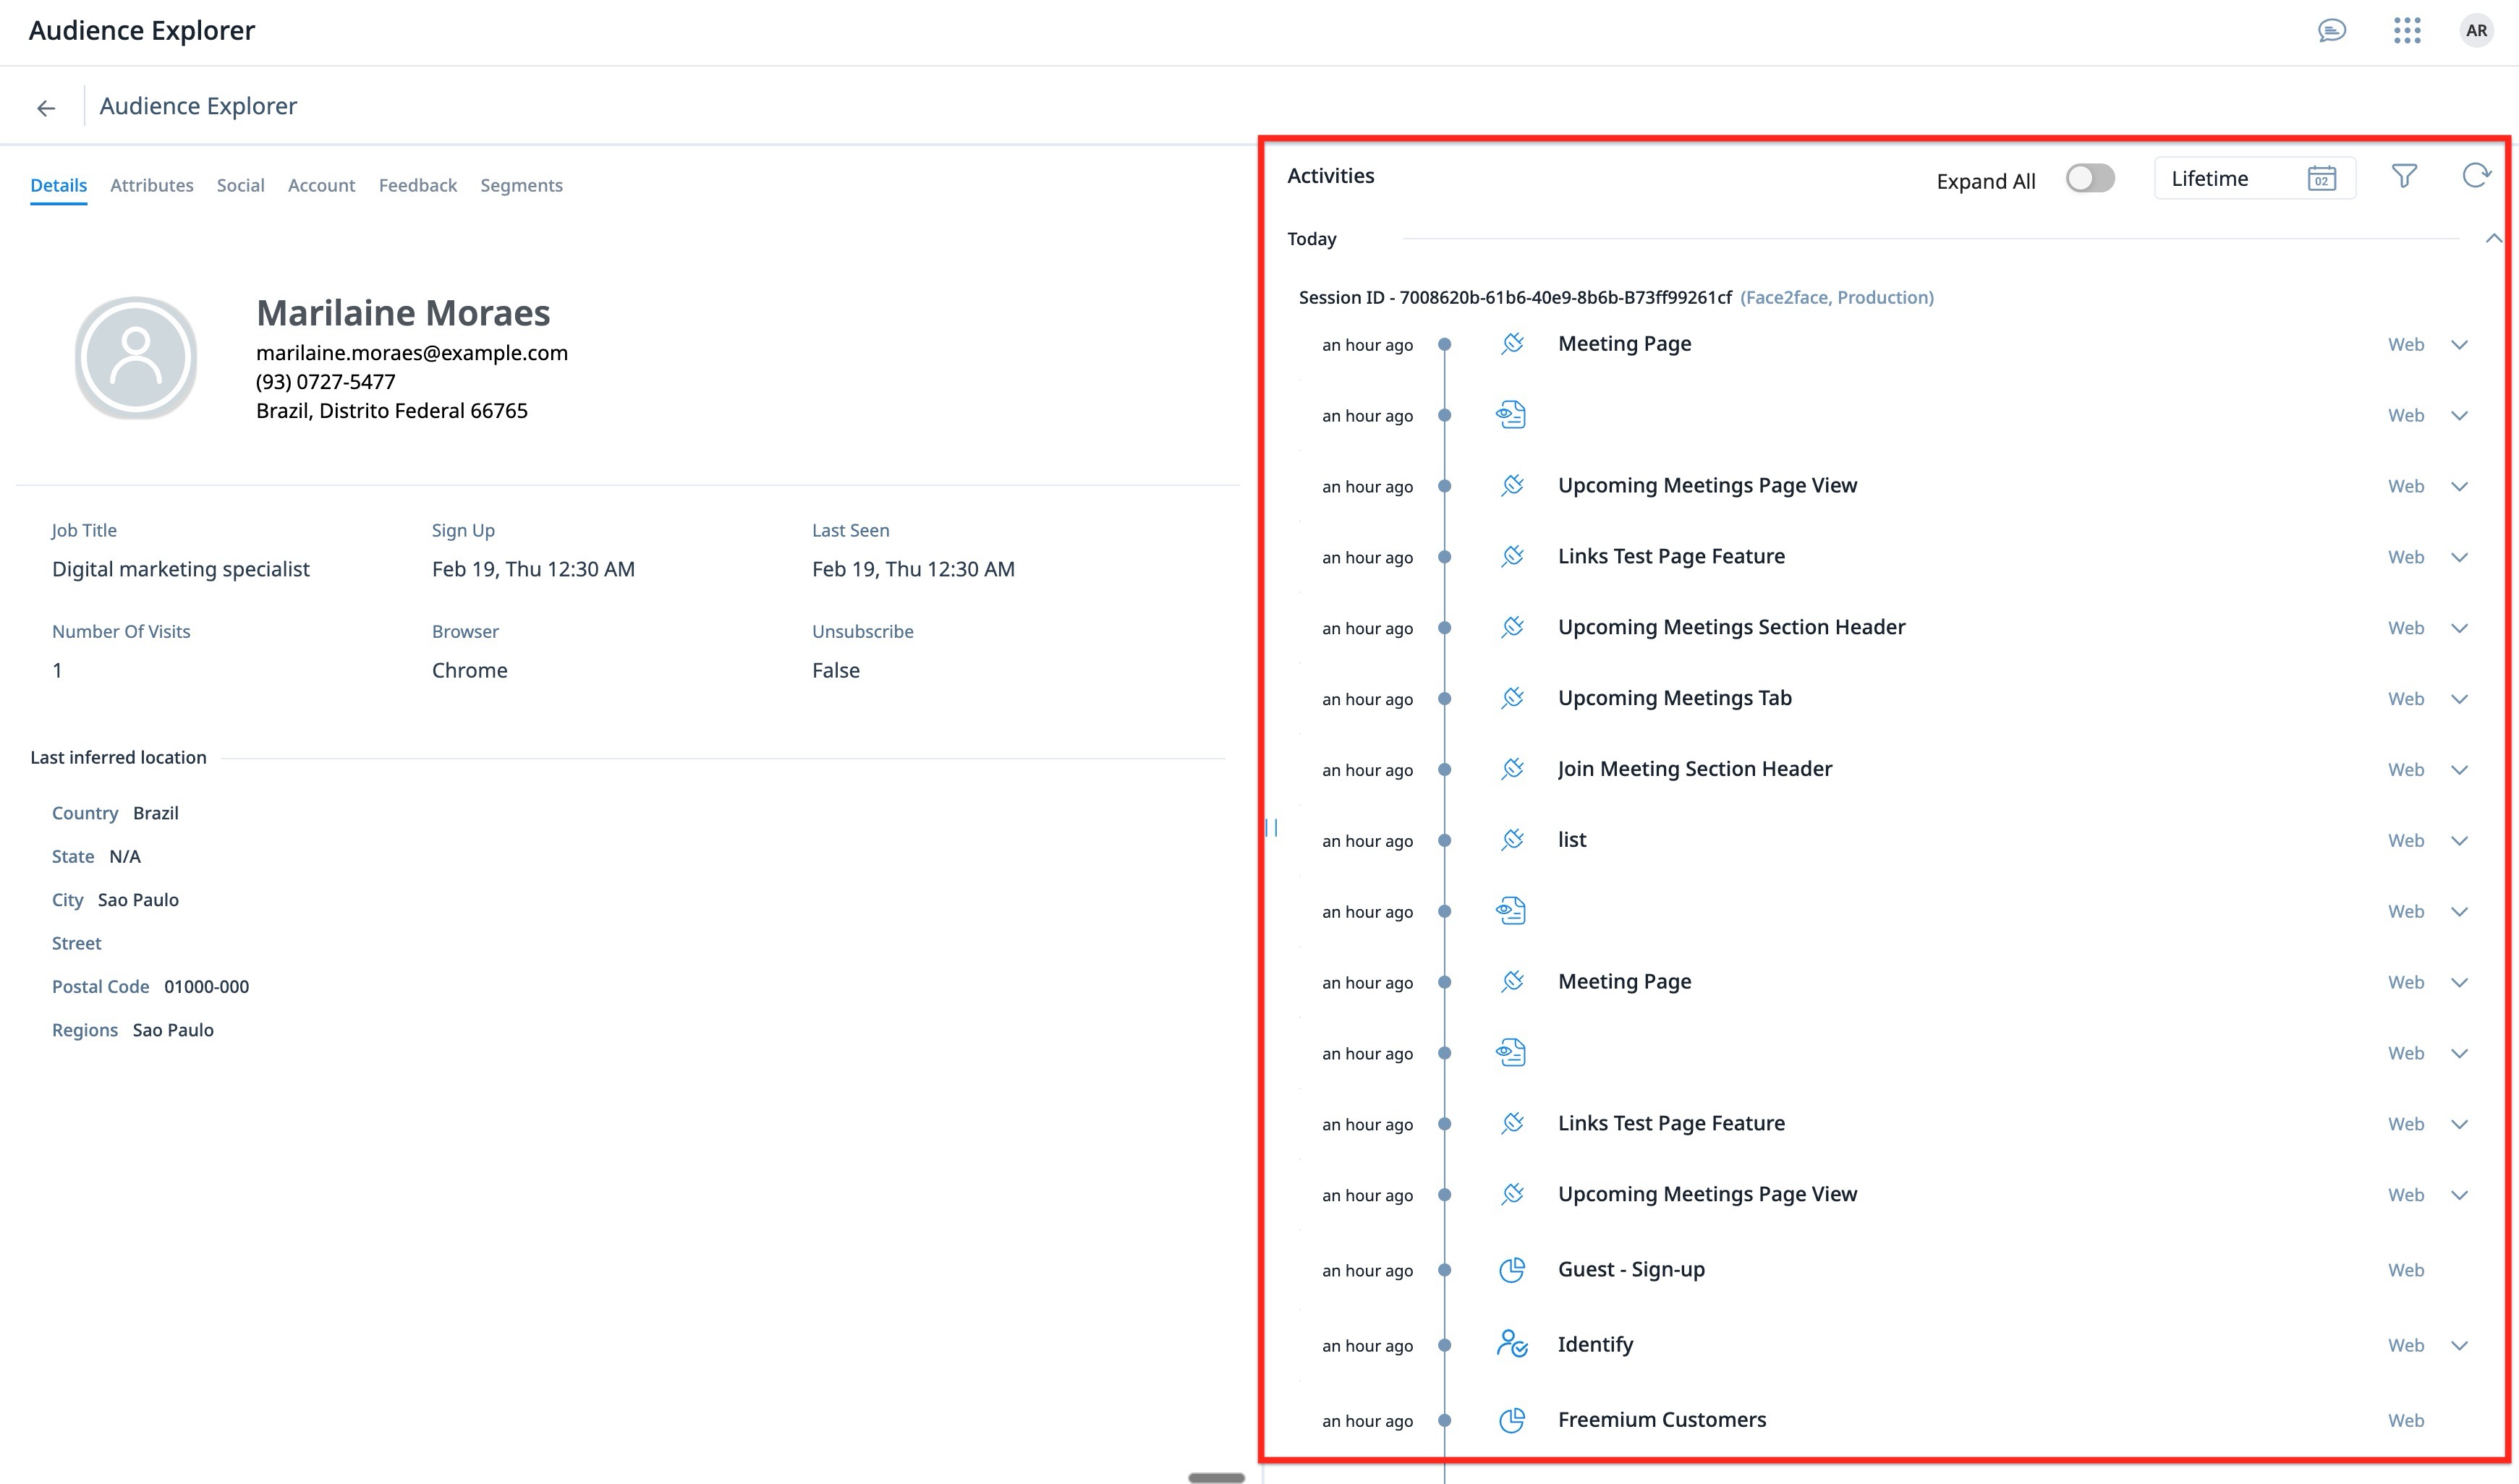
Activities
The Activities section in Audience Explorer helps you analyze user behavior based on tracked events in Gainsight PX. It displays the user’s session-collated timeline view of recent activities, segments, and engagements in reverse chronological order. You can filter by specific interactions, system events, engagement activity, and mobile app behavior as well as by product(s) and environment(s) to understand how the user interacts with your product at a granular level near real time.
You can use Activities to:
- Identify what actions users performed within a selected date range
- Verify product mapping
- Analyze product usage patterns
- Validate segment qualification and targeting logic
- Measure engagement performance across in-app and email channels
- Investigate experience issues such as crashes, errors, or rage clicks
You can perform the following actions:
- Expand All: Expand all activity categories to display every available event type with more detailed information.

- Date Range: Select the time period for which user activities are displayed and analyzed.
Note: The Lifetime date option displays activities from the last 90 days. To analyze older data, use the Custom Date Range option and select up to six months at a time. - Filters: Refine results by narrowing user activity based on specific events, products, environments, or engagement types.
Activities Filters
You can use the Filters option in Activities to further refine results by selecting specific products and environments, and by applying filters within each activity type. This allows you to narrow your analysis to highly targeted user behaviors.

The following activities are available to filter, across different channels:
- Identify: Tracks when a user is identified with a unique user ID.
- Session Initialized: Captures the start of a user session.
- Page View: Tracks when a user views a page in the web application.
- Click: Captures user clicks on tracked elements within the web application.
- Feature Match: Filters users based on predefined feature rules configured in Product Mapper.
- Custom Event: Tracks user-defined events sent through the PX SDK or API.
- In-App Engagements: Filters users based on interactions with in-app engagements such as guides, dialogs, sliders, and tooltips. You can refine by engagement type and specific engagement name.
- Segment Match: Identifies users who qualified for a specific PX segment.
- Email Engagements: Filters users based on email engagement activity, such as email sent, delivered, opened, or clicked.
- Lead: Tracks when a user is marked or synced as a lead.
- Form Submit: Captures when a user submits a tracked form.
- Engagement Errors: Tracks errors that occurred during engagement delivery.
- Engagement Priority: Filters users based on engagement priority rules.
- App Installed: Tracks when the mobile app is installed.
- App Opened: Captures when a user opens the mobile app.
- App Updated: Tracks when the mobile app is updated to a new version.
- Screen: Captures screen views in mobile applications.
- App Crashed: Tracks when the mobile app crashes.
- Tap: Captures user tap interactions on mobile UI elements.
- Rage Click: Tracks rapid, repeated clicks (three or more per second) on the same element. Indicates potential usability issues, confusion, or unresponsive UI elements.
User Preferences
Gainsight PX sends user engagements, tracks and analyzes user activities, and stores user data. However, if your customers would like to opt-out from receiving engagements or activity/data tracking, you can honor the user preferences.
Admins can opt-in or out of the following User Preferences attributes from the user’s profile in Audience Explorer:
- Guided Tours
- Onboarding Bot
- Product Updates
- Surveys
- Track Email Analytics
- Track Usage

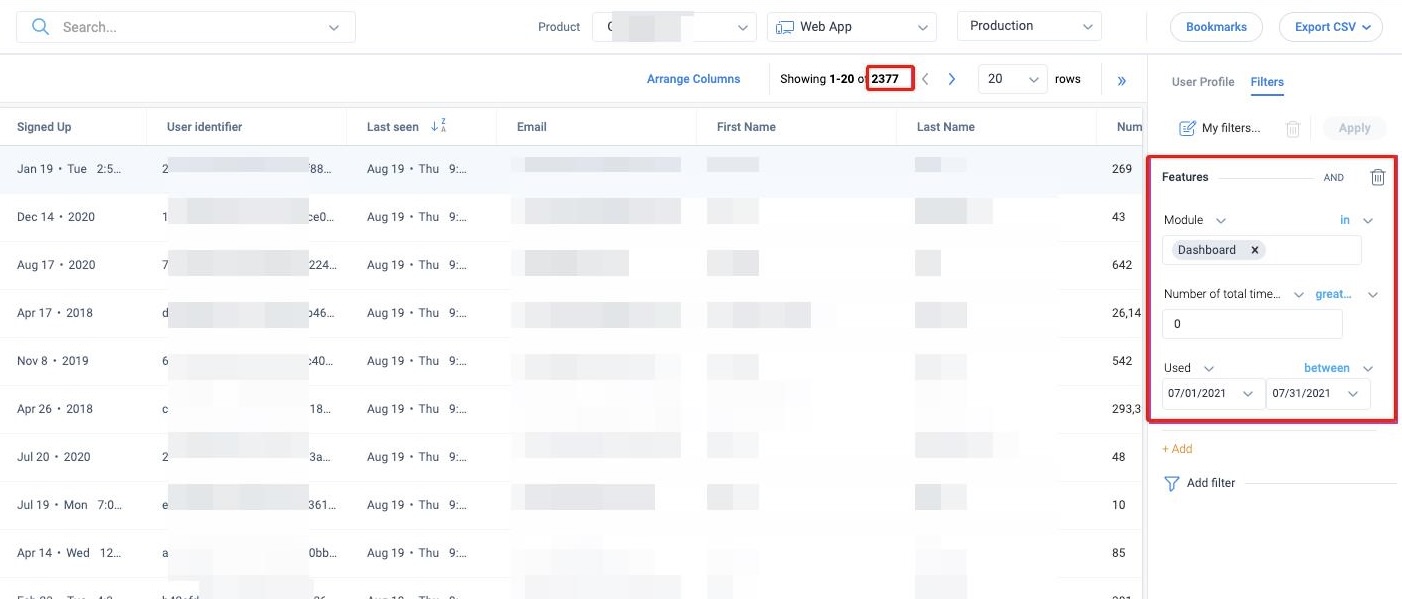
Filters
Note: You can find out the number of unique users that logged in each month by using the following filter option: