Accounts Explorer
This article explains Accounts Explorer and various metrics tracked on account level.
Overview
Accounts Explorer is a dedicated workspace in Gainsight PX that provides a consolidated, account-level view of product usage, health, and activity. It helps product, customer success, and growth teams identify trends, risks, and opportunities by surfacing both high-level metrics and detailed insights into how accounts are adopting your product. You can track usage over time, highlight at-risk accounts using configurable health scoring logic, and drill down into individual accounts for user- and feature-level analysis.
Key Capabilities
- Account-level Summary & Health: View high-level account metrics such as total accounts, active users, at-risk accounts, and health scores based on usage behavior and engagement patterns.
- Accounts Table: Analyze each account with a row-level breakdown of key metrics, including Product Score, Core Feature Usage, and Stickiness, with support for sorting, filtering, and drill-down.
- Search and Quick Filters: Use keyword (account name or Id) search and quick filters (Healthy, Neutral, At Risk) to segment accounts based on configured health thresholds and identify accounts that need attention.
- Account Drill-Down: Click an account to explore a similar summary and health view of the specific account.
- Top or Bottom Users, Features, and Modules: Identify the most and least active users based on core features used or visits to the product, as well as high- and low-usage features and modules, to better understand how product adoption varies within each account.
IMPORTANT
- Unless explicitly specified, all metrics in Accounts Explorer displayed for the last 30 days exclude the current day.
- The account list includes any changes to accounts (added/removed) on the current day.
Accounts Explorer
Use Accounts Explorer for a consolidated view of how your customers are using your product. It helps you track adoption, assess account health, and identify risks or opportunities across your portfolio. You can also drill down into specific accounts to explore feature usage patterns and user behavior in greater detail.
To access, navigate to Accounts Explorer from the main menu. The following widgets and table are available:
- SUMMARY: Displays key metrics across all accounts for the selected product, such as total accounts, active accounts, new accounts, and more, over the last 30 days.
- HEALTH: Displays the health distribution of your accounts based on engagement metrics such as core feature usage, stickiness, and product activity, over the last 30 days.
- ACCOUNTS LIST: A sortable, filterable, and searchable (by Account Name and Account ID) table that lists customer accounts along with important health indicators and usage metrics. You can drill down into any row for a detailed view of a specific account’s behavior and product adoption.
IMPORTANT
- If you are viewing Accounts Explorer for the first time, some metrics may appear blank. A banner at the top of the page prompts you to configure health scores before these insights can be calculated.
- Only users with Administrator permissions can set up Account Explorer. For more information, refer to the Configure Account Settings section.

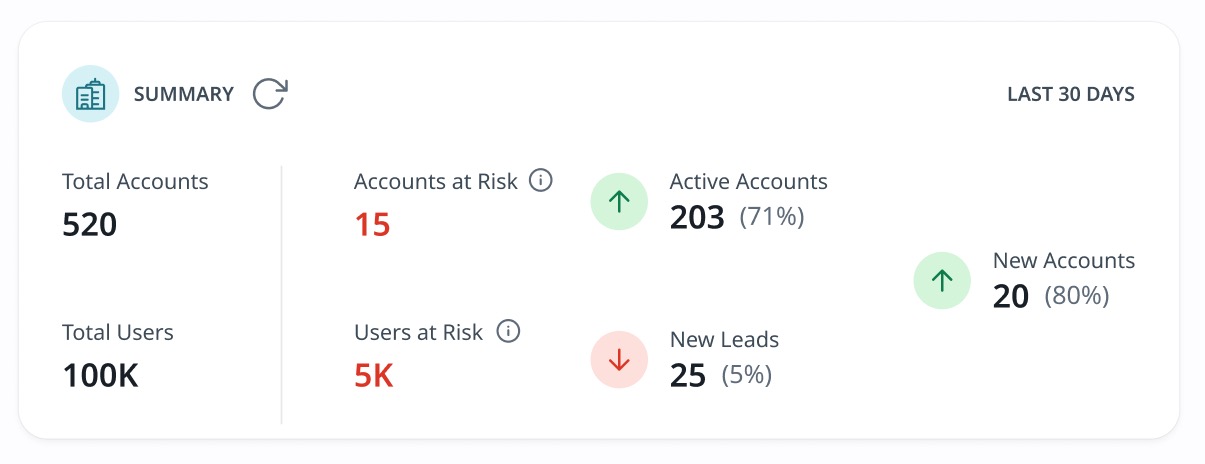
Summary Widget
The SUMMARY widget surfaces a quick standing of account in a compact format, making it easy to get a holistic view at a glance. It highlights changes in total accounts, active accounts, and new additions over the last 30 days, along with a count of accounts that may require attention. Each metric includes a comparison against the previous 30-day period, helping you quickly assess whether overall engagement is improving, declining, or remaining stable.
The widget displays the following lifetime metrics:
- Total Accounts: Total number of accounts for the selected product. This count includes all customers regardless of usage status.
- Total Users: Total number of users across all accounts. This includes both active and inactive users.
The widget displays the following metrics for all accounts over the last 30 days:
- Accounts at Risk: Number of active accounts whose Product Score is below the lower threshold (defined in Account Settings) over the last 30 days . These accounts are flagged as Red Accounts.
- Users at Risk: Number of Users with Core Feature Usage below the Admin defined lower threshold (set in Account Settings) in the last 30 days. This helps quantify the user base affected by low engagement. You can click the metric to view the list of users whose Core Feature Usage KPI falls below the lower threshold defined.
- Active Accounts: Number of accounts that have active usage in the last 30 days. Also displays the percentage change compared to the previous 30-day period. An account is considered active if at least one user is active within the defined period.
- New Leads: Number of prospective accounts that were identified in the last 30 days and how that number compares to the previous 30-day window.
- New Accounts: Number of newly added accounts in the last 30 days and the percentage change compared to the previous 30-day period.
Note: In some cases, you may observe slight differences in user counts in different parts of Gainsight PX due to how users without associated account IDs are handled:
- Active Users: The count in the Dashboard widgets may be higher than in Accounts Explorer, as users without account IDs are included in Dashboards but not considered in Accounts Explorer as it checks for an associated account Id.
- Total Users: The count in Audience Explorer may be higher than in Accounts Explorer as users without account IDs are included in Audience Explorer but not considered in Accounts Explorer as it checks for an associated account Id.
Health Widget
The HEALTH widget provides a visual summary of how accounts are performing based on product and user engagement metrics. It highlights account distribution across various categories such as Healthy, Neutral, At Risk (for Product Score) and Low, Moderate, High (for usage, coverage, and stickiness). These are calculated using configurable thresholds for core feature usage, stickiness, and other key indicators. This view helps you quickly assess overall account health trends and identify accounts that may need attention.

The widget provides the following metrics over the last 30 days:
|
Name and Description |
Formula and Configuration |
|---|---|
|
Core Feature Usage: Measures how many of the core features (identified as key for the success of the product) are being utilized. This is a key indicator of whether accounts are realizing the core value of the product. |
Formula: Core Feature Usage = (Average number of core features per user / Total number of core features) × 100 Configuration:
|
|
Active Usage Coverage: Represents the percentage of total users in the last six months who were active during the last 30 days. This metric highlights how engaged the overall user base is across accounts. |
Formula: Active Usage Coverage = (MAU / Total Users in Last 6 Months) × 100 Configuration:
|
|
Stickiness: Measures how often users return to your product, helping you assess whether it is becoming a part of their regular workflow. It reflects habitual usage behavior and complements activity metrics like core feature usage. Higher stickiness values indicate that users are engaging with the product more frequently within a given month. |
Formula:
Configuration:
|
|
Product Score: Calculates an overall product health score using configurable weighted inputs, including Core Feature Usage, Stickiness, Session Duration, NPS, and Custom Account Attributes. |
Formula: Product Score = Weighted Average of Selected Metrics ( Core Feature Usage, Stickiness, Session Duration, NPS, Custom Account Attributes) Note: Metrics that are not percentage-based are normalized to a 0–100 scale before weight calculation. Configuration:
|
Note: You can hover each metric to view the description and the formula used for calculation.
Accounts Table
The Accounts table displays all accounts, along with key metrics such as product score, active users, usage coverage, and health indicators. Each row represents a customer account and includes sortable columns, trend indicators, and filter options to help you quickly identify accounts that are healthy, at risk, or require follow-up.

You can perform the following actions on the accounts list:
- Quick Filters: Use the quick filters above the table (All Accounts, Healthy, Neutral and At Risk) to instantly segment accounts by health status. These filters apply predefined criteria based on the Product Score thresholds set in Account Settings. Select Awaiting Scoring Only to view accounts created within the last 24 hours that have not yet received a product score. Once product scores are calculated, these accounts are removed from the Awaiting Scoring view.
Note: The Awaiting Scoring Only filter works independently and cannot be used with other filters. - Account Drill Down: Click an account name to view detailed insights into the account. For more information, refer to the Account Drill Down section.
- Sort: Click a column header to sort the list in ascending or descending order. This helps you prioritize accounts based on metrics such as Product Score, Active Users, and so on.
- Search: Use the search bar to find accounts by account name and account id. The results are filtered within the current quick filter selection (such as Healthy or Neutral accounts), thus only matching accounts from the selected segment are displayed. To search across all accounts, select All Accounts before entering your query.
- Filters: Apply additional filters using the Filter icon. These filters allow you to refine the account list based on the standard list of PX custom filters based on users, accounts, features , segments and many others. You can also use account health metrics, including Core Feature Usage, Active User Coverage, Stickiness, and Product Score as filters
Note: By default, the Account Product Last Seen less than 30 days filter is applied. - Account Information: Scroll across each account to view Number of users, Number of visits, Number of employees, geographic details, and various other inferred metrics..
- Export: Export the accounts data as a CSV file.
- Export Current View: Export only the data for accounts that are currently displayed in the accounts list view after honoring the filters and column rearrangement is exported.
- Export All Columns: Export all the columns irrespective of the current view of columns.
- Bookmarks: Save a customized list as a bookmark. This saves your efforts to re-apply these filters again in the future. When you create a bookmark, it saves all of the accounts that are currently being displayed in the list view (after applying filters and column arrangement).
- Arrange Columns: Customize the order of the columns displayed for the accounts list view.
The table provides information on the five KPIs mentioned below for each account for the last 30 days, along with an indication of how the metric performed, as compared to the previous 30-day period. A green upward triangle indicates the KPI has increased in value in the last 30 days compared to the prior 30 days, whereas a downward red triangle indicates a decrease in value
- Product Score: A composite metric representing the overall health of the account based on usage and engagement. Calculated as (Core Feature Usage + Stickiness) ÷ 2.
- Active Users: Indicates the number of users within the account who were active during the last 30 days. An active user is one who has engaged with the product at least once in the time window.
- Active User Coverage: Displays the percentage of users in the account who were active in the last 30 days, compared to all users of the account in the last six months. Calculated as (MAU / Total Users in last 6 months) × 100.
- Core Feature Usage: Measures how many of the selected core features are being used by the account, thus reflecting the adoption of features critical to the success of the product or realising value of the product. Calculated as (Average number of core features per user / Total number of core features) × 100.
- Stickiness: Indicates the Stickiness value for this account. Higher stickiness implies more habitual engagement. Calculated as (DAU or WAU / MAU) × 100.
Following are some of the additional information provided for each account:
- Account Name: Displays the name of the customer account.
- Product Last Seen: Most recent activity timestamp of a user within a specific product of the account. This reflects the latest activity for that specific product.
- Product First Seen: Date and time when the first user interacted with a specific product in the account. This indicates the beginning of the account’s product journey.
- Last Seen: Latest activity timestamp across any product in the subscription (not product-specific).
- Other Information: Additional information for each account:
- Click here for more information on other columns in the Accounts Table
-
Column Name
Description
Website
Account's official website URL.
Number of users
Total unique users from the account seen in the selected product
Number of visits
Total visits from all users in the account for the selected product
Industry
Industry specified in your CRM or account metadata.
Number of employees
Total employees from CRM or integrated sources.
Inferred industry
Industry inferred from the enrichment provider.
Inferred Number of employees
Estimated employee count from enrichment provider.
Inferred revenue
Estimated annual revenue of the company from enrichment provider.
Inferred sicCode
Inferred Standard Industrial Classification code from enrichment provider.
Inferred naicsCode
Inferred North American Industry Classification System code from enrichment provider.
Create date
Date the account was created in PX
Plan
Subscription or Package Plan Name mapped via CRM
Time Zone
GMT/UTC +- X hrs
Country name
Full Country Name of the Account
Country code
ISO 2-letter code (e.g., US, IN).
State name
Full name of the state/province.
State code
2 letter Abbreviation of the state/province (e.g., CA for California).
City
City where the account is based
Street
Street Adress of the Account
Postal Code
ZIP or postal code associated with the account
Continent
Full Continent name where the account is located
Region
Broader geographical grouping (e.g., EMEA, APAC, NA).
Account Drill Down
The Account drill-down view provides a detailed snapshot of how a specific account is engaging with your product. It includes account-level metrics along with user-level insights, helping you understand how the account is adopting core features, where usage gaps exist, and which users are most or least engaged.
Drill-Down Summary Widget
The SUMMARY widget on the drilled-down view displays key usage statistics specific to the selected account. It includes metrics such as total visits, average session duration, and more, offering a high-level view of how the account is engaging with the product.

The widget provides the following metrics:
- Customer Since: The time duration since the first user of the account interacted with a product. This marks the beginning of the account’s usage journey.
- Total Visits: The total number of sessions initiated by users from the account. Each visit represents a user session in the product.
- Last Seen Date: The most recent date on which any user from the account interacted with the product. This is useful for identifying how active the selected account is.
- Total Users: The total number of users associated with the account, including both active and inactive users.
- Average Session Duration: The average length of time users from the account spent in the product per session over the last 30 days, excluding today.
- Users at Risk: The count of users within the account that have low usage of Core Features(less than the lower threshold of Core Feature Usage) over the last 30 days, and hence fall into the at risk category. You can click the metric to view the list of users whose Core Feature Usage KPI falls below the lower threshold defined. These Users at Risk (for instance, 15 in the above screenshot) can be seen in the Users widget right below the Summary widget. Toggle from the default Top users selection to the Bottom users and the first 15 users in the list are the 15 Users at Risk.
Drill-Down Health Widget
The HEALTH widget on the drilled-down view displays the account’s health scores across four KPIs - Core Feature Usage, Stickiness, Active User Coverage, and Product Score. The values are color-coded (red, yellow, green) based on the thresholds defined in the Account Settings and help assess whether the account is on track, needs attention, or is at risk.
Note
- The health widget displays similar information to the health widget on the Accounts Explorer page, but powered by the data of only the selected account. For more information on the calculation of each metric, refer to the Account Summary Widget section.
- You can hover each metric to view the description and the formula used for calculation.

Users Widget
The Users widget in the account drill-down view highlights individual usage patterns within a selected account. It helps you quickly identify which users are most engaged with your product and which ones may require attention. It helps identify potential advocates or champions in an account, as well as users who may need re-engagement.
You can perform the following actions on the widget, for the last 30 days:
- Top Users: View the most engaged users in the account, ranked by either number of times core features used or number of product visits. These users typically show high adoption and frequent activity and can be strong candidates for feedback, advocacy, or early access to new features.
- Bottom Users: View users with the lowest engagement levels based on the selected ranking method. These users may be in need of additional support or targeted in-app guidance to improve adoption.
- Ranked by: Use the dropdown menu to sort the list of users by Number of Core Features Used or Number of Product Visits.
Note: The # (number) Visits column refers to the total visits by each user and is not limited to the last 30 days. - Filter: Apply PX filters on the list of users. For example, if a filter is applied to show users from a specific location, only matching users appear in the Top or Bottom lists.
- User Avatars: Click the avatars to view the user profile activity in a new tab.
Note
- If a user belongs to multiple accounts over time, they are displayed only under their most recent account. However, their activity continues to contribute to the KPIs of previous accounts, depending on the time period selected.
- For instance, User X is initially part of Account A. All activity during this period is attributed to Account A in KPIs. After 20 days, User X moves to Account B.
- From that point on, all activity is attributed to Account B, and User X is no longer shown under Account A, in the Users widget or Accounts table.
- Activity from the first 20 days will still be included in Account A’s KPIs if the time window includes that period.
- After 30 days, if the KPI time window excludes those 20 days, User X’s activity will only reflect in Account B.
- If a username is not available, the user's email is displayed. If neither is available, a double dash (--) is displayed instead.

Features or Modules Widget
The Features or Modules widget in the account drill-down view helps you understand which parts of your product are being used most and least, by a specific account. It ranks feature and module usage over the last 30 days, allowing you to pinpoint what is driving adoption and what may require further enablement. This view is useful for evaluating onboarding effectiveness, identifying underutilized areas, and prioritizing in-app engagements.
You can perform the following actions on the widget, for the last 30 days:
- Top Features or Modules: View the most-used features or modules by users in the account. This view highlights which areas of the product are delivering the most value. By default, Top Features is selected. Use the toggle switch to select Bottom Features.
- Bottom Features or Modules: View features or modules with the lowest usage. These may represent under-discovered areas, onboarding gaps, or features that are no longer relevant.
- Ranked by: Use the dropdown menu to switch the list from features to modules or the reverse..
- Filter: Apply PX filters on the list of features or modules. For example, applying a filter to segment a specific cohort displays feature or module usage accordingly.
Note: To view Top Modules or Bottom Modules, click the Show Features drop-down menu and select Show Modules.

Zero Usage Features or Modules Widget
The Zero Usage Features or Modules widget in the Account Drill-Down view highlights areas of your product that have not been used by the specific account in the last 30 days. It surfaces both features and modules that have recorded no engagement. This view is valuable for spotting onboarding gaps, uncovering unused capabilities, and making informed decisions about feature retirement or targeted engagements.
You can perform the following actions on the widget, for the last 30 days:
- Zero Usage Features or Modules: View features or modules that have had no interaction from the account’s users, along with when the product was last modified, the user that made the update, the path, and other information.
- Search: Find a specific feature or module by name. The search applies within the currently selected view (Zero Usage Features or Zero Usage Modules).

Configure Account Settings
The Account Settings section is the control center for Accounts Explorer. Here, you must configure the foundational rules that power account-level health KPIs. This includes selecting core features, defining color thresholds for health scoring, and setting preferences for how stickiness is calculated. These configurations directly influence the insights shown in Account Explorer, account drill-down, and the associated widgets.
IMPORTANT
- Only users with Administrator permissions can view or modify Account Settings.
- Changes made to Core Features in Accounts may take up to 24 hours to reflect in Accounts Explorer
- Changes to Account Settings directly affect health KPIs. We recommend exercising caution while making adjustments.
To configure:
- Navigate to Administration > SET UP > Account Settings.
Note: If you are visiting Accounts Explorer for the first time, you can click Account Settings from the header message that indicates to set up health KPIs. - In the Core Modules/Features section, click Add to select the key areas of your product. Ensure to select core modules or features that best represent your product’s value. These selections impact how metrics such as Core Feature Usage, Product Score, and others are calculated across accounts. While up to 100 core features are supported (for very large enterprise products scenarios), we recommend keeping the list as focused and minimal as possible.
- Search or select the required product areas using labels, modules or features.
- Click Save. Changes may take up to 24 hours to appear in Accounts Explorer.
After configuring core features, the next step is to define the threshold ranges for the account health KPIs available in Accounts Explorer.
Following are the configurable options for each metric:
| Metric | Available Configuration |
|---|---|
| Core Feature Usage | Define the red, yellow, green threshold range to classify coverage as low, moderate, or high usage or coverage respectively. |
| Active User Coverage | |
| Stickiness | Choose whether to calculate stickiness using DAU/MAU, WAU/MAU, or DAU/WAU. Additionally, define the color threshold range. |
| Product Score |
Configure the weight distribution across the available inputs:
Note
Additionally, define the red (At Risk), yellow (Neutral), and green (Healthy) threshold range to indicate product account health. |
Note: You can configure the thresholds using the sliders or by entering the lower and upper limits as percentages.
| Net Promoter®, NPS®, NPS Prism®, and the NPS-related emoticons are registered trademarks of Bain & Company, Inc., NICE Systems, Inc., and Fred Reichheld. Net Promoter ScoreSM and Net Promoter SystemSM are service marks of Bain & Company, Inc., NICE Systems, Inc., and Fred Reichheld. |