Retention Analytics
This article outlines the procedure to configure and use Retention Reports in Gainsight PX.
Overview
Retention Analysis reports help you discover which features drive retention and growth, including the window of time you have got to guide users to realize the value of your product.
Key Benefits:
- Know how well your product retains its users by establishing a baseline and measuring over time.
- Identify the window of time you have to guide users to realize the early value of your product.
- Validate your hypothesis on which features and user attributes drive retention and growth
Your ideal user retention graph should look like a smile (curves back up) as customers increase their usage over time. This means that over time, you are giving your users more reason to come back and adopt your product. This can come from introducing new product capabilities that users want and executing specific re-engagement efforts outside of your product to help them realize the value of your product.
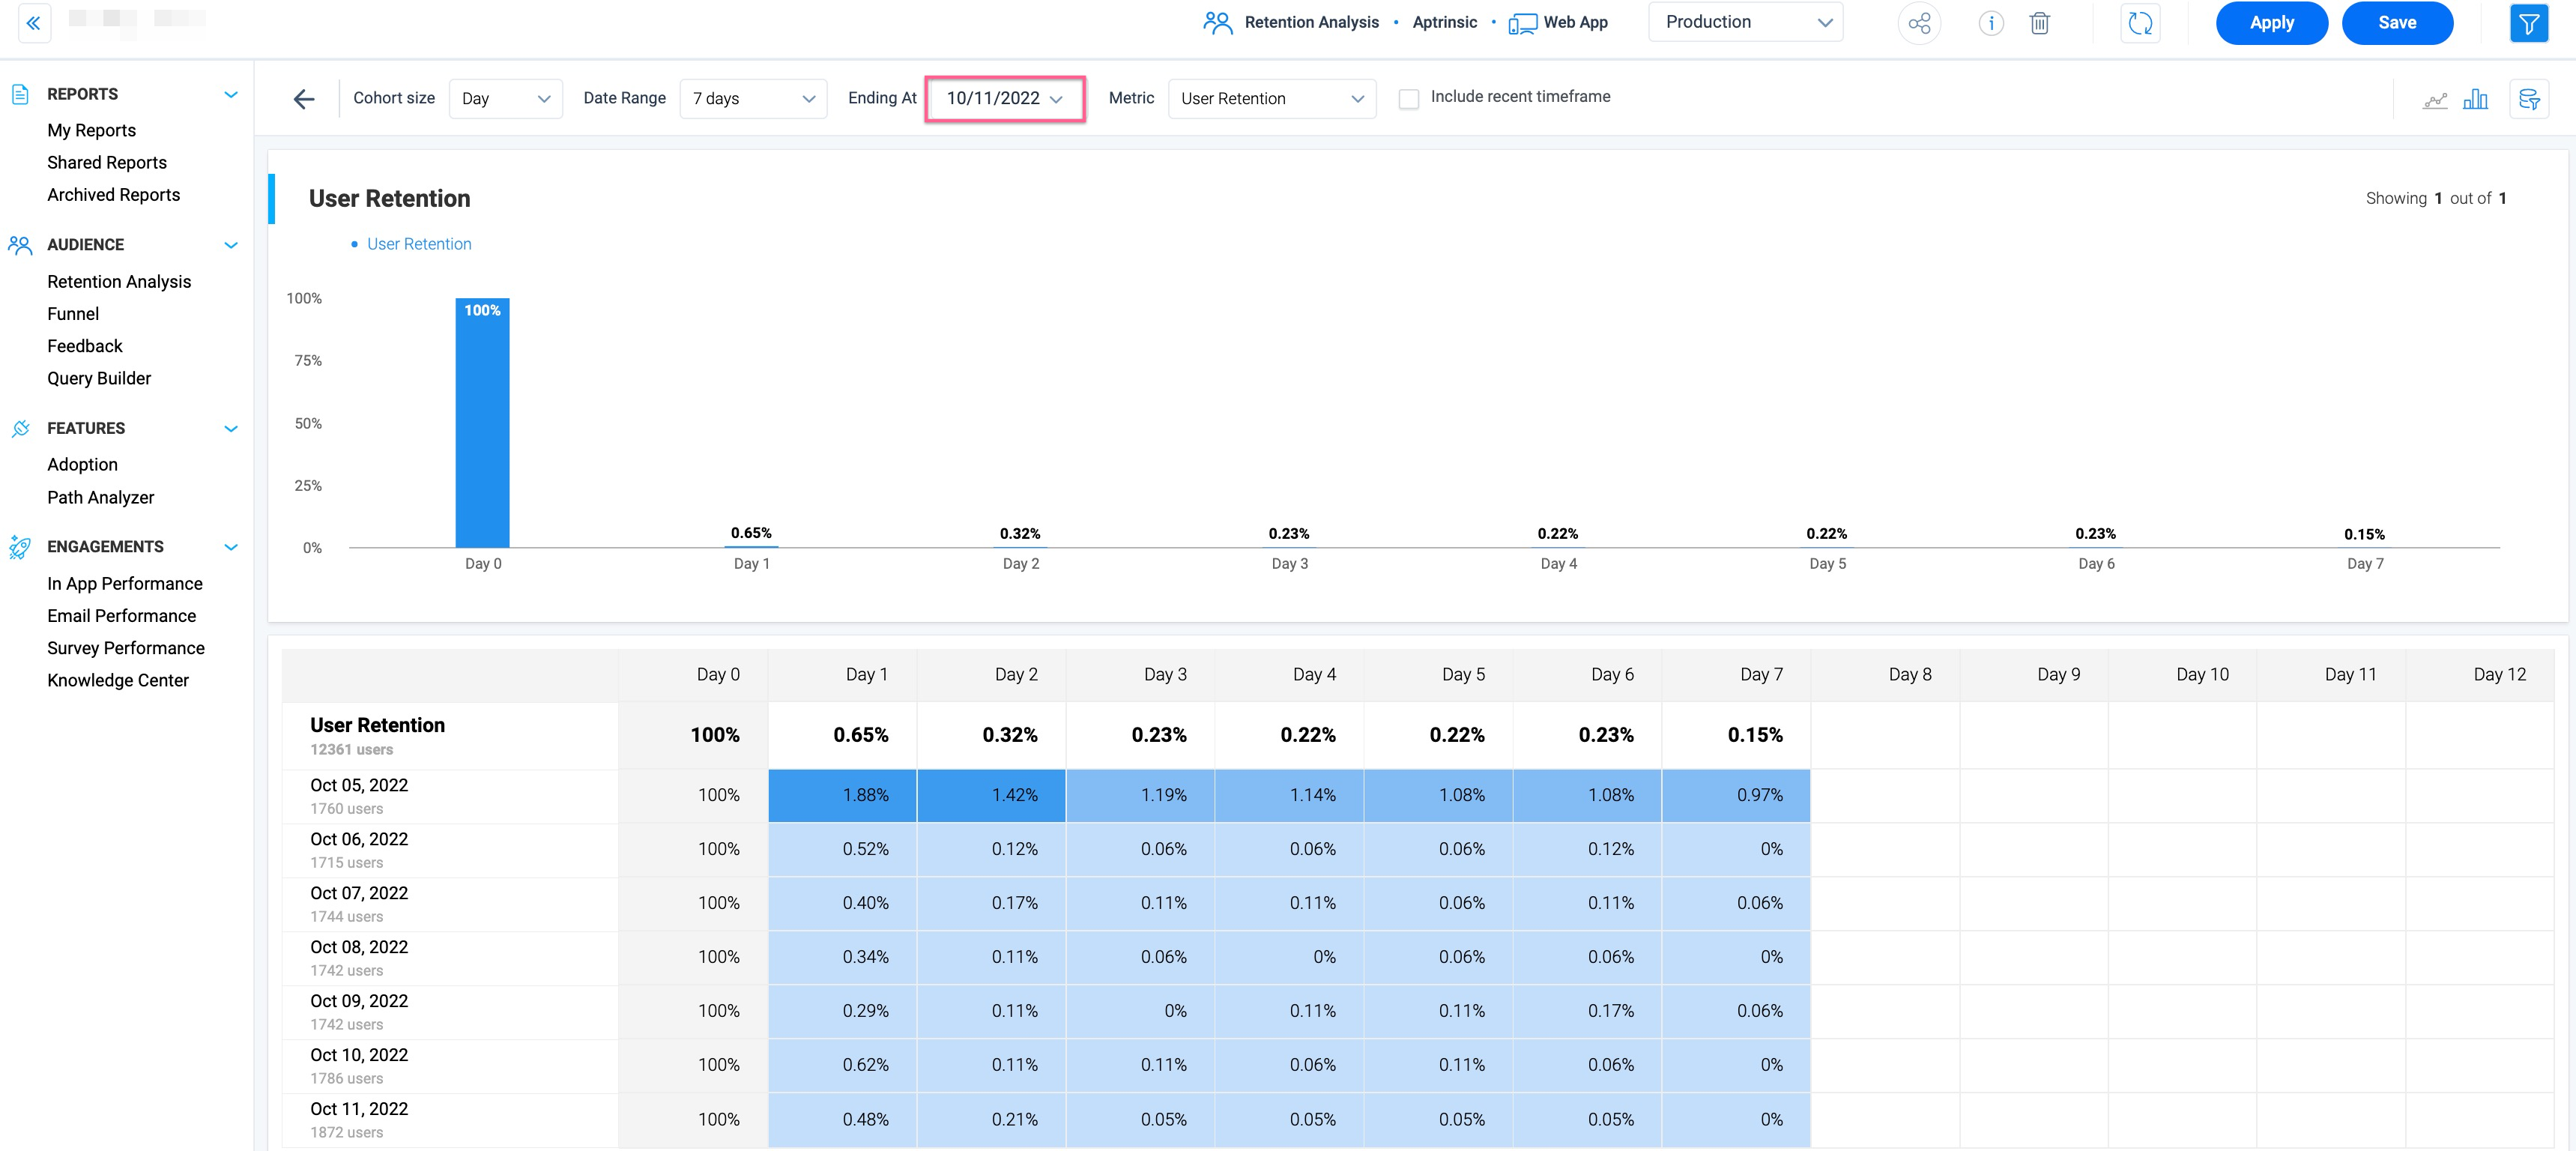
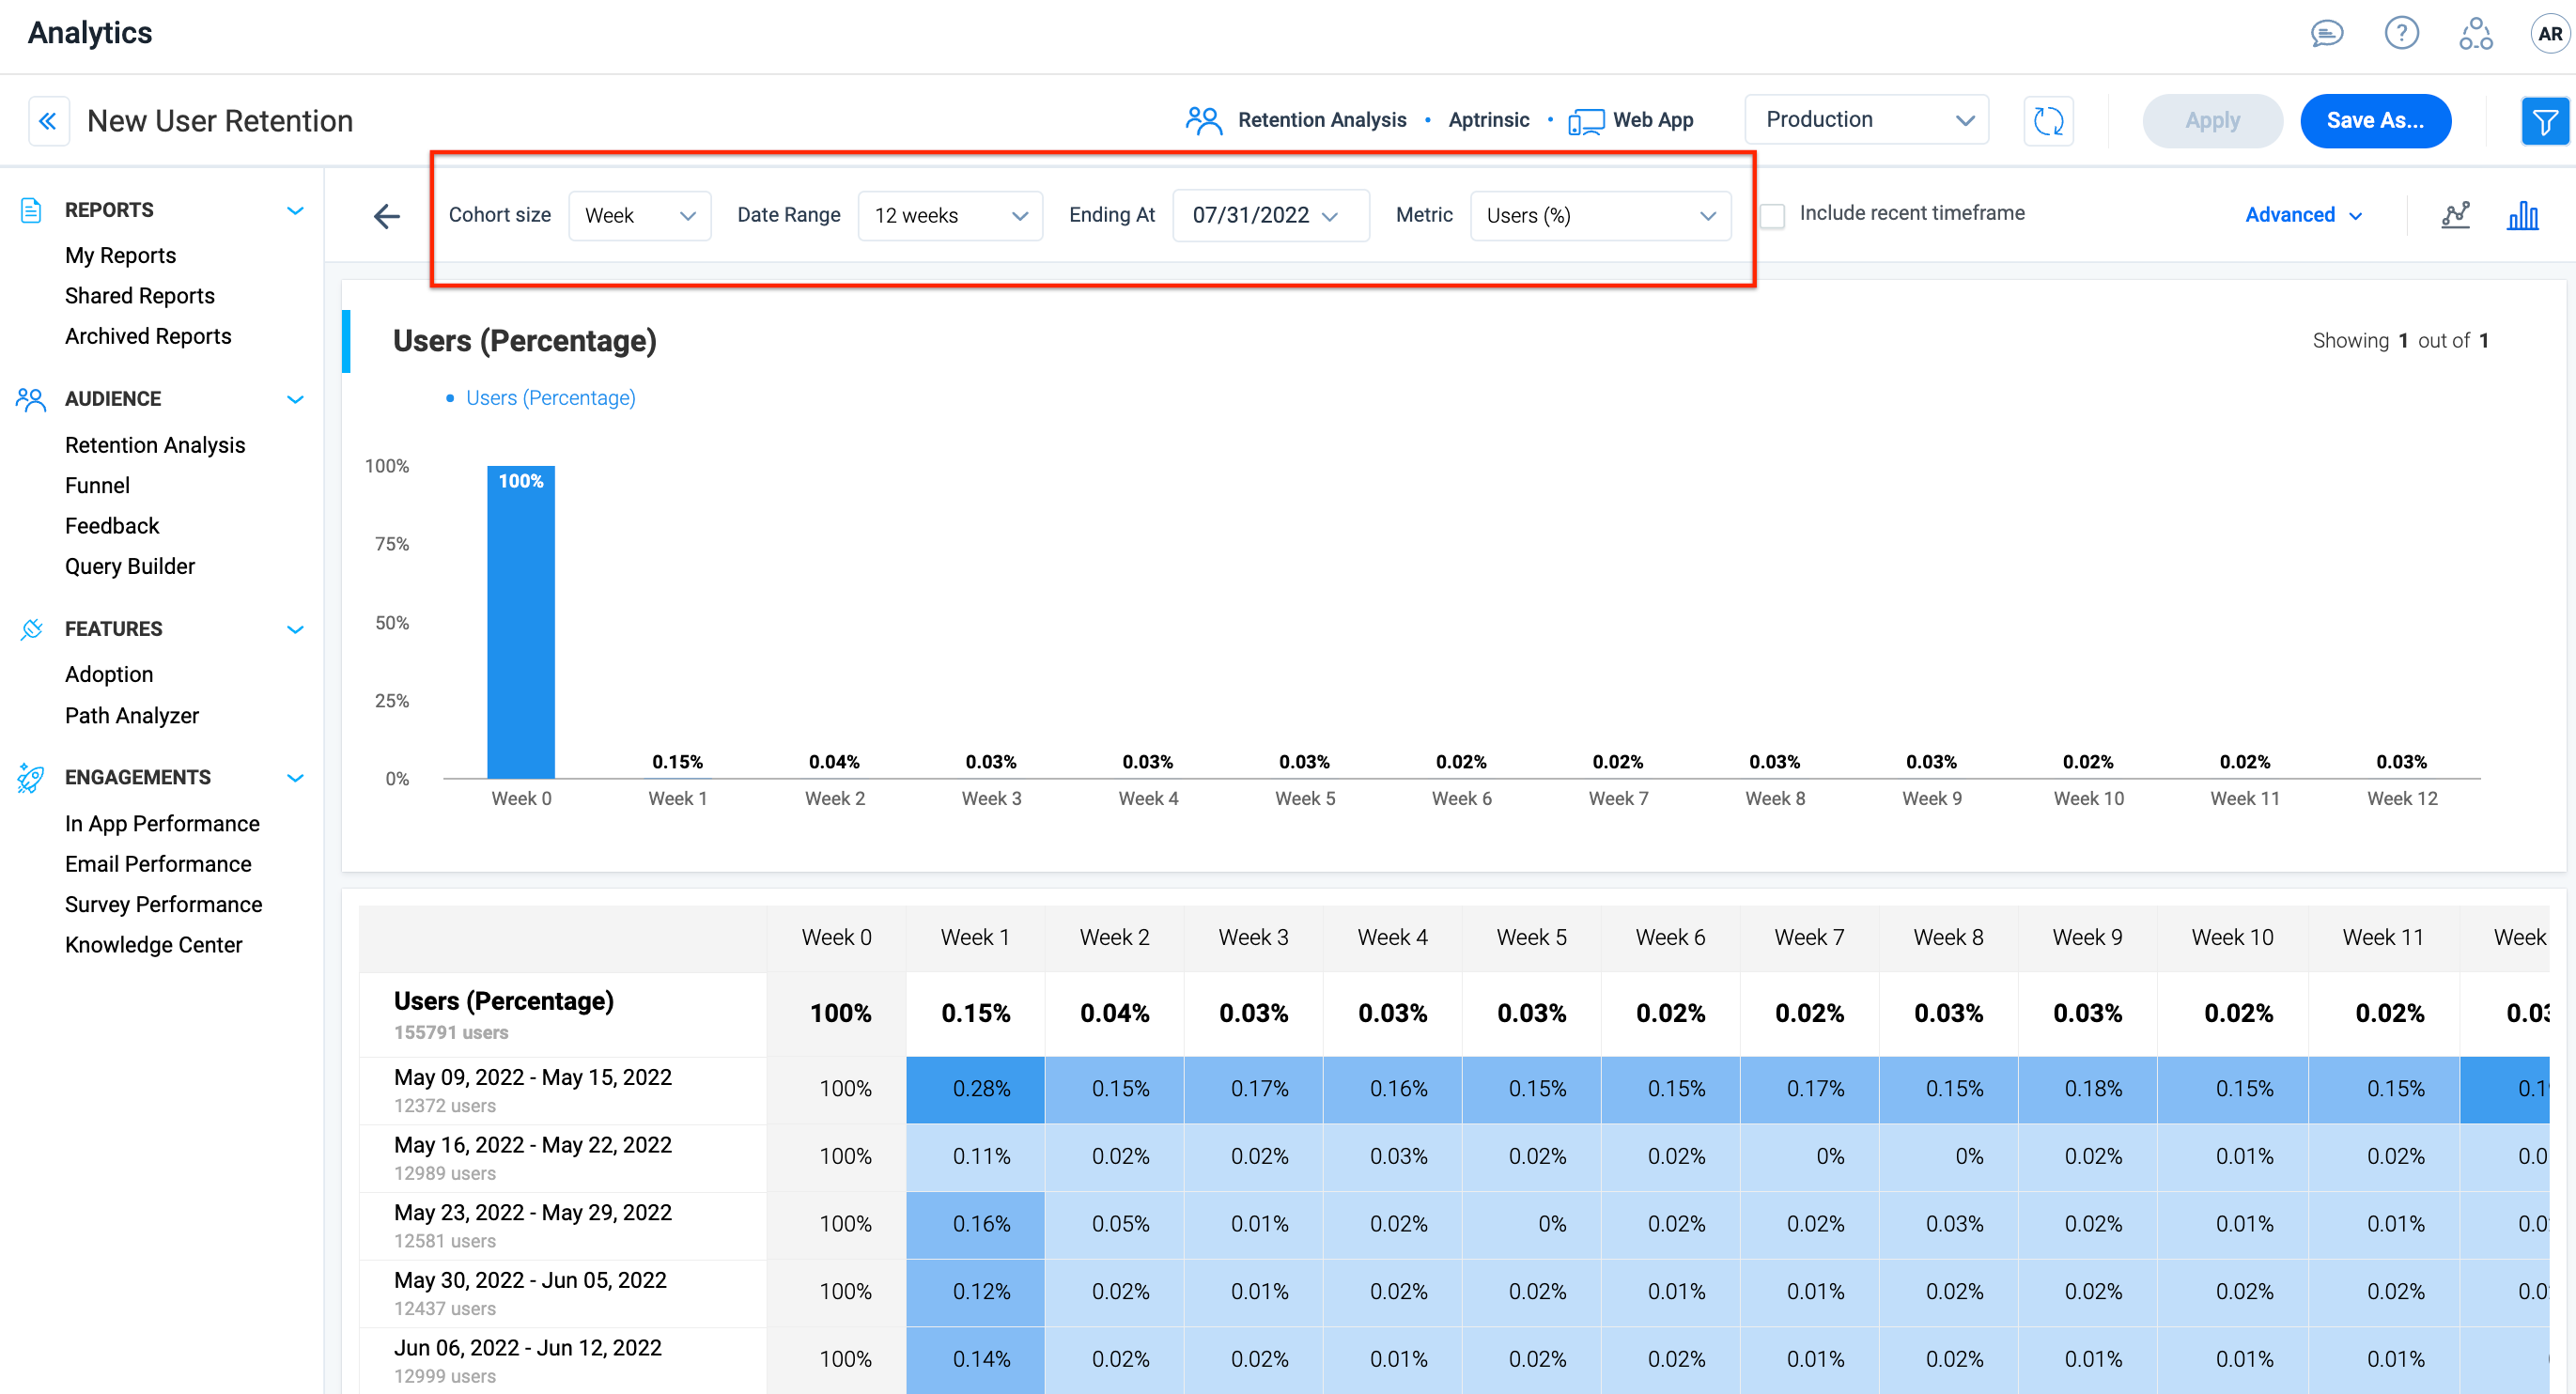
Retention Analytics Settings
Following are the setting options in a Retention Analytics report:
- Cohort size: Represents how you divide your users based on signup date daily/weekly/monthly.
- Date range: You can configure the date range you wish to cover based on the end date.
- Metric: You can use different dimensions as a base for your retention analysis.
- Users: Use user retention number as a base for your retention analysis.
- Users (%): Use user retention percentage as a base for your retention analysis.
- Accounts: Use account retention numbers as a base for your retention analysis.
- Accounts (%): Use account retention percentage as a base for your retention analysis.
- Events: Use the number of events as a base for your retention analysis.
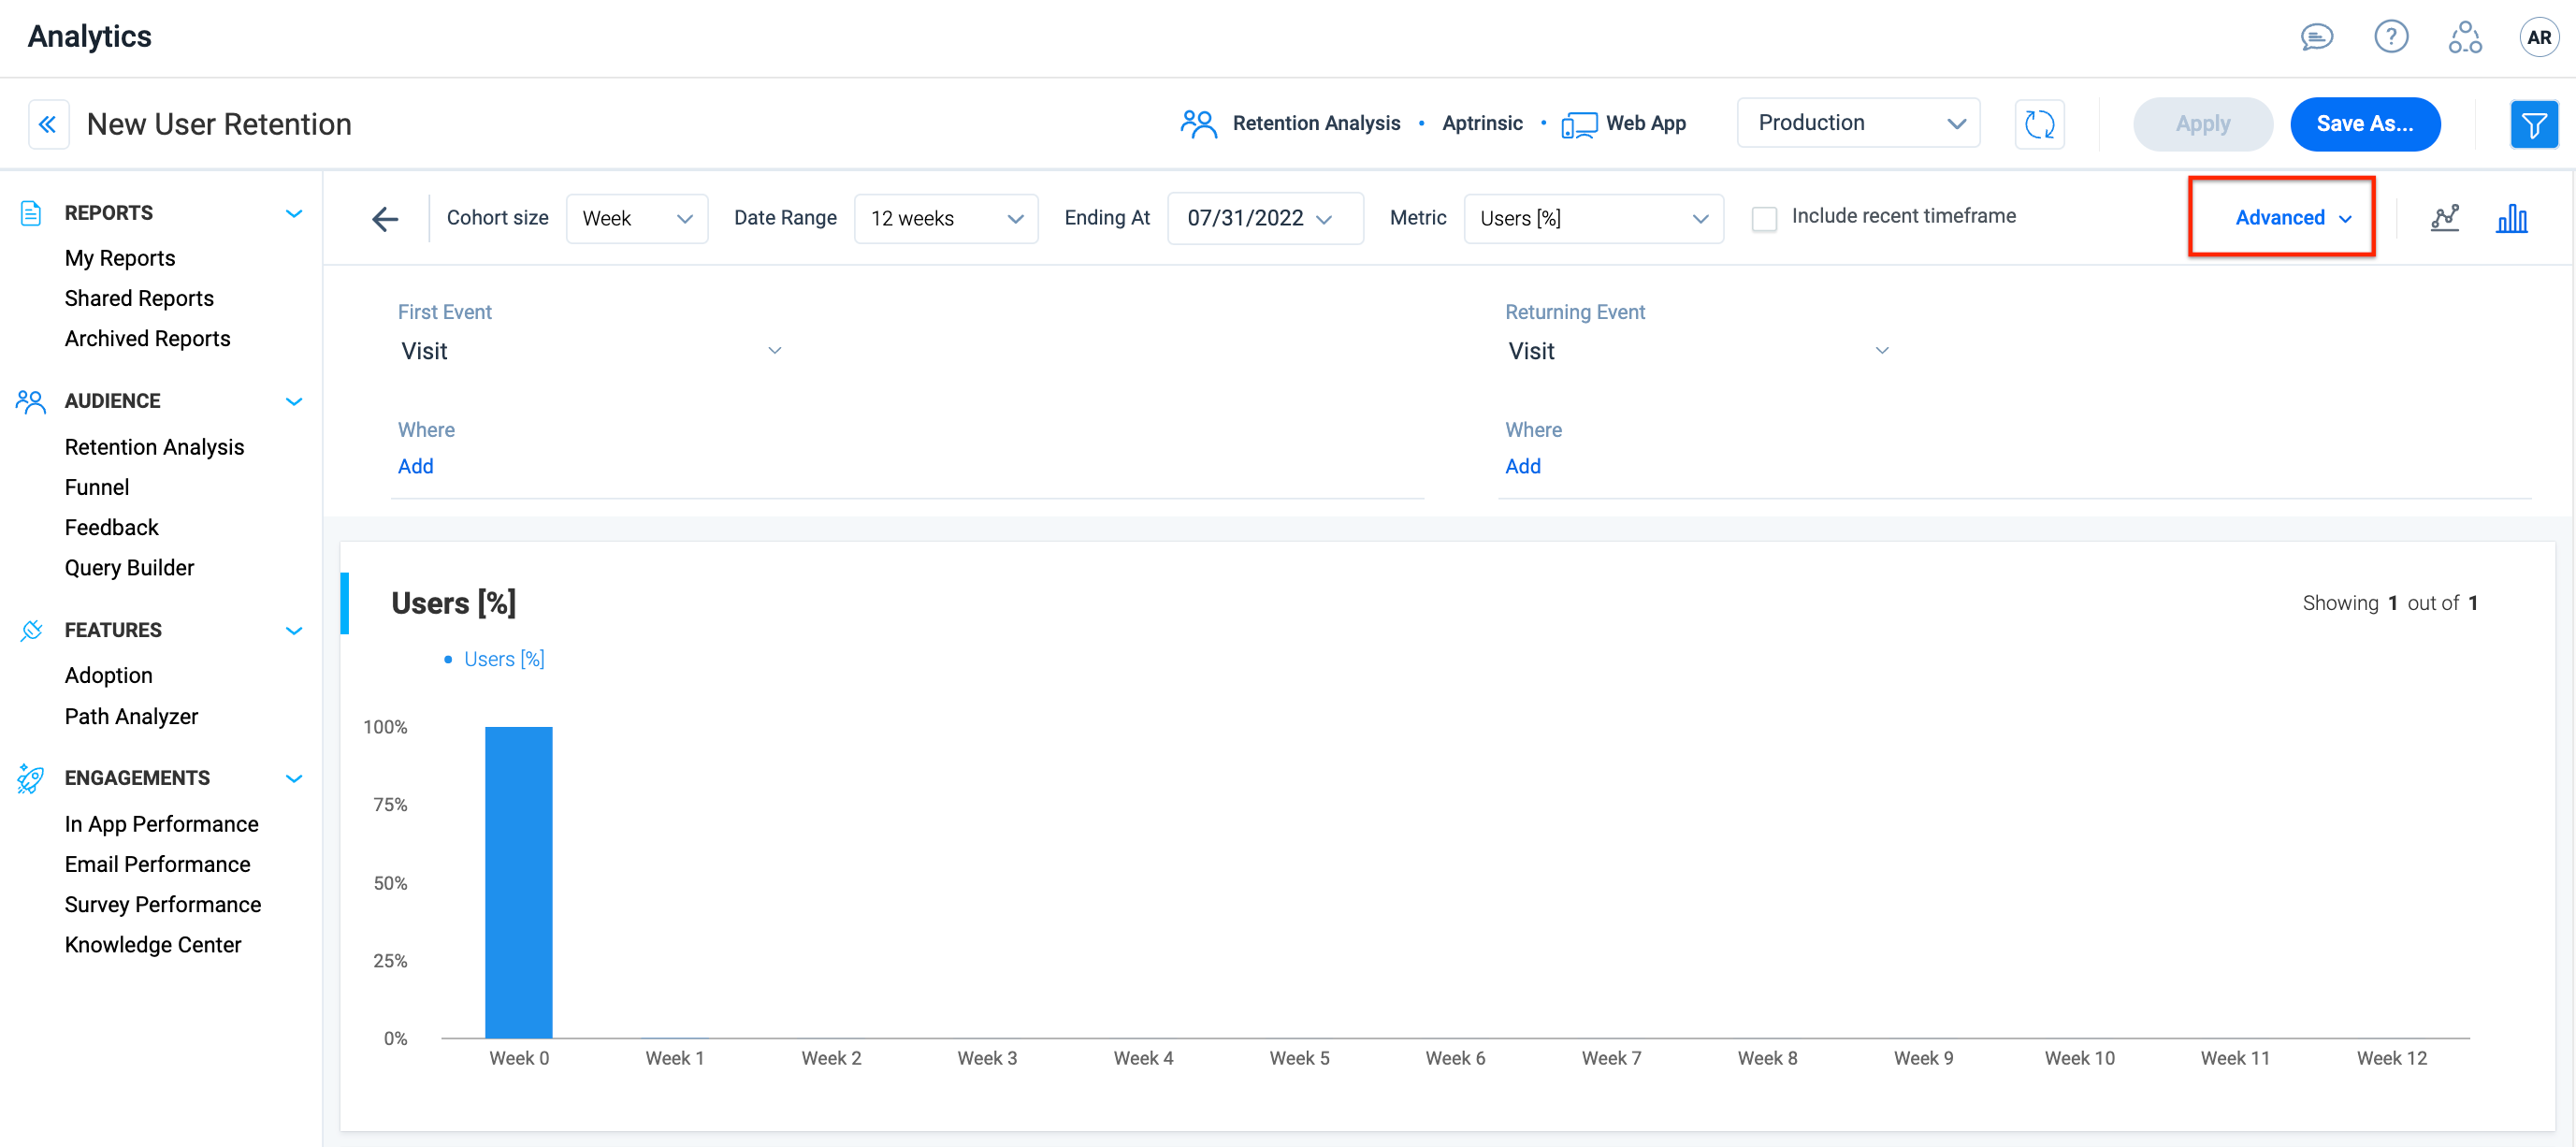
- Advanced filter: Compare and fetch data between two qualifying events.
Note: By default, the First Event and Returning Event fields in the Advanced filters are set to Visit, and hence the retention analysis report displays data accordingly. To display accurate data, it is recommended to configure the events as per the requirement. For more information, refer to the Advanced Filters in Retention Analysis section.
Create Retention Analysis Report
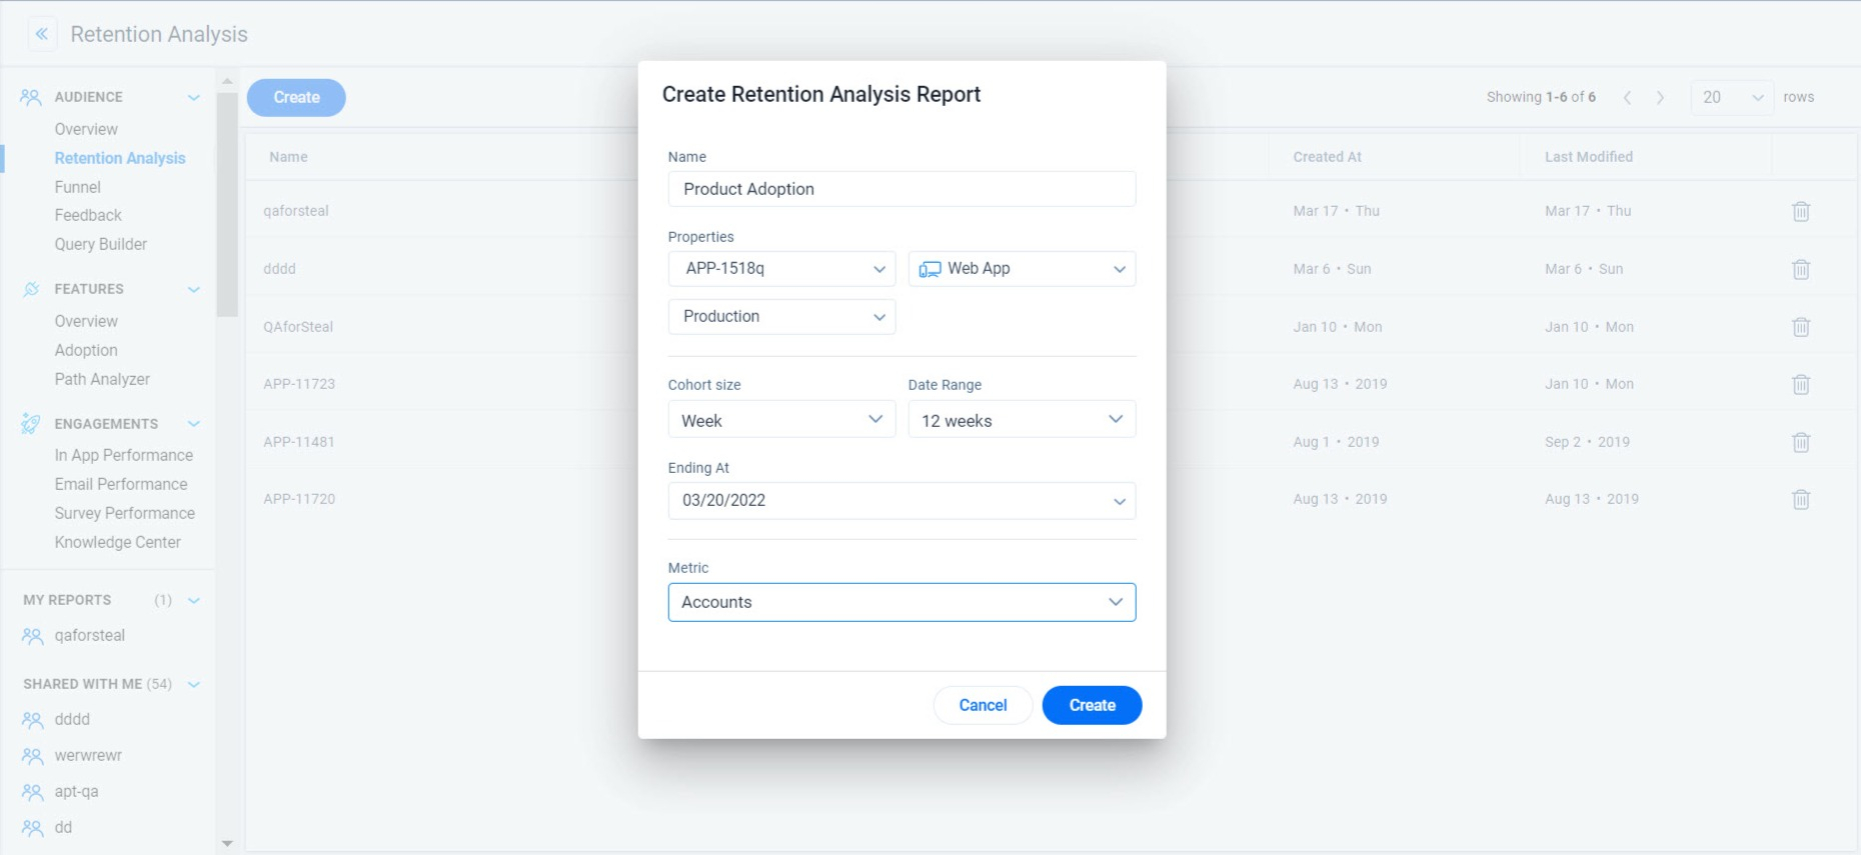
To create a new Retention Analysis report
- Click Create in the list view page.
- In the Create Retention Analysis Report window, provide the following details:
- Name: Provide the name of the report that indicates the purpose.
- Properties: Verify the product, channel, and environment.
- Cohort size: Select from the options Month/Week/Day.
- Date Range: Select the number of months, weeks, or days for the report generation.
- Ending At: Select the end date for the report.
- Metric: Select the base metric for the report.
- Click Create. The Retention Analysis report is generated.
Analyze Retention Report
You can analyze any of the Retention Reports that you have created by clicking on the reports from the list view page. The following analysis options are available:
- Benchmark Different Cohorts
- Discover Product Growth Opportunities
- Check the Product Market Fit
- Increase the User Retention
- Understanding the Report
Benchmark Different Cohorts
Using the filter, you can measure different user and account segments as well as feature usage and compare them side by side to gain a greater understanding and perspective of either the percentage or the absolute numbers you are using. You can also view the data as time-series or as a bar-chart.
Discover Product Growth Opportunities
When you have multiple customer segments and/or types of users in your product, you may need to review the user retention for each segment as they will have different usage patterns.
Check the Product Market Fit
When your product has achieved product-market fit, your user retention will flatten out over time. If the line trends towards zero, users are not realizing value in your offering and not returning back to your product. This trend line down to 0 is also described as a having leaky bucket. No matter how good your customer acquisition is, ultimately you are in trouble if you cannot deliver value and keep users coming back.
Increase the User Retention
The first step to increasing your retention is to understand who are the users with the best retention rate and what are they doing in your product. For example, per the detailed cohort analysis below, we can see that users who signed up between August 24th and August 30th have the highest retention over time.
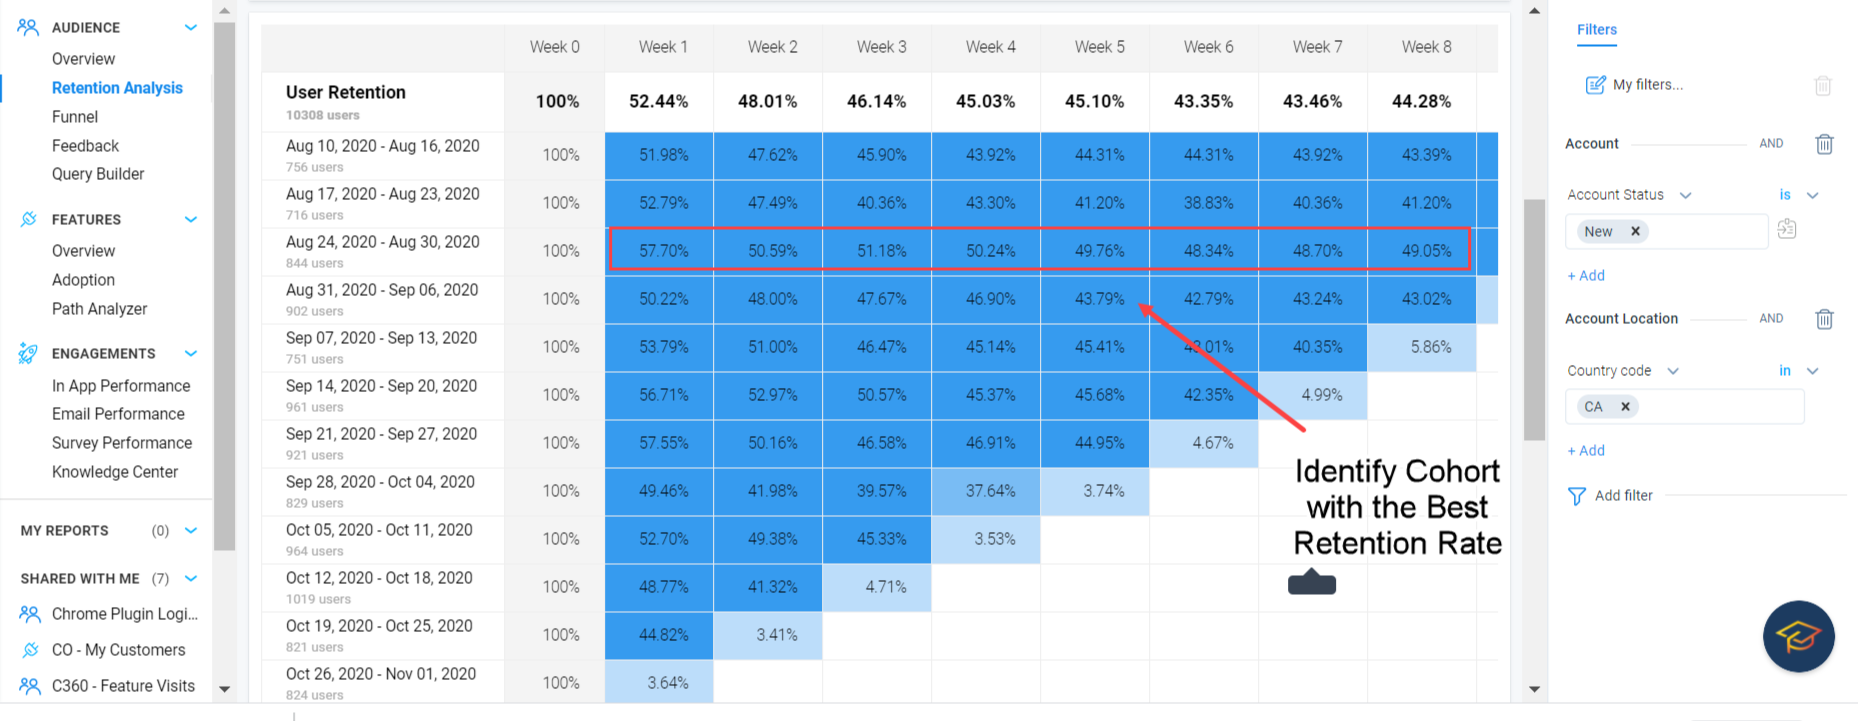
The smile effect in your user retention report is what you strive for. This indicates a thriving customer base that is returning to use your product more and more over time.
For all users within this cohort, you need to know three factors:
- The features are they using
- Do they have common characteristics (demo/firmographic)
- The users' signup source
With these three characteristics, you can gain a complete picture of your ideal user profile and their motivation for using your product. Armed with this information, you now can introduce personalized product experiences to guide all users to adopt the “aha” moments within your product.
For more information, refer to Analytics FAQs article from the Additional Resources section.
Understanding the Report
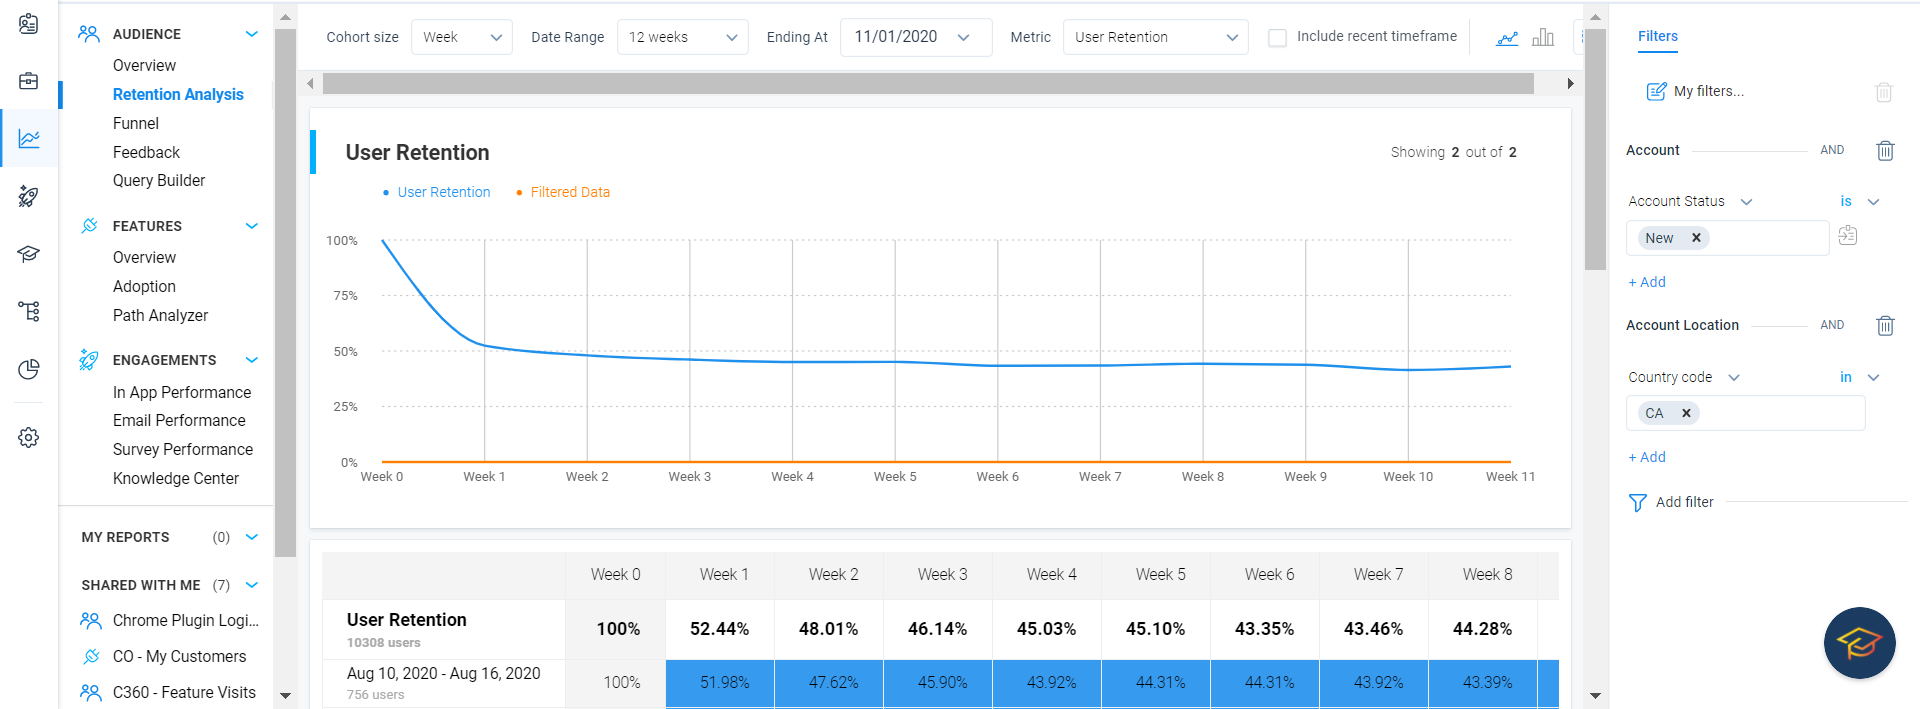
The retention rate is calculated by analyzing user, account, or event retention over specified periods such as days, weeks, or months within a given date range. The following are a few points to consider on how PX calculates the rate of retention:
- Week 0 Column: Represents the initial total number of users, accounts, or events, serving as the cohort's base size. This can be displayed either as an absolute number (#) or as a percentage (%) of the total items under consideration.
- Week 1, 2, 3, ... n Columns: These columns track the retained values, indicating how many users, accounts, or events from the original cohort (Week 0) continue to engage in subsequent weeks. Retention can also be expressed either as an absolute number or as a percentage of the Week 0 total.
- Retention as an Absolute Number (#): For any given week n, the retained value is simply the sum of all users, accounts, or events active during that week.
- Retention as a Percentage (%): To calculate retention as a percentage, the formula used for Week n is [(Retained/Total) x 100]. This formula calculates what percentage of the initial cohort (Week 0 total) is still active or engaged in week n.
- Summary Row: The top summary row for each week n column is derived by taking the average (for percentages) or sum (for absolute numbers) of all the rows under week n. This provides a concise overview of how retention trends over time, giving insights into user, account, or event longevity and engagement patterns.
Example
Assume that it’s 01 Nov 2020 today. In the above image, the Retention Analysis report started on 10 Aug 2020 and has Week as the Cohort distribution. So, for the first week of Aug 10 - Aug 16, 51.98% of users signed up for the application. You can see that Week 0 shows 100%. Next week (Week 1) Aug 17 - Aug 23, 47.49% of the total number of users who signed up in the previous week logged back into the application. In Week 3, Aug 24 - Aug 30 51.18% of the total 756 users have logged in again. This is an incomplete cohort and the value may go up by the end of the week.
Similarly, in the second week Aug 17 - Aug 23, 716 Users signed up for the application (this does not include any of the 756 users who signed up during the week of Aug 10 - Aug 16). For these Users, Aug 17 - Aug 23 is their Week 1 and 52.79% of the Users logged back during Week 1, so far. This is an incomplete Cohort and the number may go up by the end of the week. Week 2 for these Users is yet to begin.
For the Week 1 column, the total percentile value (52.44%) is the average of all its retention values across different cohorts. Similarly, the overall percentage is calculated for all the other Week columns. As few Weeks still have incomplete Cohorts, they are excluded from the calculation of overall percentage, until the end of the week. This skews the overall percentage and brings the value down.
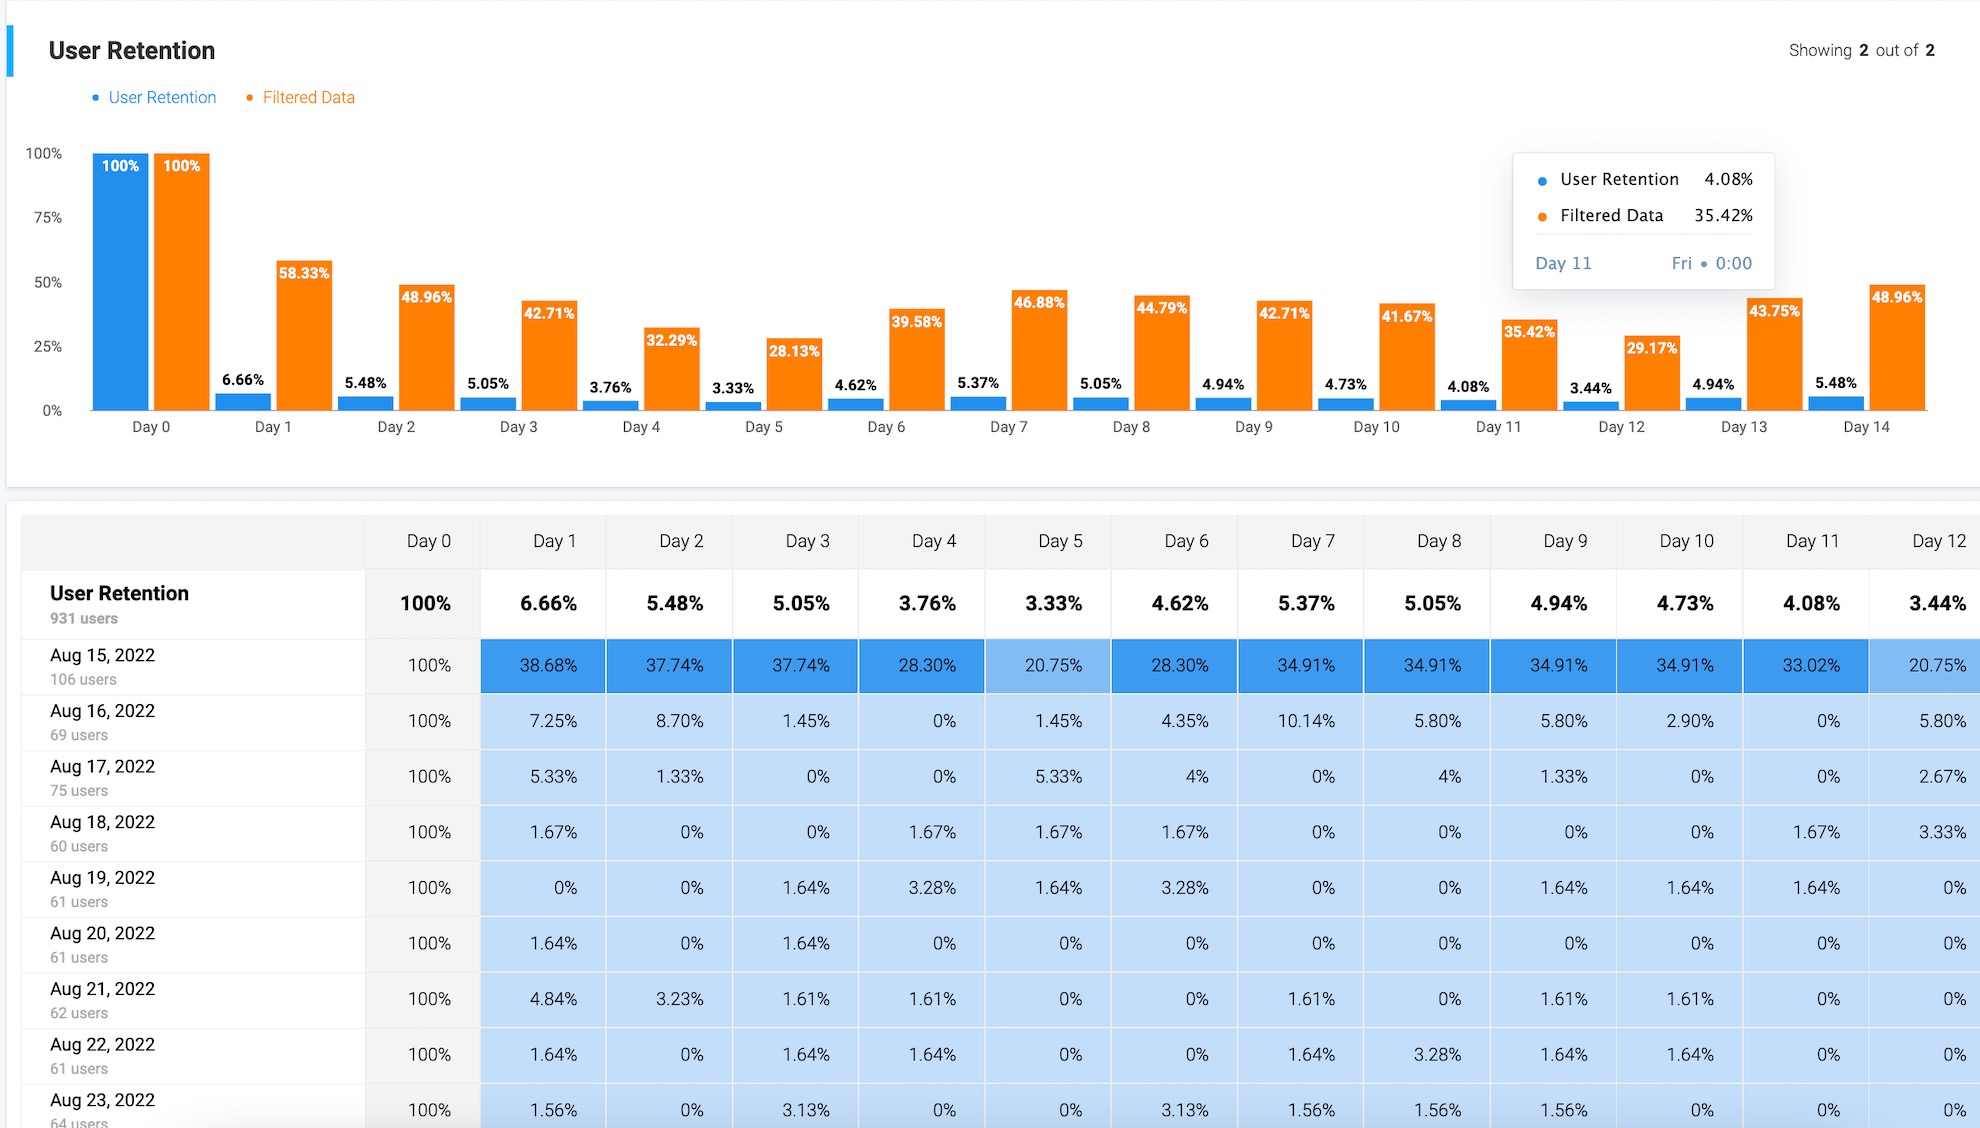
Advanced Filters in Retention Analysis
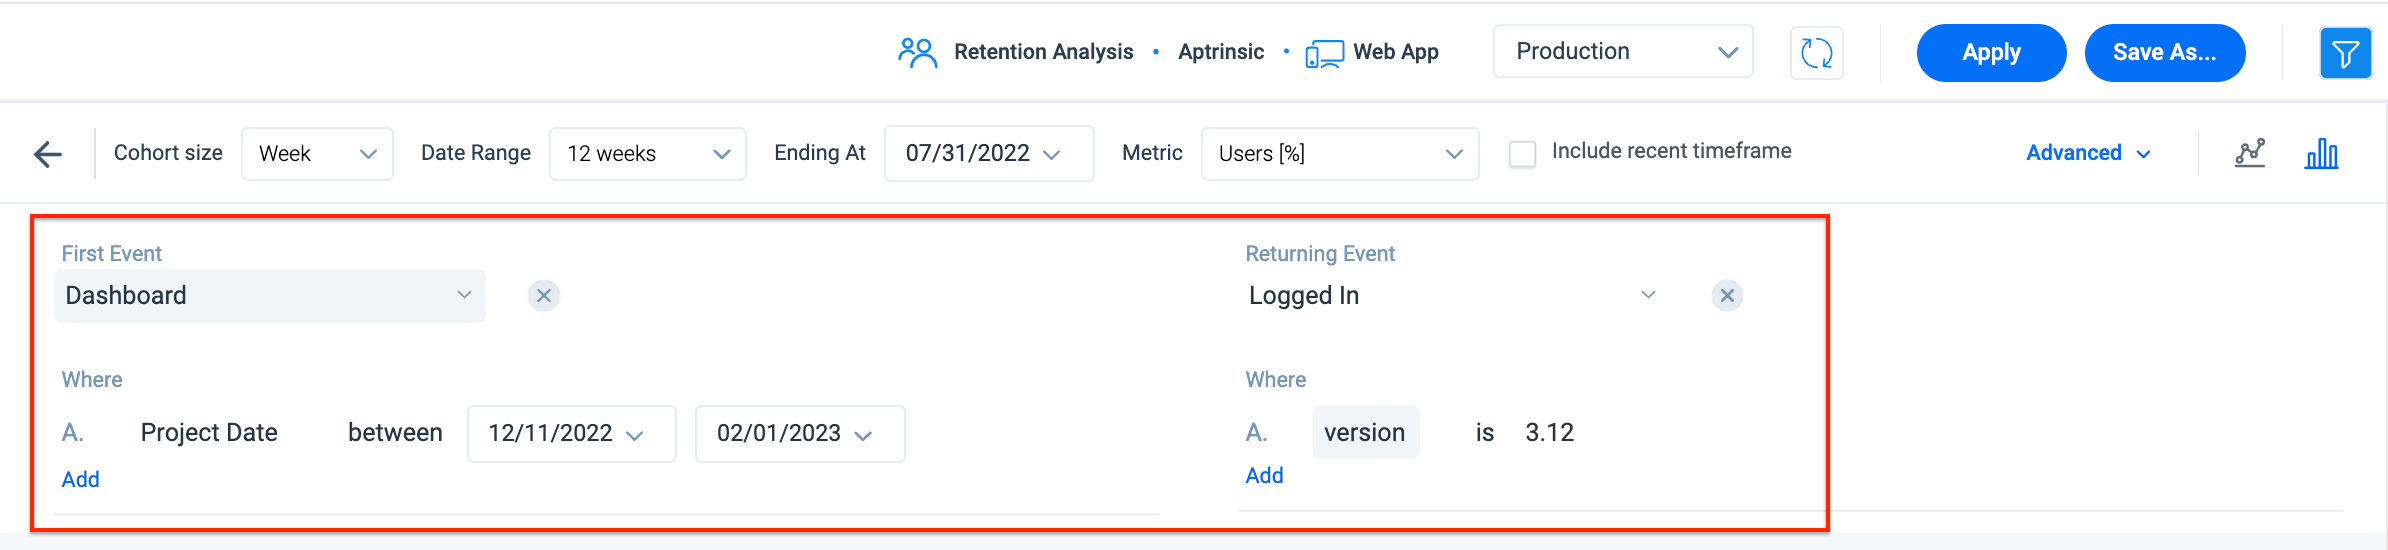
Gainsight PX also allows you to compare two events, in a Retention Analysis report. The two events to be compared are known as the First Event and Returning Event and these dropdown menus are located under the Advanced section. These dropdown menus contain the following event types that can be used as filters:
- First Event: When you select an event type in this field, the report filters the number of Users or Accounts that have clicked the event type during a given timeframe. The event types supported are features, custom events, page view events, session events, user attributes (sign up, custom attributes of multiple data types), account attributes ( create date, custom attributes of multiple date types).
- Returning Event: When you select an event type in this field, the report filters the number of Users or Accounts that have performed the action selected in the First Event field. The event types supported in the First Event field are supported in this field also. Apart from those event types, User and Account attributes are also supported in this field.
The report is generated in Cohort size selected (day, Week, Month).
Business Use case: You can calculate the number of users who signed up in your application (first event) and then compare this value (number of users who signed up) with the number of users who accessed the purchase page (or any other page), during a specific time period.
To compare two events:
- Navigate to Analytics from the left pane.
- Click the Retention Analysis report from the AUDIENCE section.
- In the header, click the Advanced option.
- Select the required event types in the First Event and Returning Event fields.
- In the Where fields, enter the attributes and other parameters for the respective event.
-
Click Apply.
Apart from the Advanced filters, you can also apply the regular Custom filters and filter the data based on the available parameters.
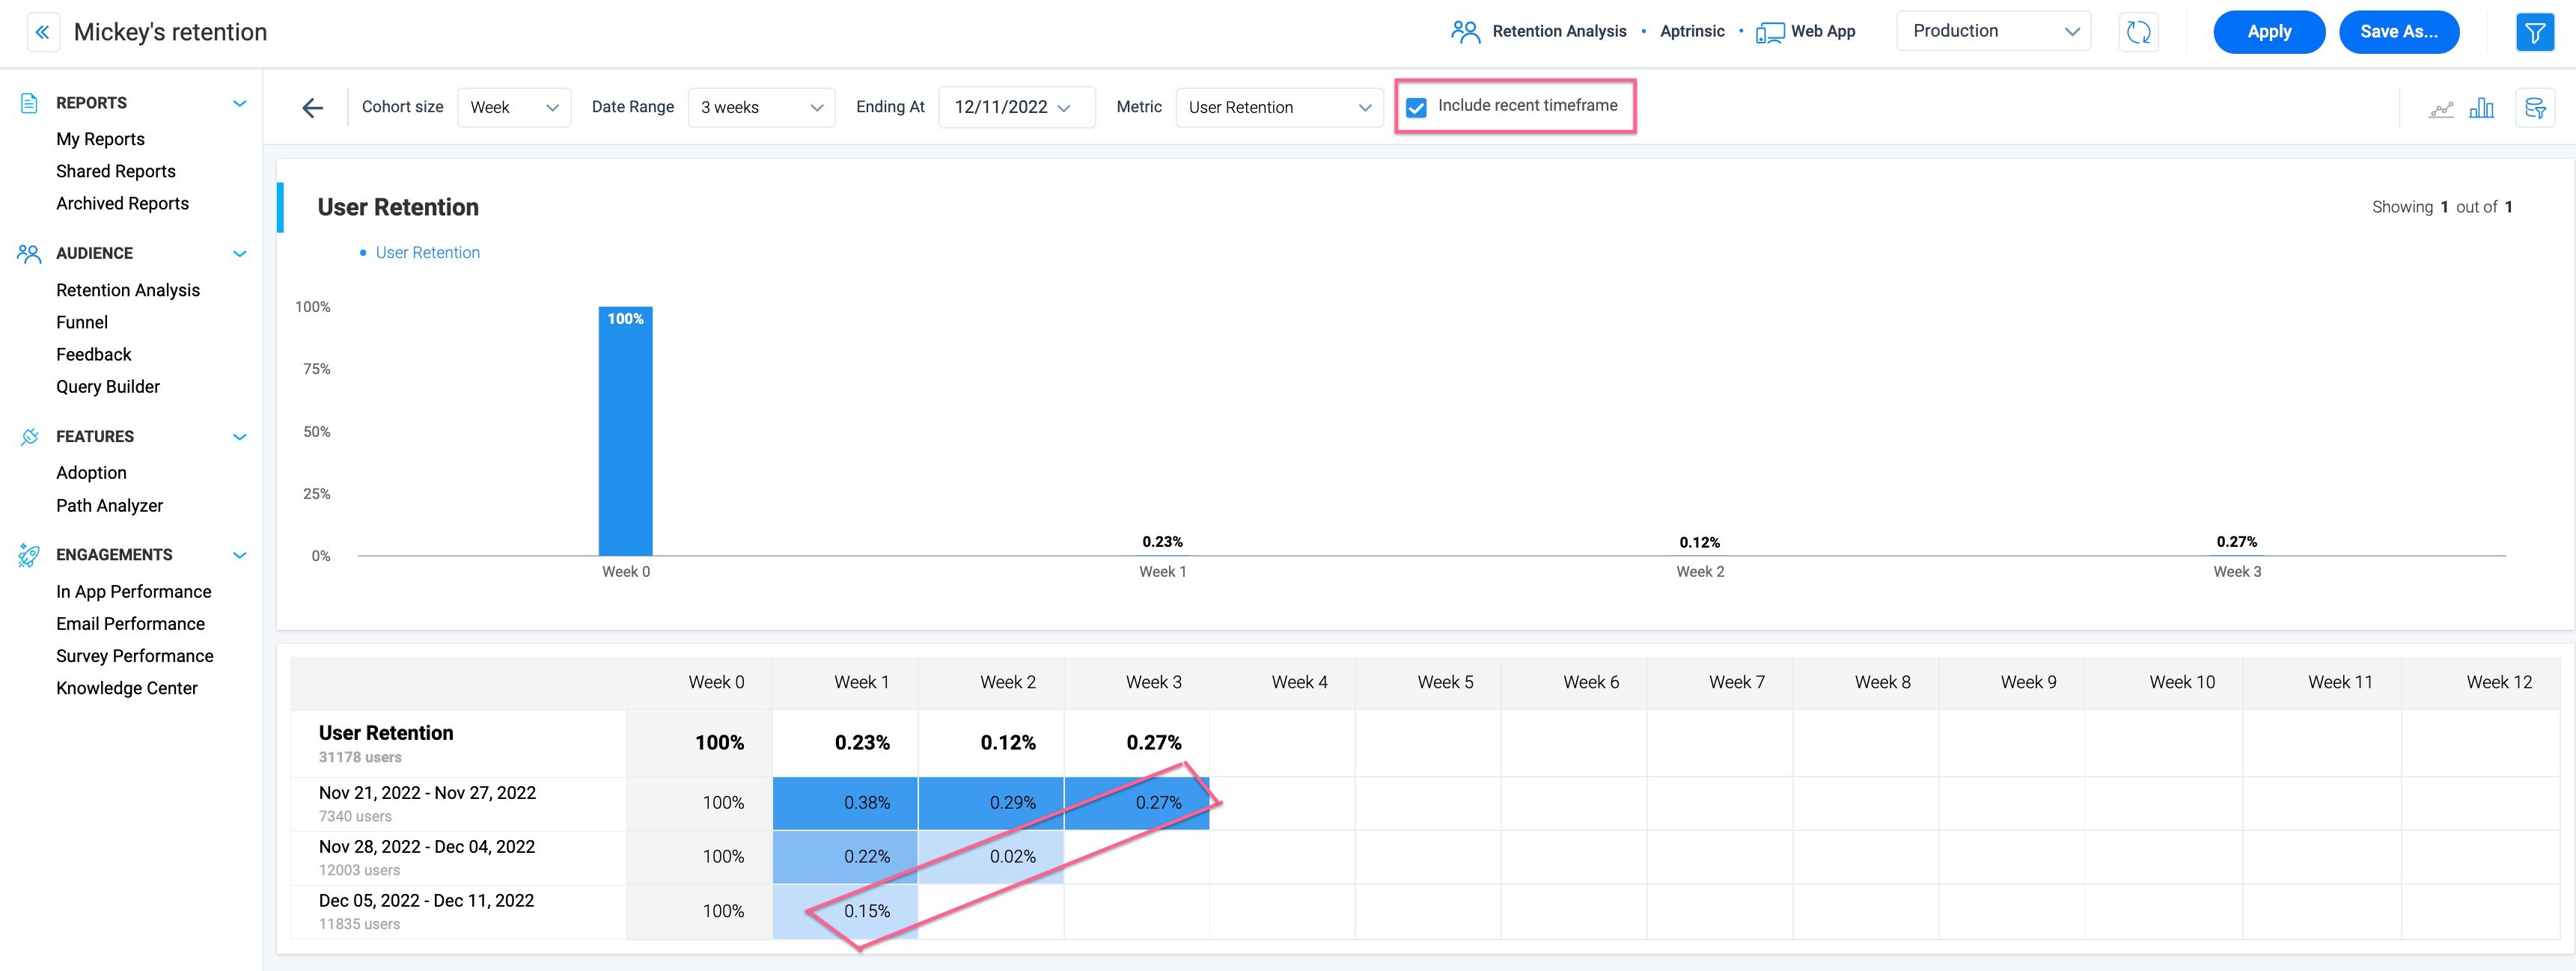
Include or Exclude Incomplete Time Frames
You can include the incomplete time frame of the most recent day, week or month, in the calculation of the overall week’s percentage. The Include recent timeframe check box can be used to accomplish this task. This enhancement provides you with more flexibility in the calculation of the Retention analysis report.
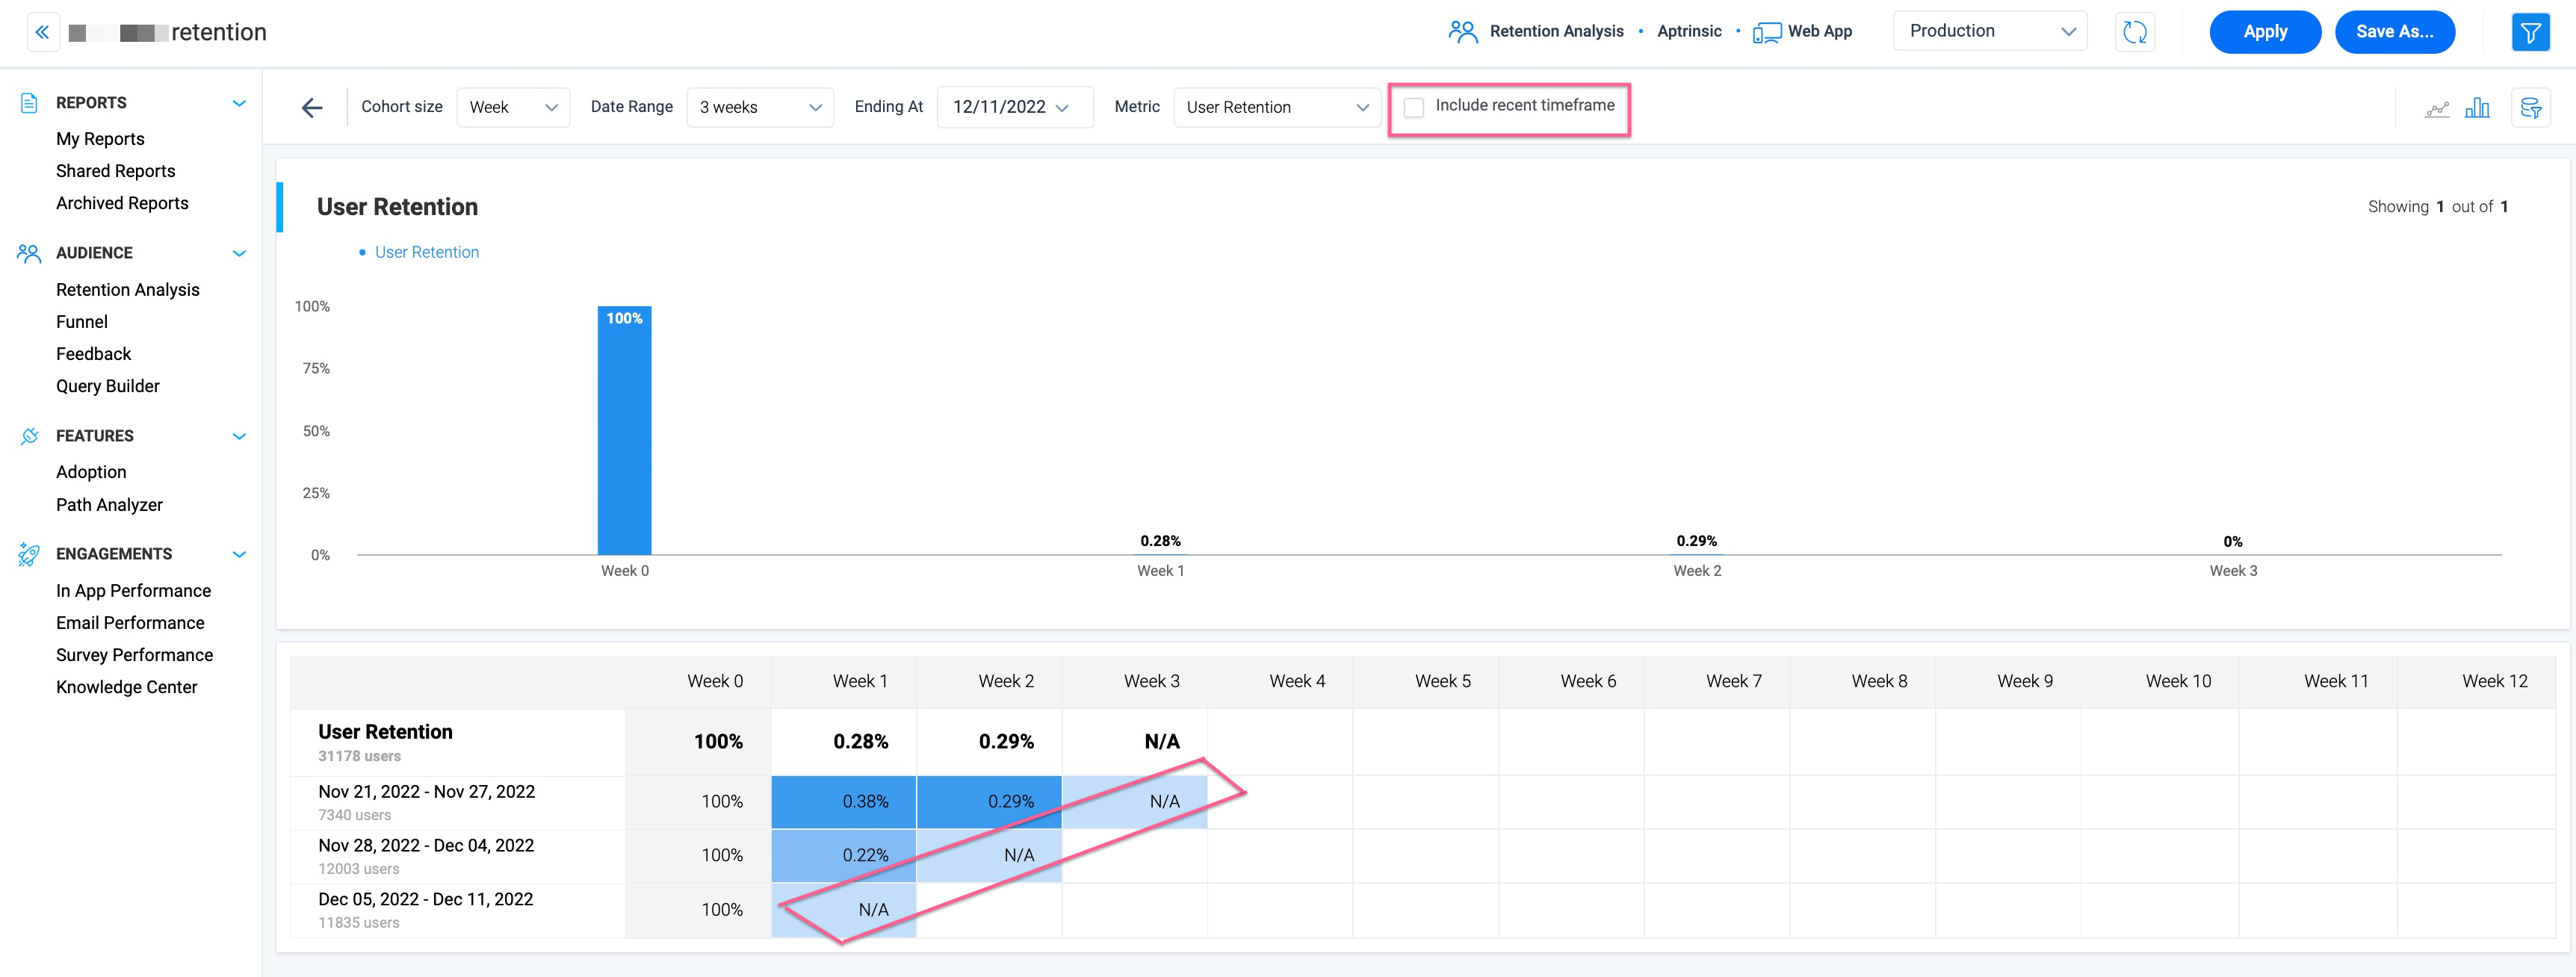
By default, the ongoing timeframe (day/week/month) is not included in the calculation. In this case, the ongoing week is not included in the calculation.
Note: If the selected timeframe is from the past, in this case October 2022, then including the recent timeframe is not required.