Adoption Analysis
This article explains how to analyze the Feature Adoption Rate of a feature/module.
Overview
With Feature Adoption Analysis, you can discover the features that impact revenue and customer lifetime value. Spot adoption trends across customer segments with the ability to slice and dice by user and account level attributes. By configuring Adoption Analysis you can learn about how well users have received a feature and it even provides insight about how well the new feature adoption has influenced the revenue.
Analyzing Feature Adoption
Adoption Analysis helps you to:
- Understand feature adoption and revenue attribution of a new feature/module
- Identify up-sell opportunities based on adoption depth and breadth
- Spot adoption trends across customer segments with the ability to slice and dice by usage and CRM data
- Measure the adoption success rate with a given cohort
Measuring Leading Features for a Given Cohort
Using usage data associated with your CRM data you can now measure usage trends based on different personas, the stage in the customer lifecycle, and CRM data.
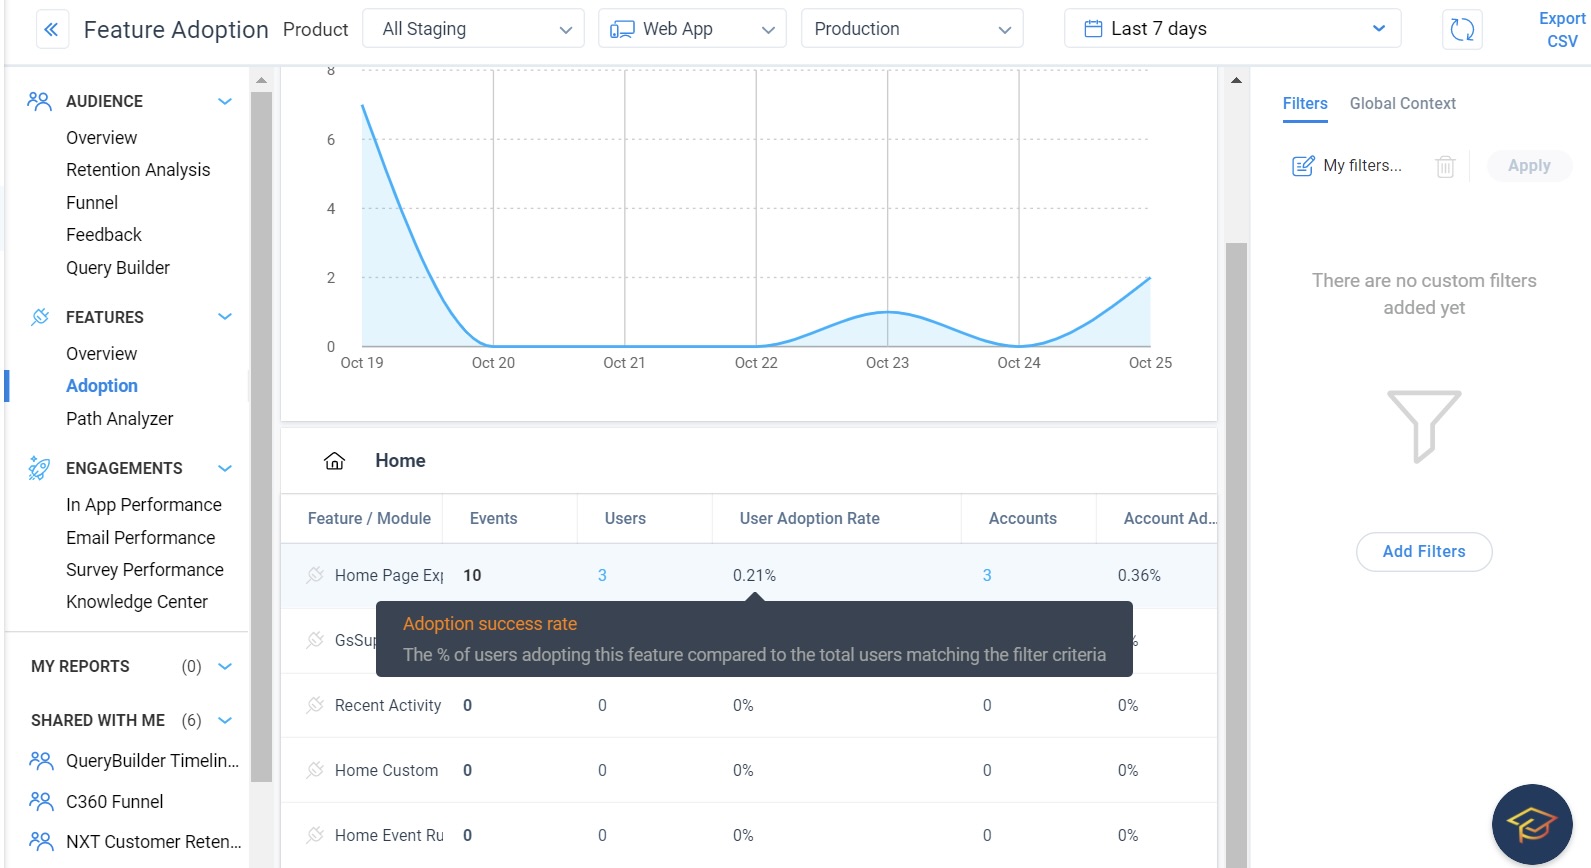
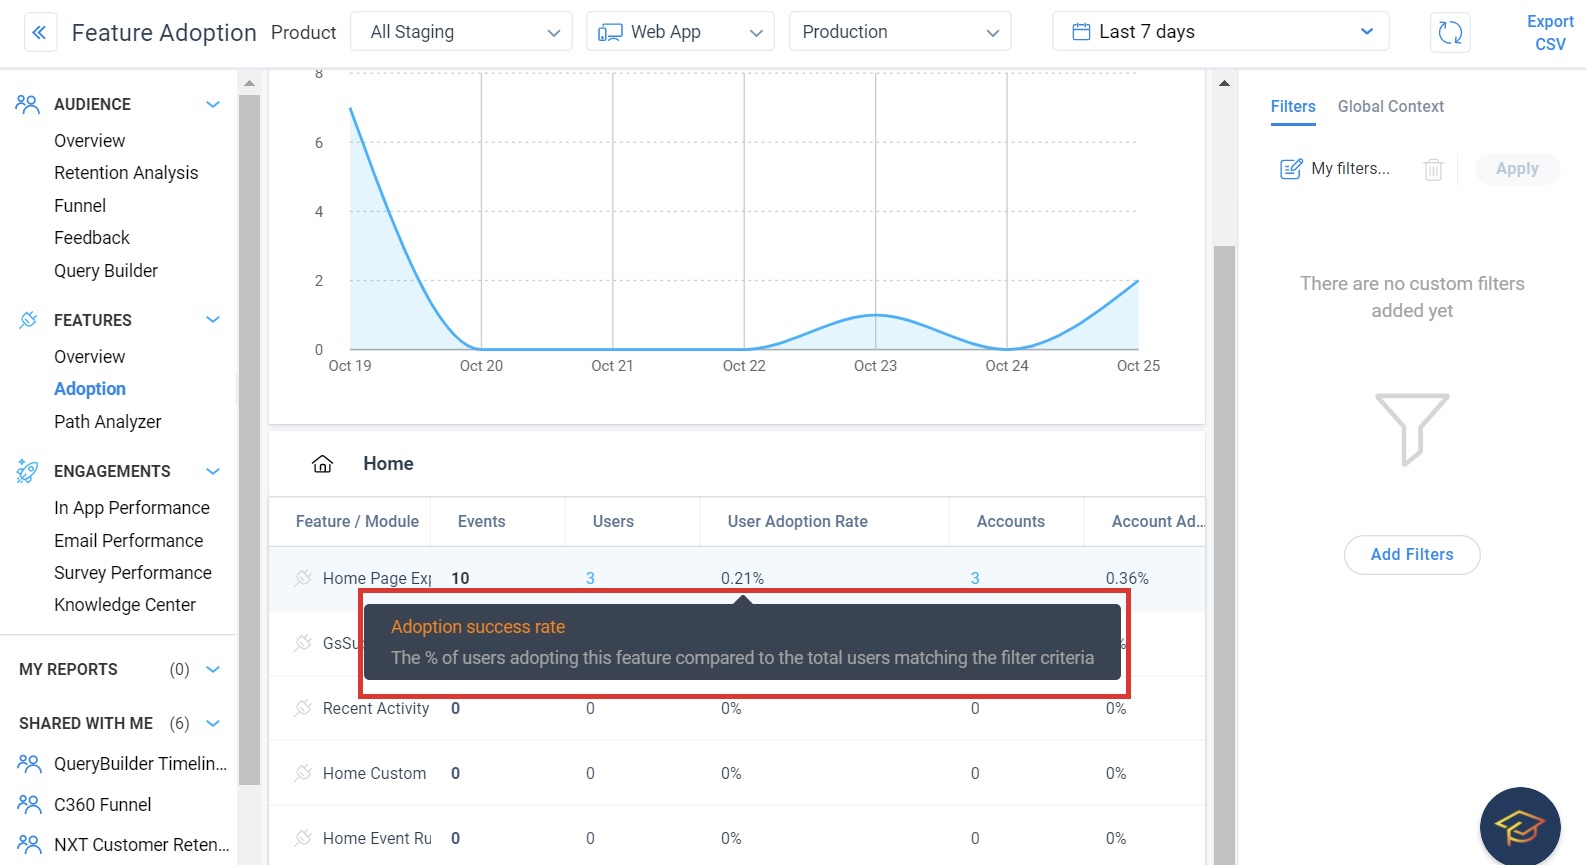
Understanding Adoption Success Rate
Gainsight PX measures each module or feature adoption rate comparing the active cohort who used the designated feature vs. the same active cohort who didn't, to help you understand the true potential of your feature adoption.
The Adoption Rate is calculated using the formula below:
Adoption Rate = [(Number of accounts)/(Number of active accounts in last 7 days + Number of accounts in Customer Segment)]*100
Focusing on Modules and Key Features
Gainsight PX aggregates and presents you with the data trends based on the way you modeled your product tree in order to surface relevant data without the need to collect dozens of tagged features.
Clicking on a module will lead to the underlying features.
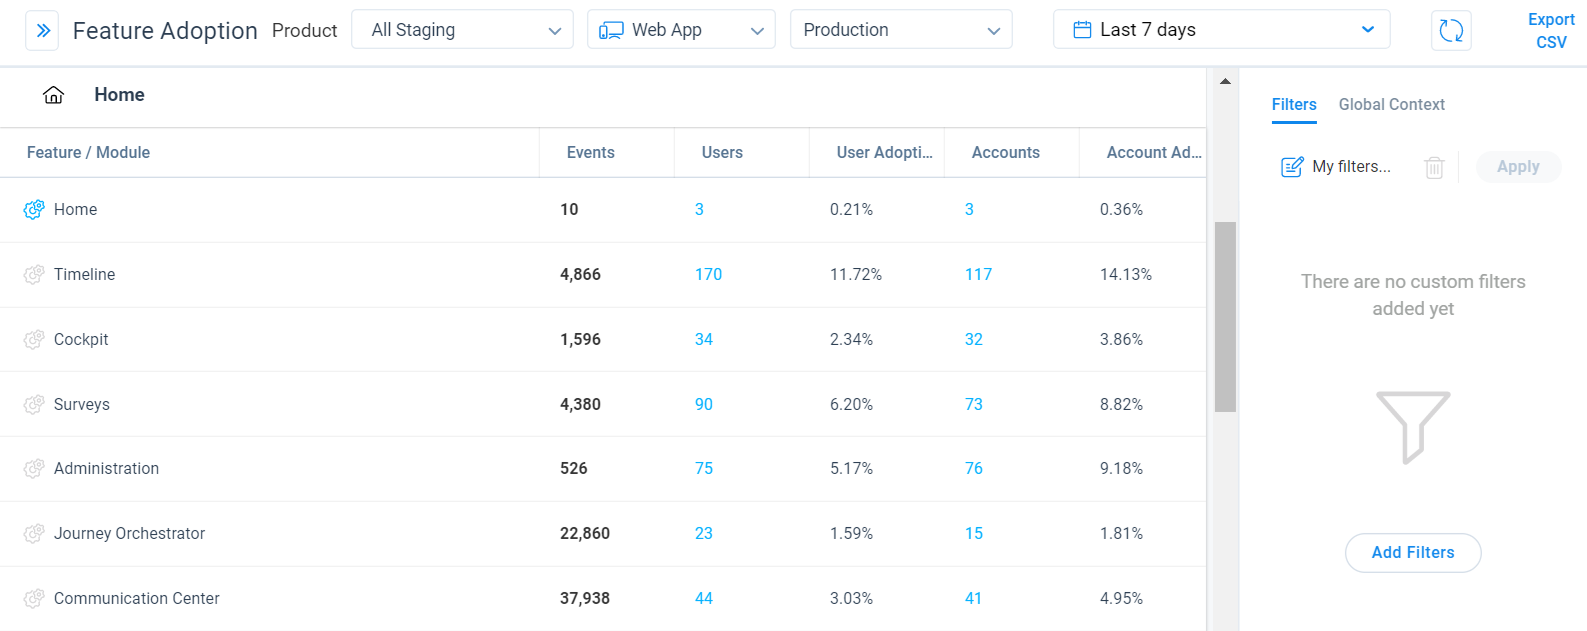
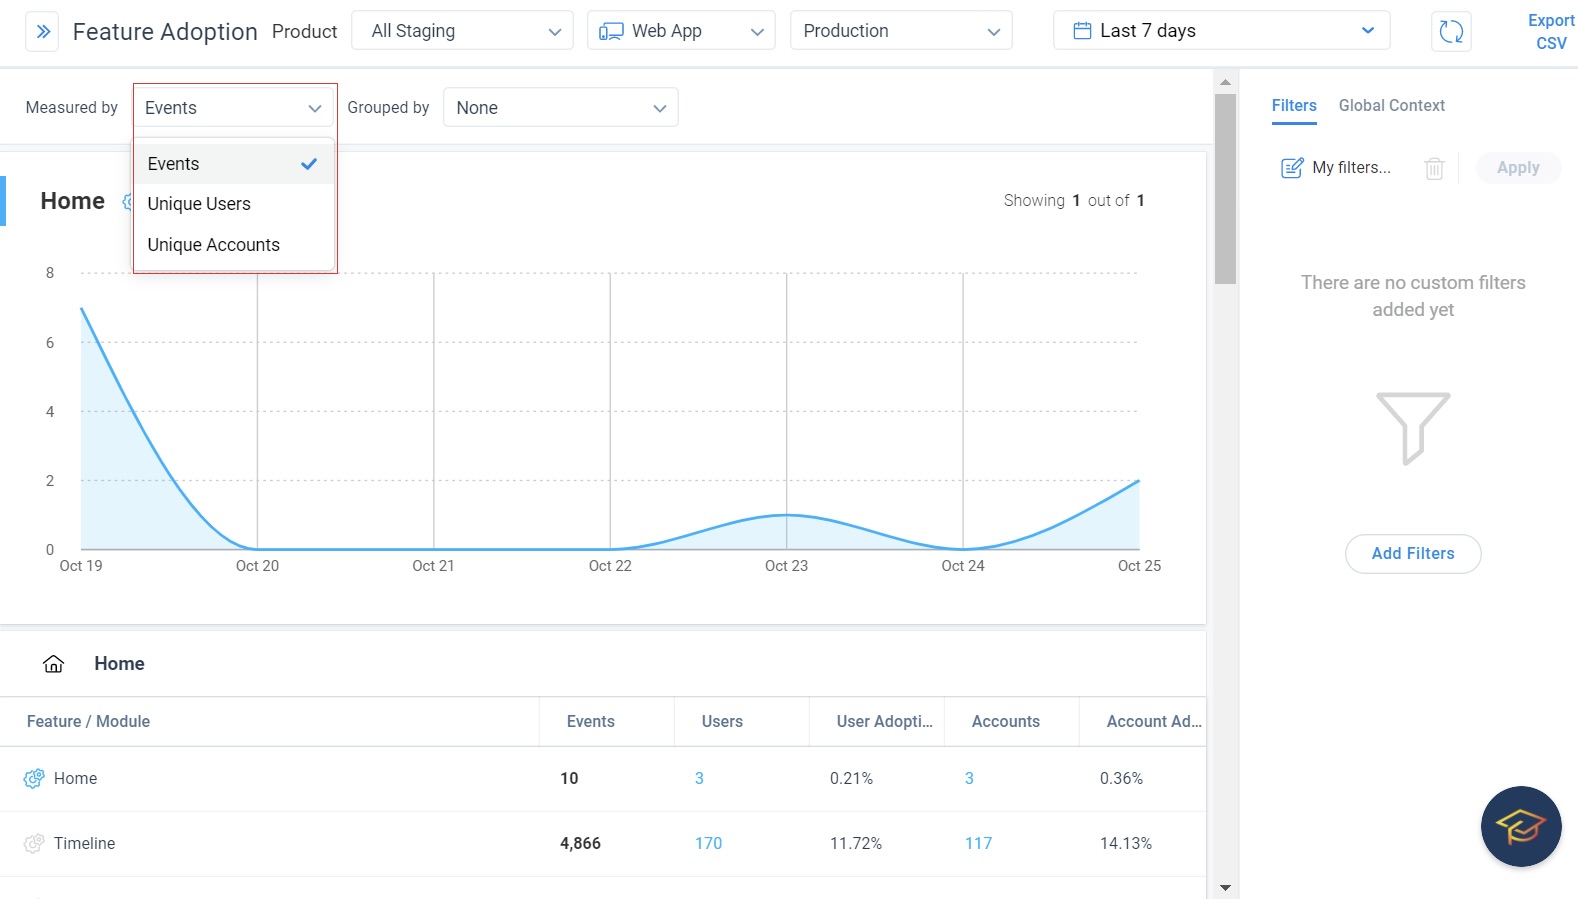
Measure Distinct Users and Accounts
Events will surface overall trends but measuring unique users and unique accounts will help you filter out the noise and surface more focused results
The Users and Accounts column displays the following:
- Users: Unique number of users that have accessed the module or feature.
- Accounts: Unique number of accounts of which users have accessed the module or feature.
Click the Users or Accounts column of a feature /module to view the following detailed metrics:
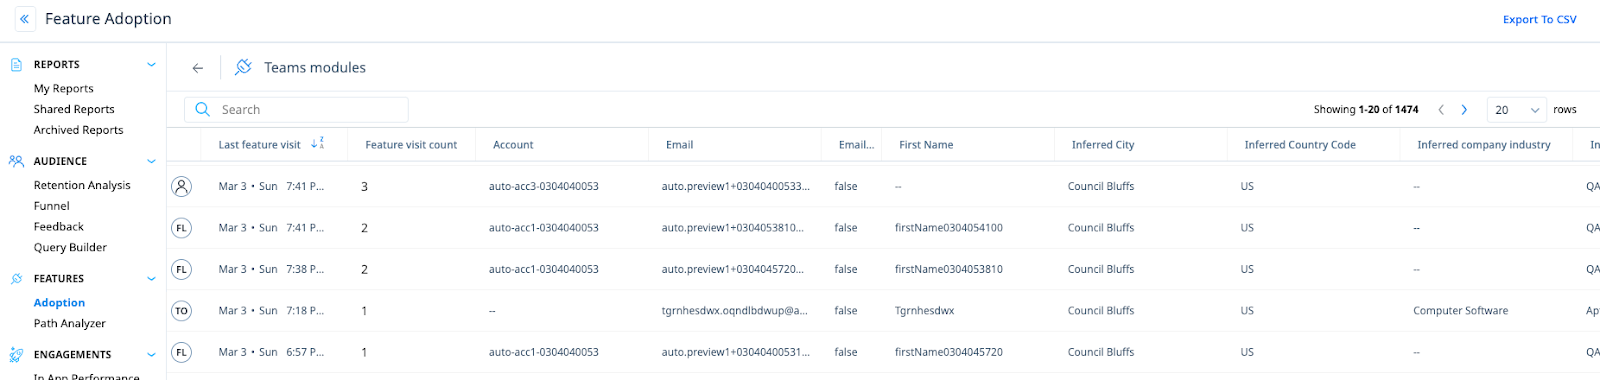
- Feature/Module Information:
- Last feature visit: Represents the most recent interaction with a feature by a user or account, recorded within a specified date range on a prior Feature Adoption report. This highlights the last usage instance of the feature or module.
- Feature visit count: Represents the total interactions with a feature/module, filtered by a selected date range. It aggregates the frequency of feature usage by users or accounts during that period. The Feature visit count metric is equivalent to the Events count from the Feature Adoption report.
- Standard User or Account Attributes: A list of standard user and account attributes that provide detailed information on each user/account that used the feature/module.
Group Adoption Report Data
To effectively analyze the adoption of features or modules from the product tree, you can further group the data based on criteria such as top accounts, locations, devices, features, and so on.
- In the Grouped by drop-down list, select the criteria by which you want to group the data.

- Click the Choose button.
- In the Choose slide-out panel, select the applicable items you want to group by.

- Click Apply.
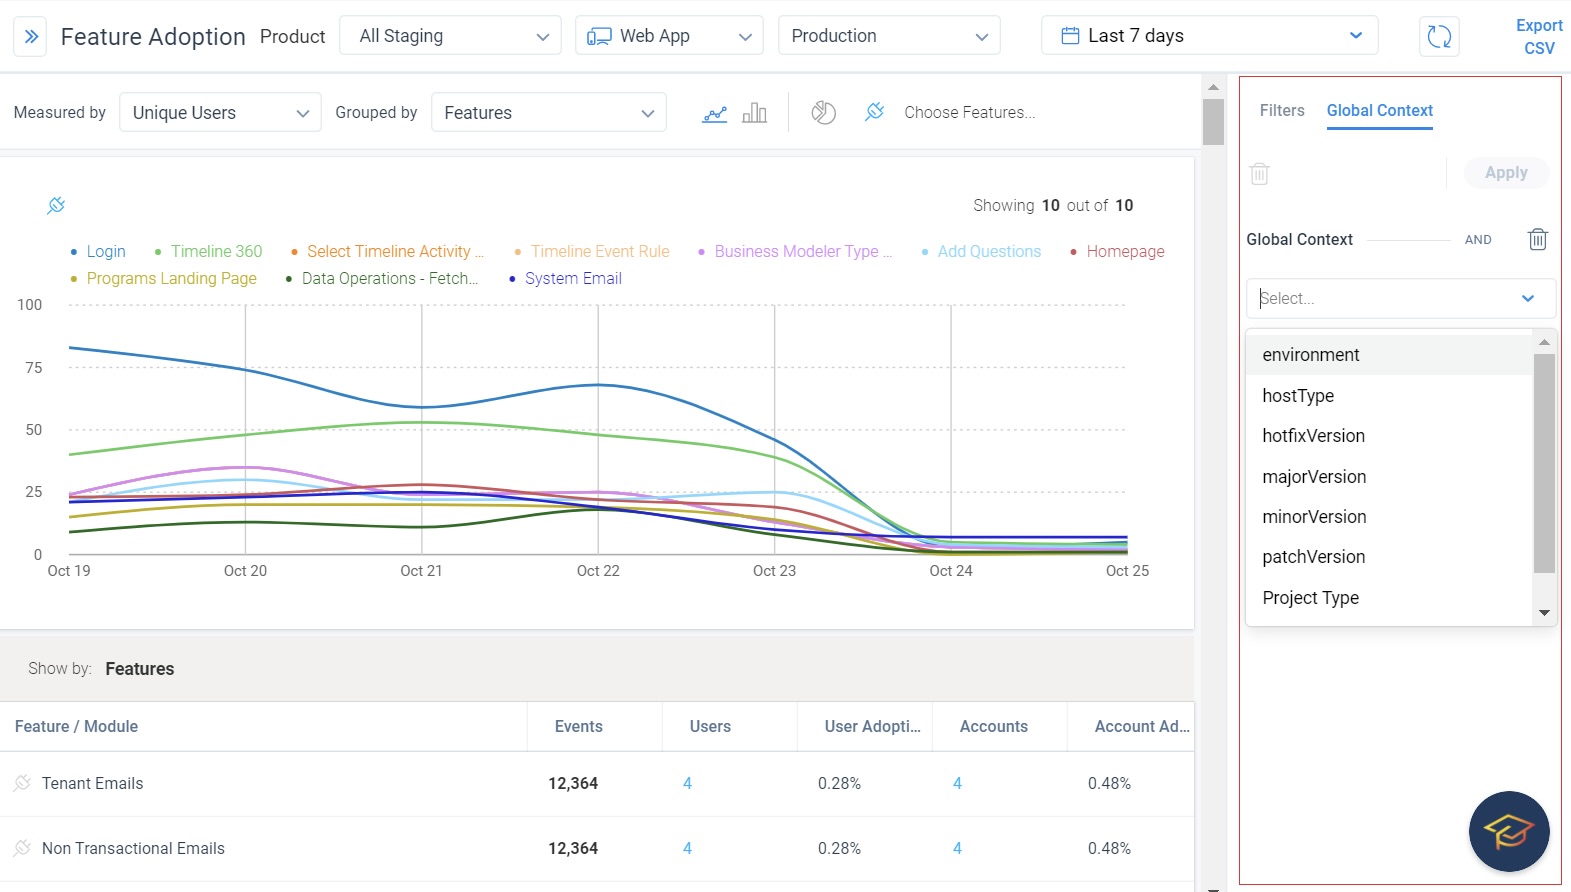
Use Global Context Rules as Filters
You can use the Global Context APIs as rules in the Adoption report. This enables you to easily access data from multiple Gainsight PX products in a single Adoption report. To use Global context APIs as filter rules, you must first set the Global context for the required event. You can use a Javascript API to set the Global Context. For more information about how to accomplish this, refer to Use Global Context API from the Additional Resources section.
Once you set the Global context for your events, the Global context rules are displayed under the Global Context tab of the Adoption report.
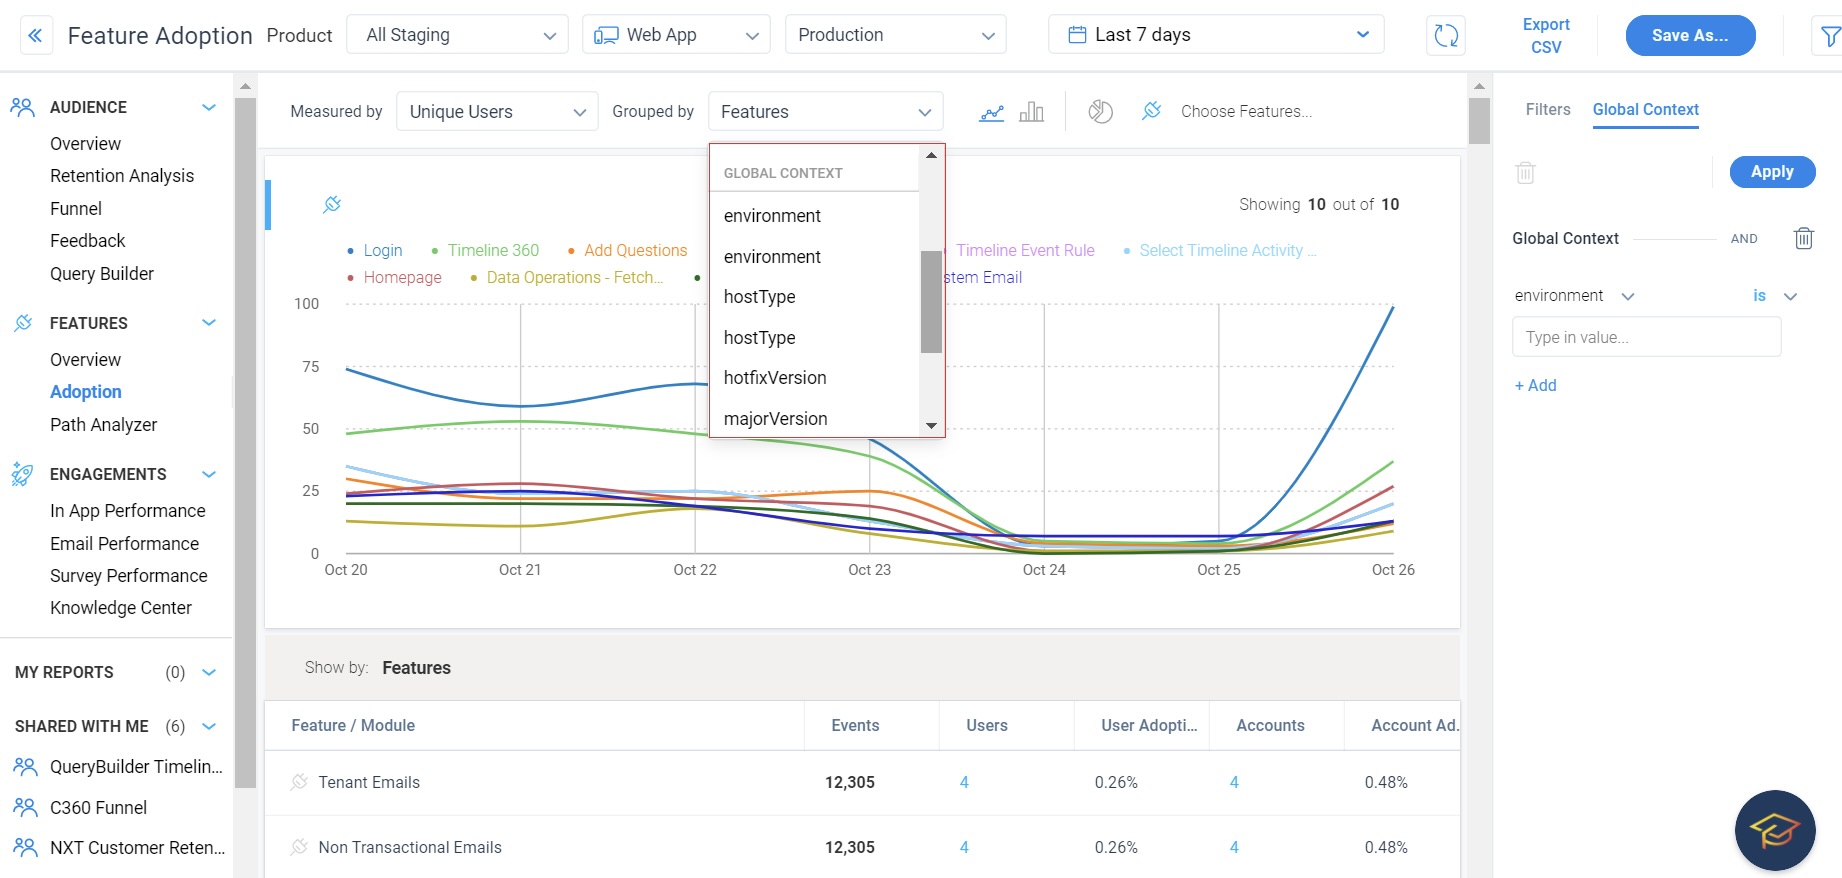
Apart from using the Global Context rules for filtering data, you can also use them to group your data, by selecting the required global context rule in the Grouped by drop-down menu. Global context rules are displayed under the Global Context section.
Business Use Case: Consider that you sell your product in three geographic locations, APAC, EMEA, and middle east. You have created three products in your Gainsight PX subscription, to track the sales in each of the three locations. On your Website, you have the Place Order button which the customer clicks while placing an order (the assumption is that number of clicks is equal to the number of sales). You have created events to track the number of times this button is clicked in all three products.
You can now set the global context and view the Sales in a particular geographical area, from any of your Gainsight PX product. You need not switch from one product to another. Also, you can use the Grouped by option to get a comparative report of sales in each of the three geographical locations.
To learn about all frequently asked questions, refer to the Analytics FAQs article from the Additional Resources section.
Additional Resources
| Use Global Context API |
| Analytics FAQs |