Net Retention Dashboard
Gainsight NXT
This article guides Customer Success Managers (CSMs) through the Net Retention Dashboard.
Overview
The Net Retention Dashboard is a pre-configured system dashboard available on the Dashboards page when the account-based forecasting is deployed in the tenant. The account-based forecasting model allows CSMs to forecast without opportunity data. This simplifies the adoption of Renewal Center for customers who cannot create or do not want to manage opportunities.
Example Business Use Cases:
- As a CSM user, you need to visualize the KPI metrics that are available in the account-based forecasting model. This dashboard provides all the financial metrics along with the CS metrics to help you make informed business decisions quicker.
- As an executive, you need to visualize account-based metrics of all CSMs in the organization to check the overall organization's performance.
Prerequisites
The Net Retention Dashboard is only available for tenants who have purchased Renewal Center as an add-on.
Net Retention Dashboard
The Net Retention Dashboard is a system-generated dashboard that shows data when the admin activates the Company View from the Renewal Center admin page. This dashboard contains a set of metrics, charts, and graphs that are populated with the data available in the GS Company Forecast object. This is a system-generated dashboard, hence you cannot make changes in it.
This dashboard brings the following key benefits:
- Acts as a one-stop location for CSMs and executives to make informed business decisions.
- Visualizes all risks and opportunities on a page.
- Provides an overview to executives of the team’s performance on their book of business.
This dashboard is added to the drop-down list on the Dashboards page after the admin turns on the Show Company View toggle switch. The toggle switch is available in Administration > Renewal Center > Company View. For more information on how the admin can configure the account based forecasting model, refer to the Configure Account Based Forecasting (Company View) article.

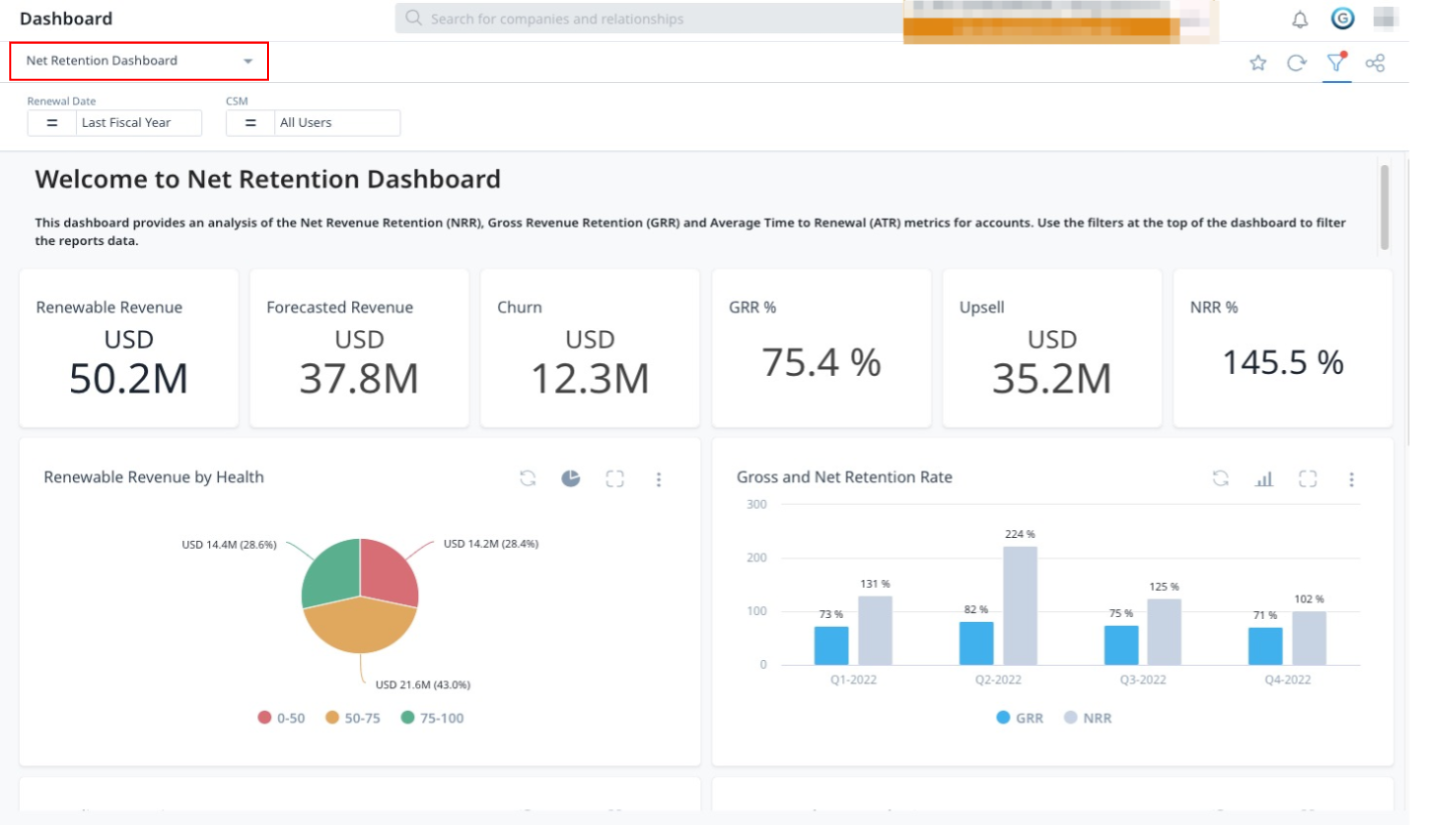
The following KPI metrics are available in this dashboard:
- Renewable Revenue (ARR): The Annual Renewable Revenue (ARR) provides an overview of your book of business.
- Churn: The amount that is lost from your book of business. The churn amount is calculated through snapshotting of the ARR value. If ARR is decreasing, then the churn value increases.
- Forecasted Revenue: An overview of your book of business after considering churn. If there is no churn, then the forecasted revenue is equal to the renewable revenue.
- GRR% (Gross Revenue Retention): It shows the percentage of business retained from your book of business. This value cannot be more than 100 percent.
- Formula Used: Sum(Forecasted Revenue) / Sum(Renewable Revenue) * 100
- Upsell: It shows the amount that is added to your book of business as an expansion. The upsell amount is calculated through snapshotting of the ARR value. If ARR is increasing, then the upsell value also increases.
- NRR% (Net Revenue Retention): It shows the percentage of business including upsell from your book of business. This value can be more than 100 percent.
- Formula Used: [Sum(Forecasted Revenue)+Sum(Upsell)] / Sum(Renewable Revenue) * 100

The following charts and graphs are available in this dashboard:
- Renewable Revenue by Health: This report shows the ARR value categorized by the overall health score. It helps you to determine the level of risk associated with the upcoming renewals. You can further click on each health score category to view the list of accounts that are falling under it.
- Gross and Net Retention Rate: This report shows the comparison between the retention (GRR%) and expansion (NRR%) values. It helps you to determine the churn and upsell portion in ARR for the selected time period. You can also compare the retention and expansion values trend over the quarters.

- Trending Retention Rate: This report shows the retention rate categorized by the renewal type, that is Renewal and Anniversary. It helps you to determine and compare the retention of accounts with one-year and multi-year deals.
- Renewal: It includes the renewal that renews in the same year.
- Anniversary: It includes the renewal that will renew in the upcoming years, that is the multi-year deals.
- Forecasted Revenue by Outcome: This report shows the forecasted revenue categorized by the opportunity stages. It helps you to determine which accounts are in the open or lost stages, or whether the accounts that are won require any support.

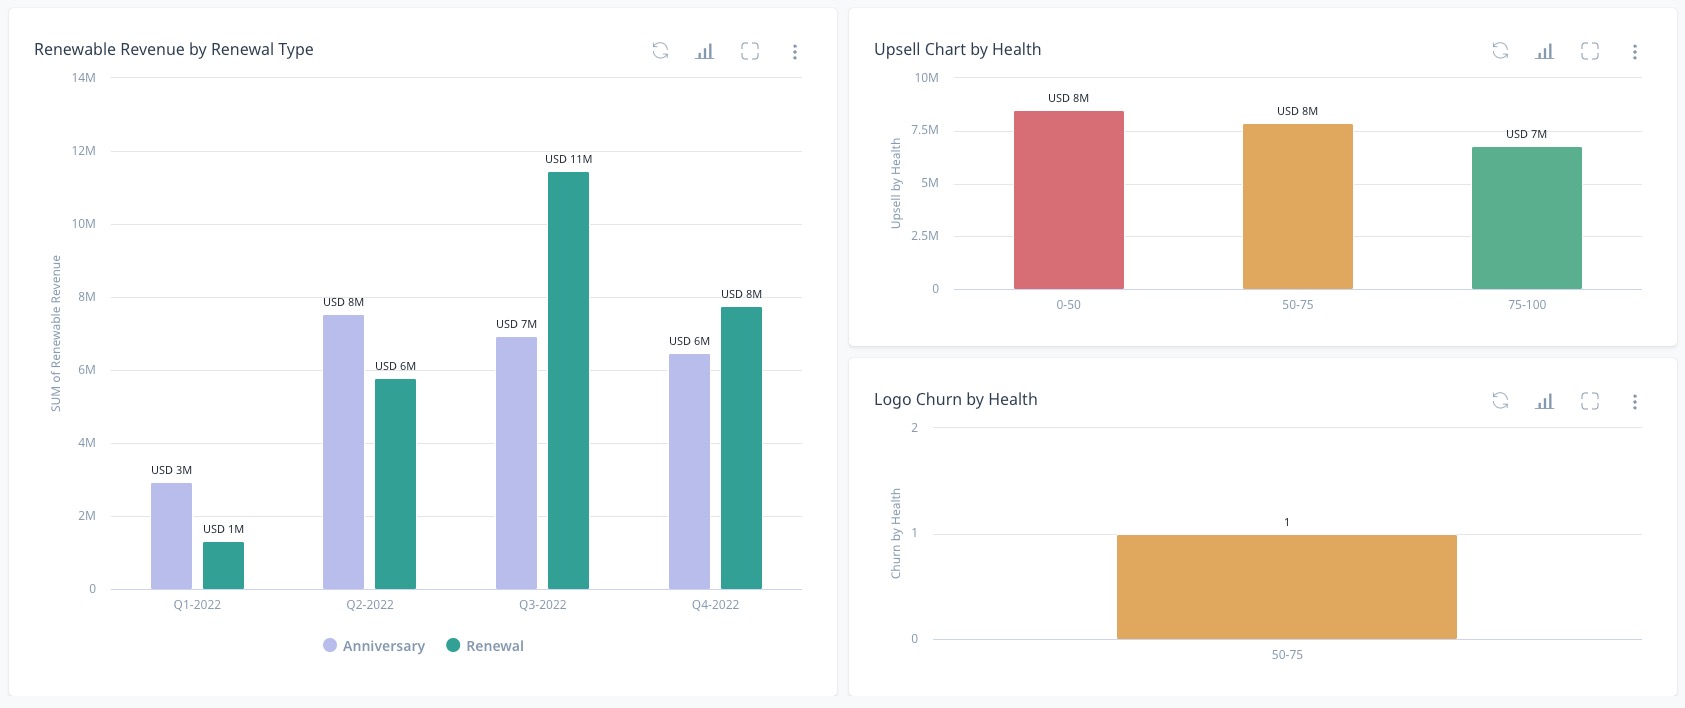
- Renewable Revenue by Revenue Type: This report shows the ARR value categorized by the renewal type, that is Renewal and Anniversary. It helps you to recognize accounts that are inclined towards multi-year deals as compared to one-year deals, and vice versa.
- Logo Churn by Health: This report categorizes the full churn accounts by their overall health score. It helps you to determine the reason behind the churn by viewing the health score of the account.
- Upsell Chart by Health: This report categorizes the upsell accounts on the overall health score. It helps you to view the health scores of accounts with expansion.
