Simple Program Analytics
Gainsight NXT
This article explains the Simple Program Analytics tab.
Overview
The Simple Program Analytics enables you to monitor the participants actions with your program emails and in-app engagements. The Analytics allows you to view the corresponding participants list by clicking on the available metrics on the Simple Program Analytics Dashboard.
Note: The Simple Program Analytics tab will appear once the program is Published and have either Active, Paused or Stopped status.
The Analytics tab has following three sections:
Dashboard
The Dashboard has the following sections:
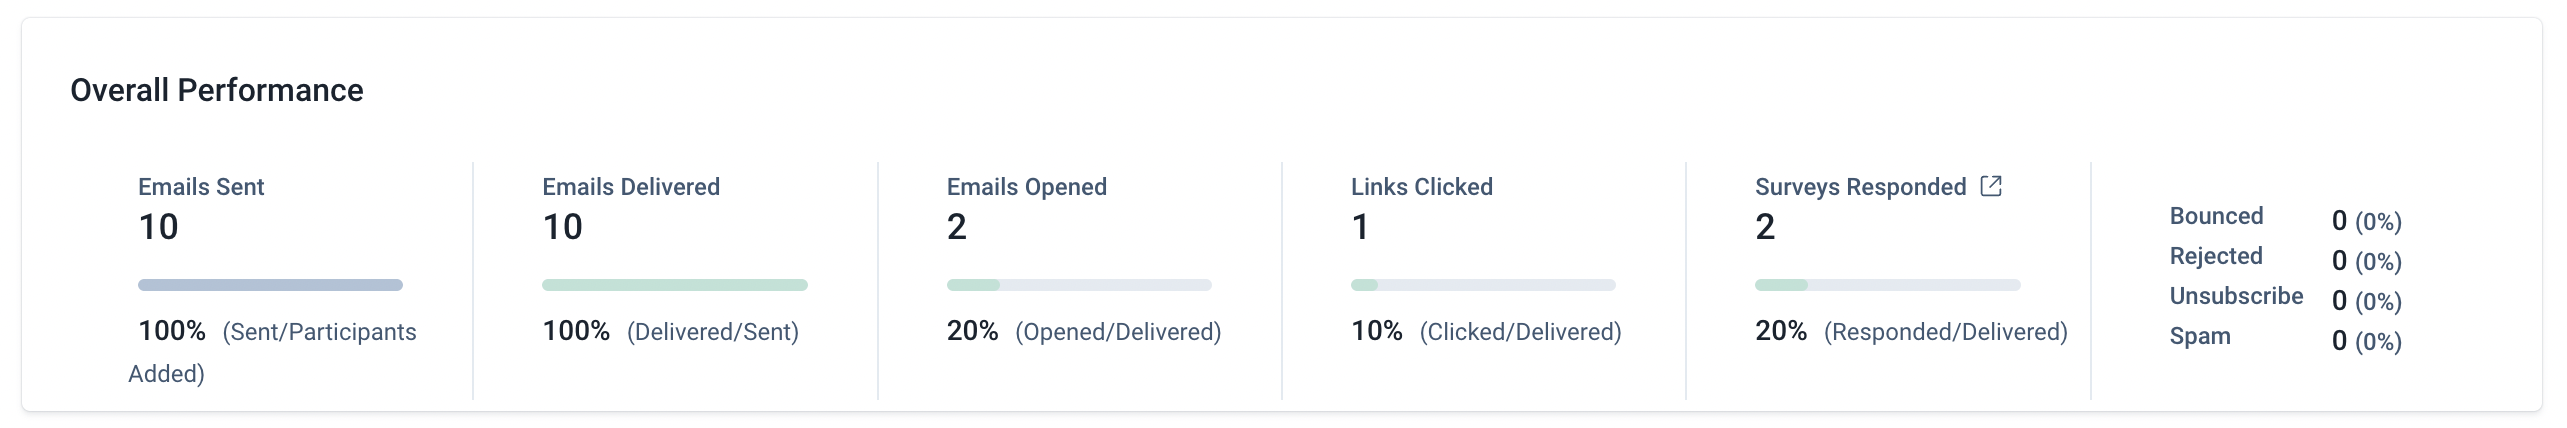
- Overall Performance
- Survey Stats
- Email Stats
- Emails
- Add Filter
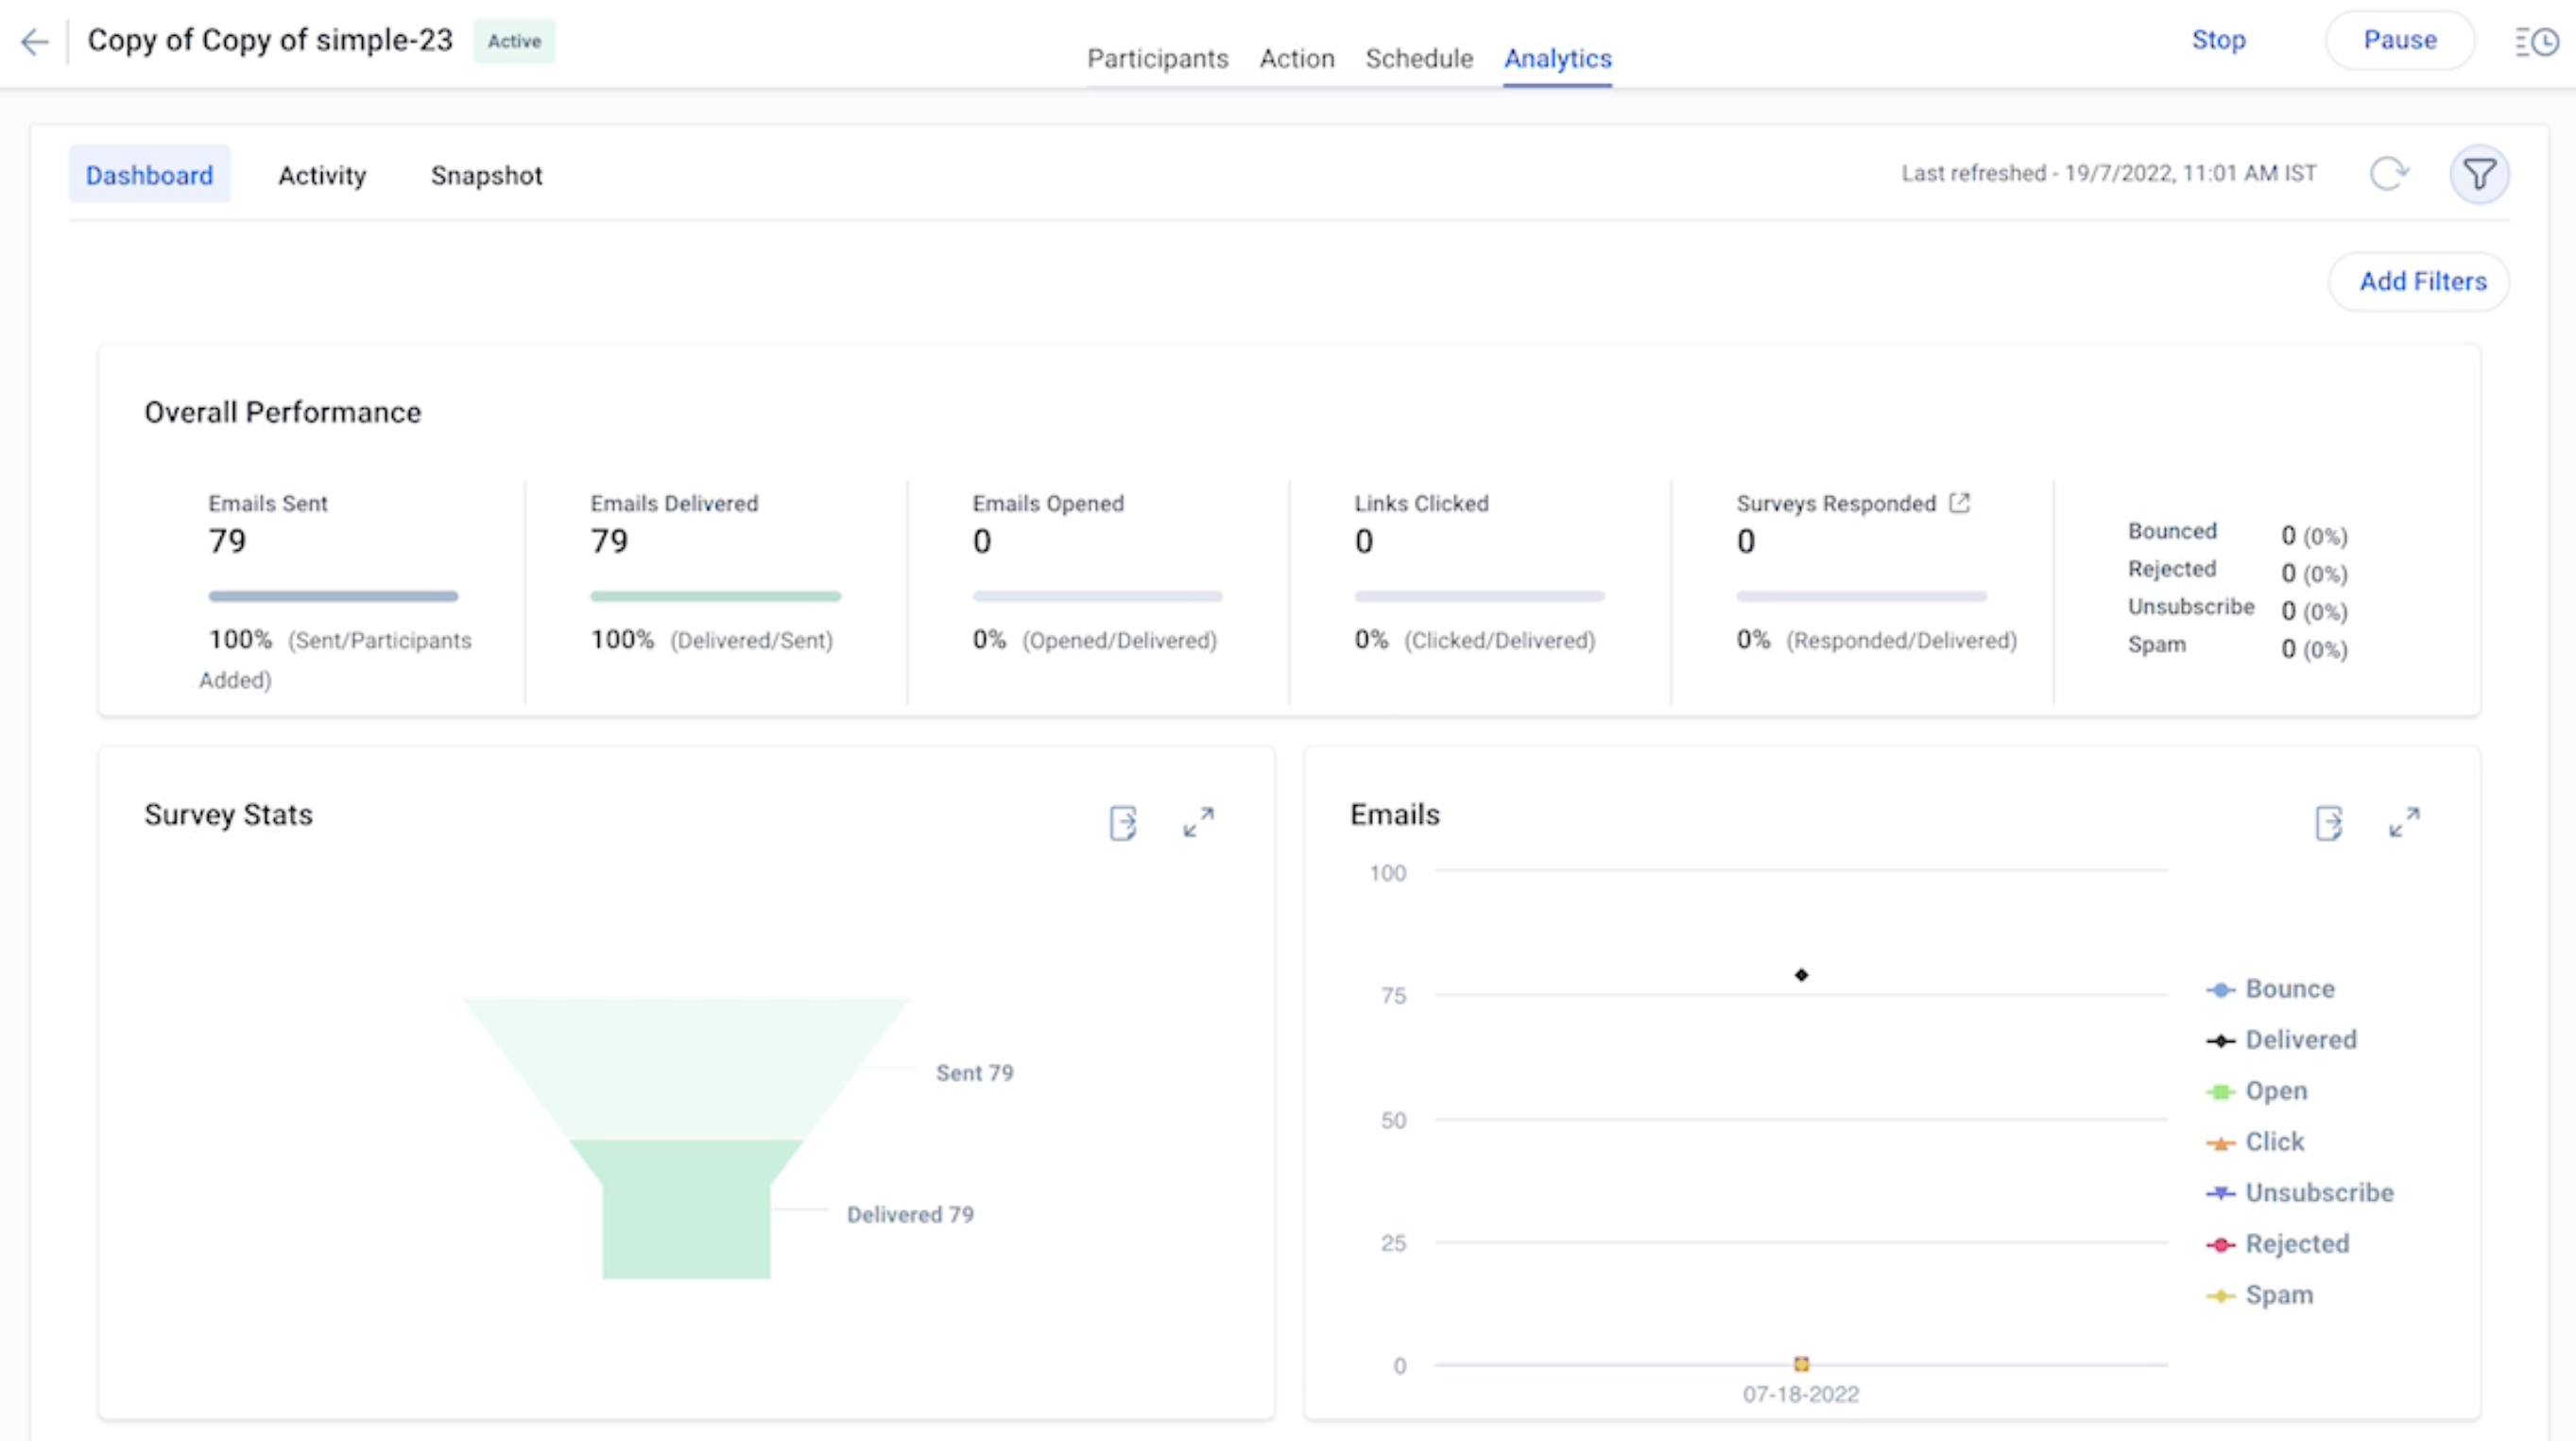
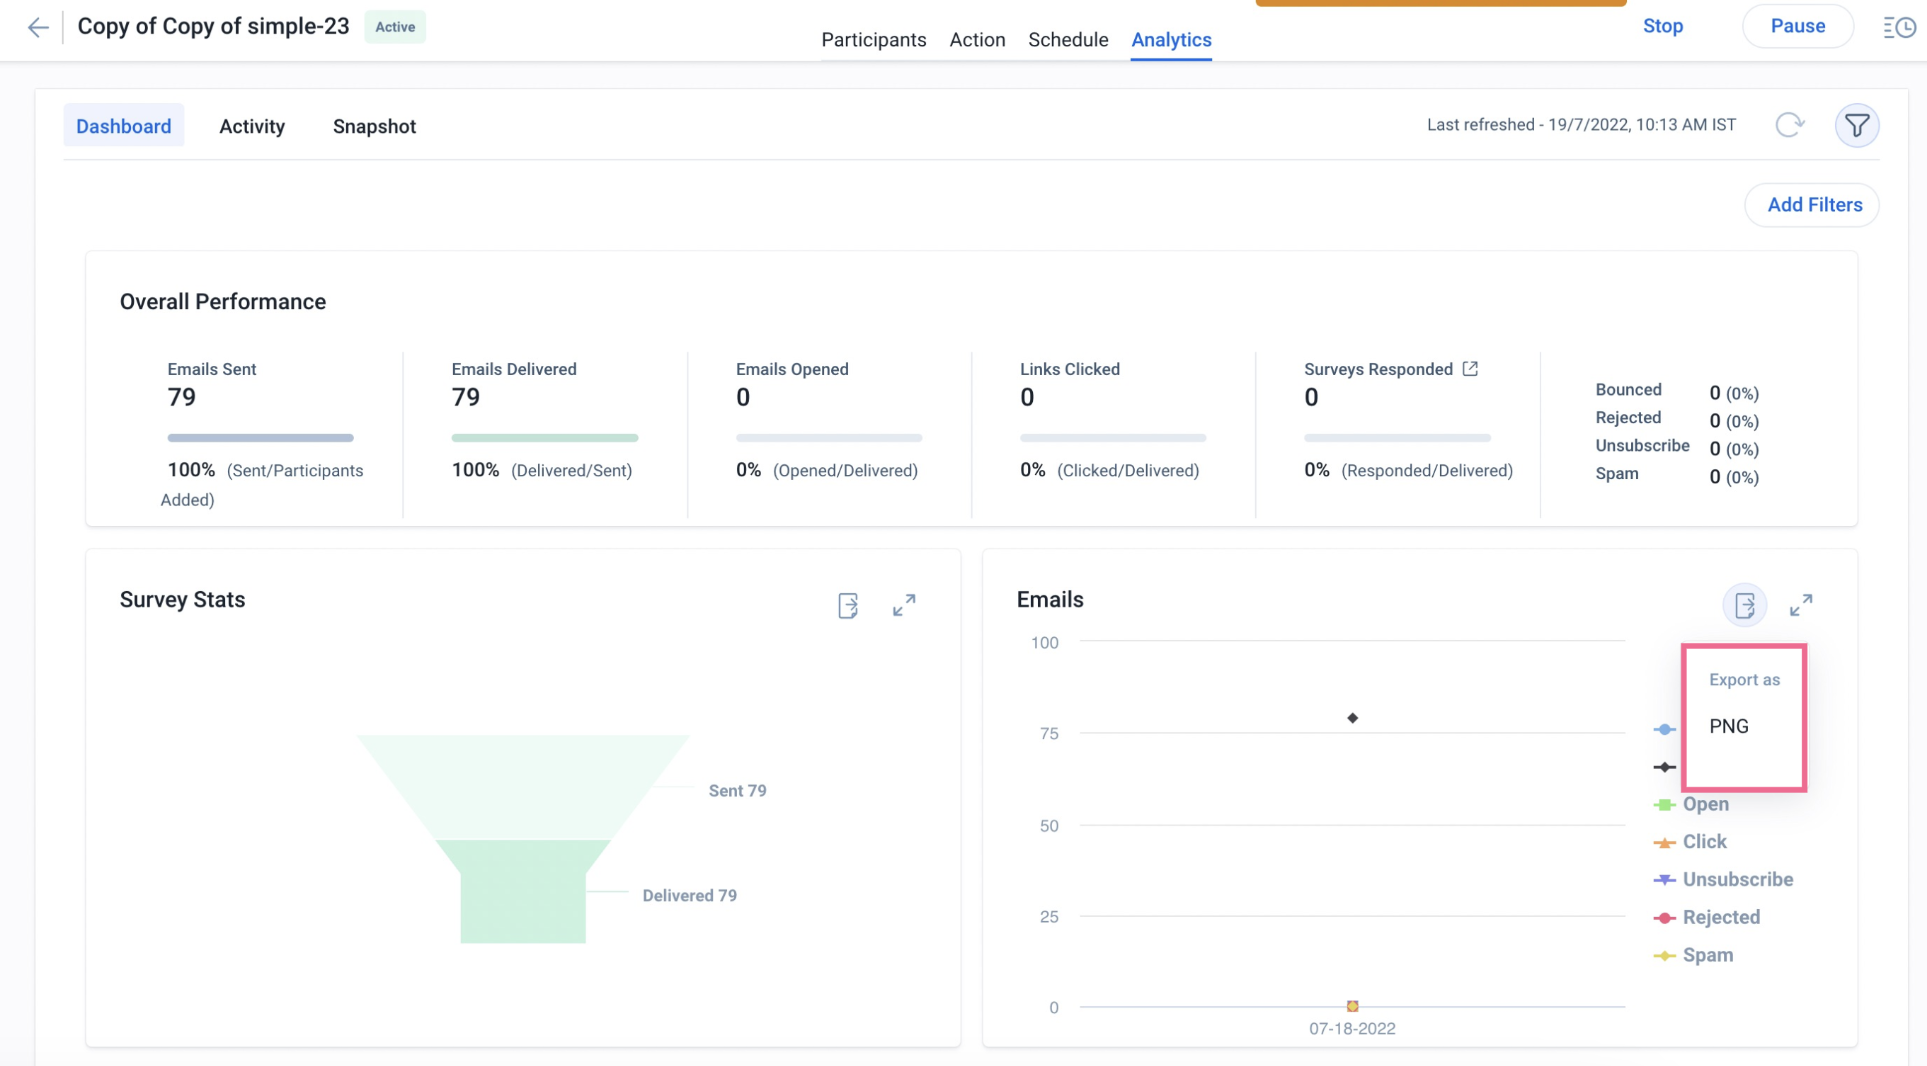
Overall Performance
The Overall Performance section displays the performance of a selected simple program in general. You can analyze the performance based on the following parameters:
- Emails Sent: Displays the total number (and percentage) of emails sent to the participants (or total number of participants added to the simple program).
- Emails Delivered: Displays the total number (and percentage) of emails delivered to the participant’s inboxes out of the total number of emails sent.
- Emails Opened: Displays the total number (and percentage) of emails opened by the participants out of the number of emails delivered.
- Links Clicked: Displays the total number (and percentage) of email links clicked by the participants.
- Survey Responded: Displays the total number (and percentage) of participants who have submitted the survey.
- Bounced: Displays the total number (and percentage) of emails that are not delivered to the participants.
- Rejected: Displays the total number (and percentage) of emails that are rejected by the email service provider due to invalid email addresses of participants.
- Unsubscribe: Displays the total number (and percentage) of participants who clicked the unsubscribe link to opt-out of your email.
- Spam: Displays the total number (and percentage) of participants who have reported the emails as spam.
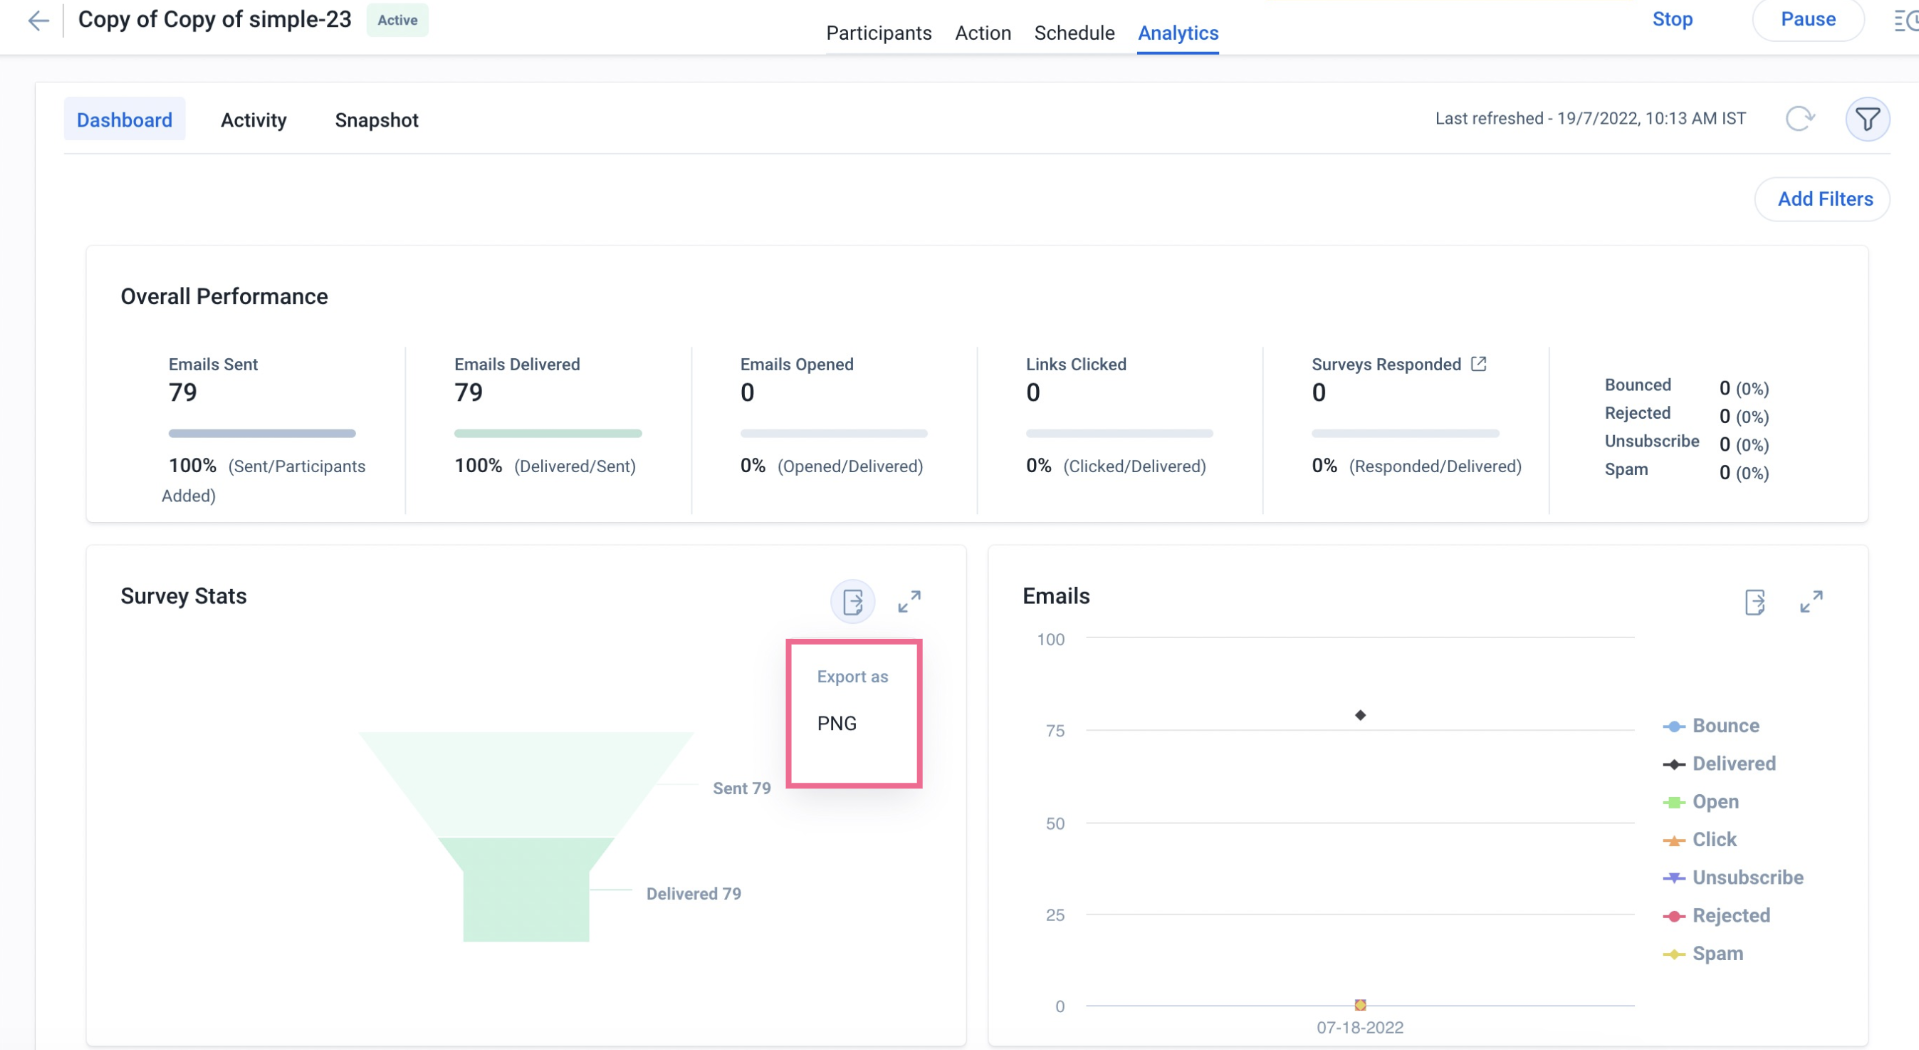
Survey Stats
The Survey Stats section displays the statistics of survey emails sent to the participants in a funnel view. You can download the graph details in PNG by hovering on the Export as icon and selecting the PNG option.
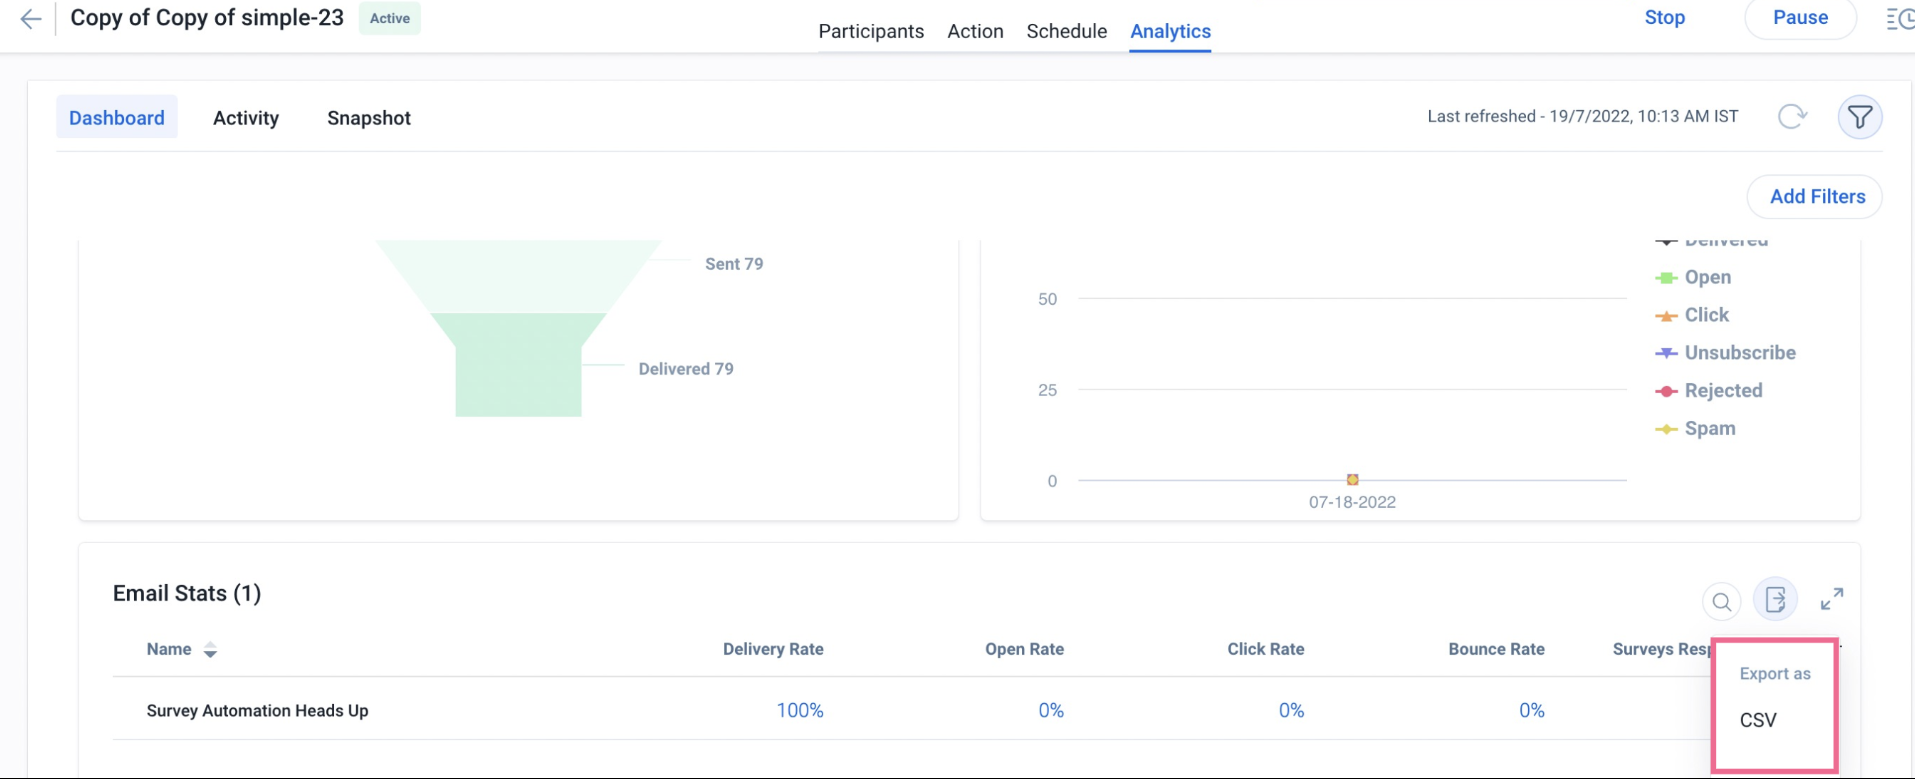
Email Stats
The Email Stats section displays the statistics of emails sent to the participants in a tabular view. You can download the details in CSV by hovering on the Export as icon and selecting the CSV option.
Note: You can also search the information by clicking the Search icon and entering the email name.
Emails
The Emails section displays the graphical representation of an email's lifecycle. You can click on any email status(Bounce, Delivered, Open, Click, Unsubscribe, Rejected, Spam) to have a specific graph for it. You can download the graph details by hovering on the Export as icon and selecting the PNG option.
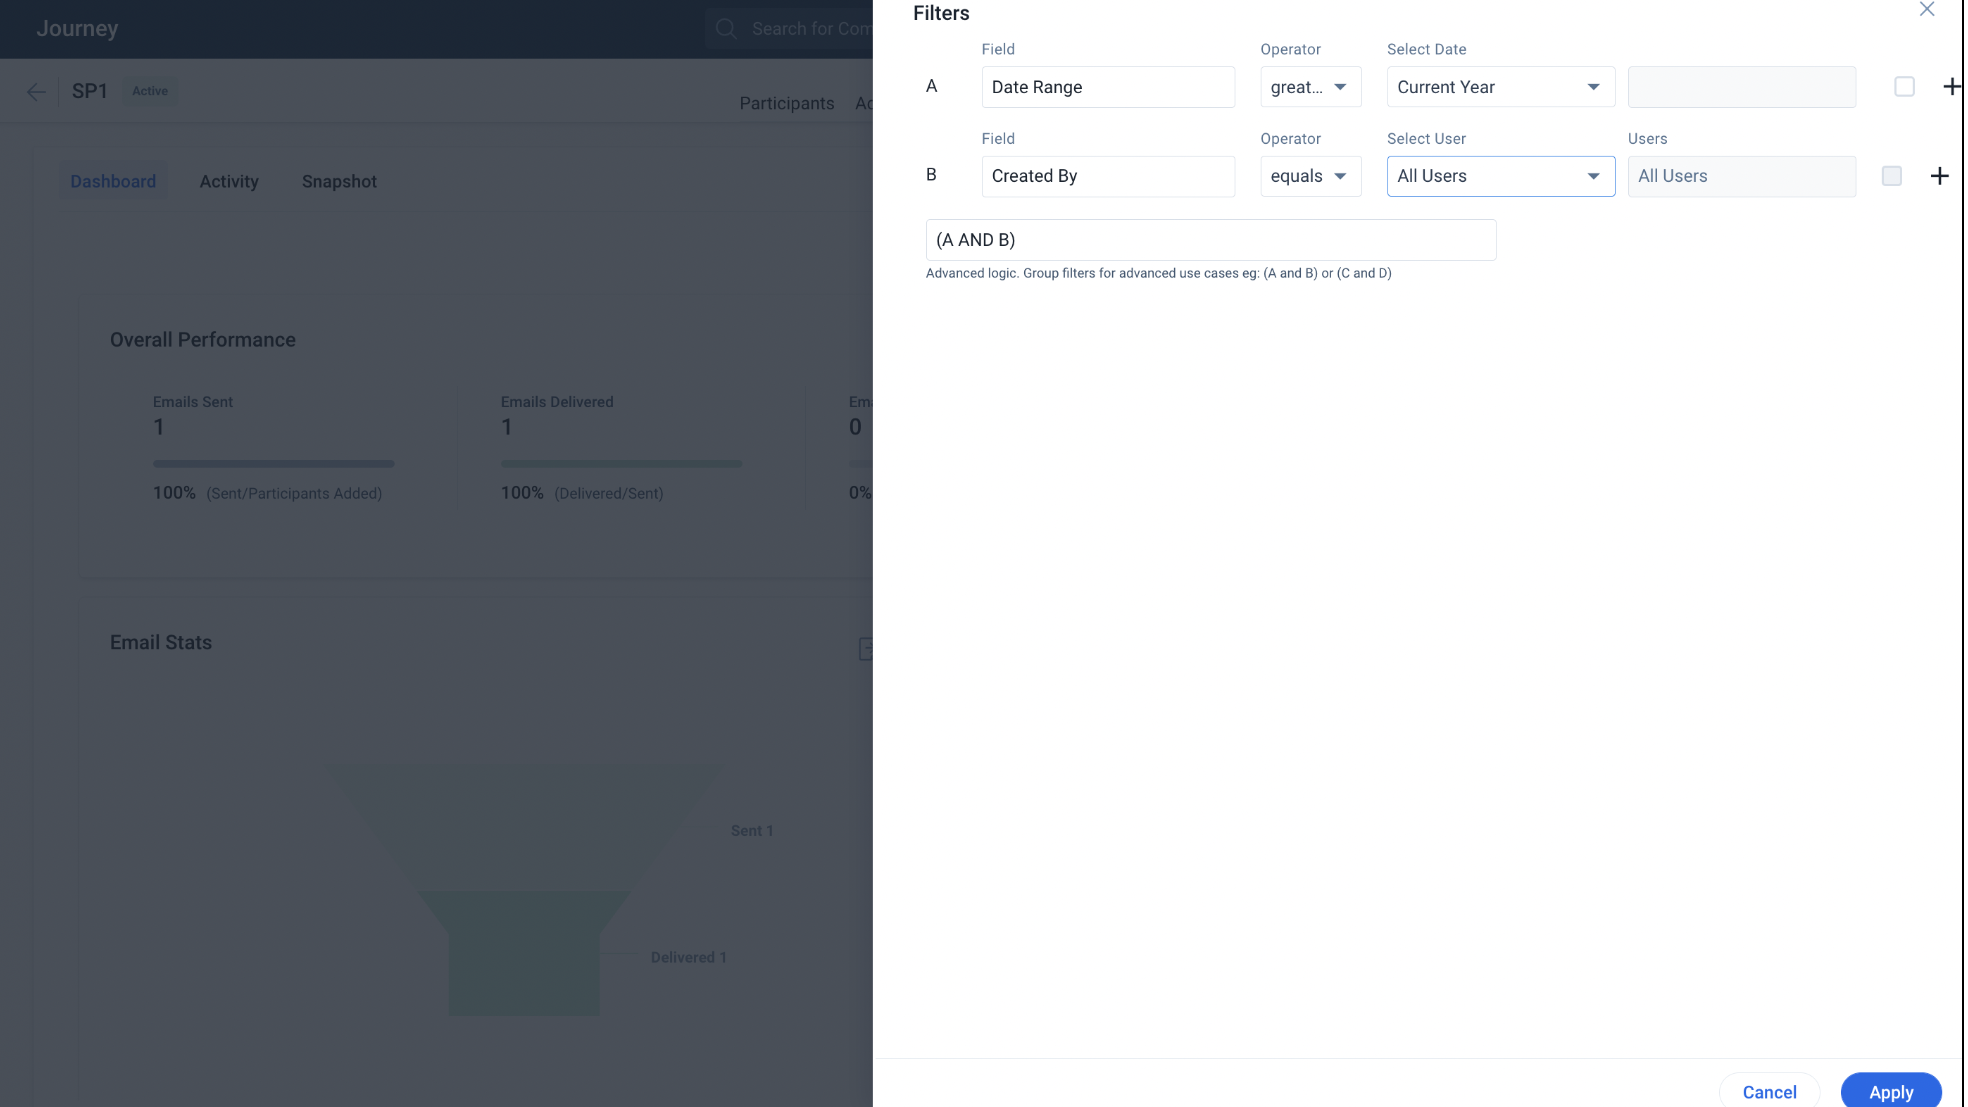
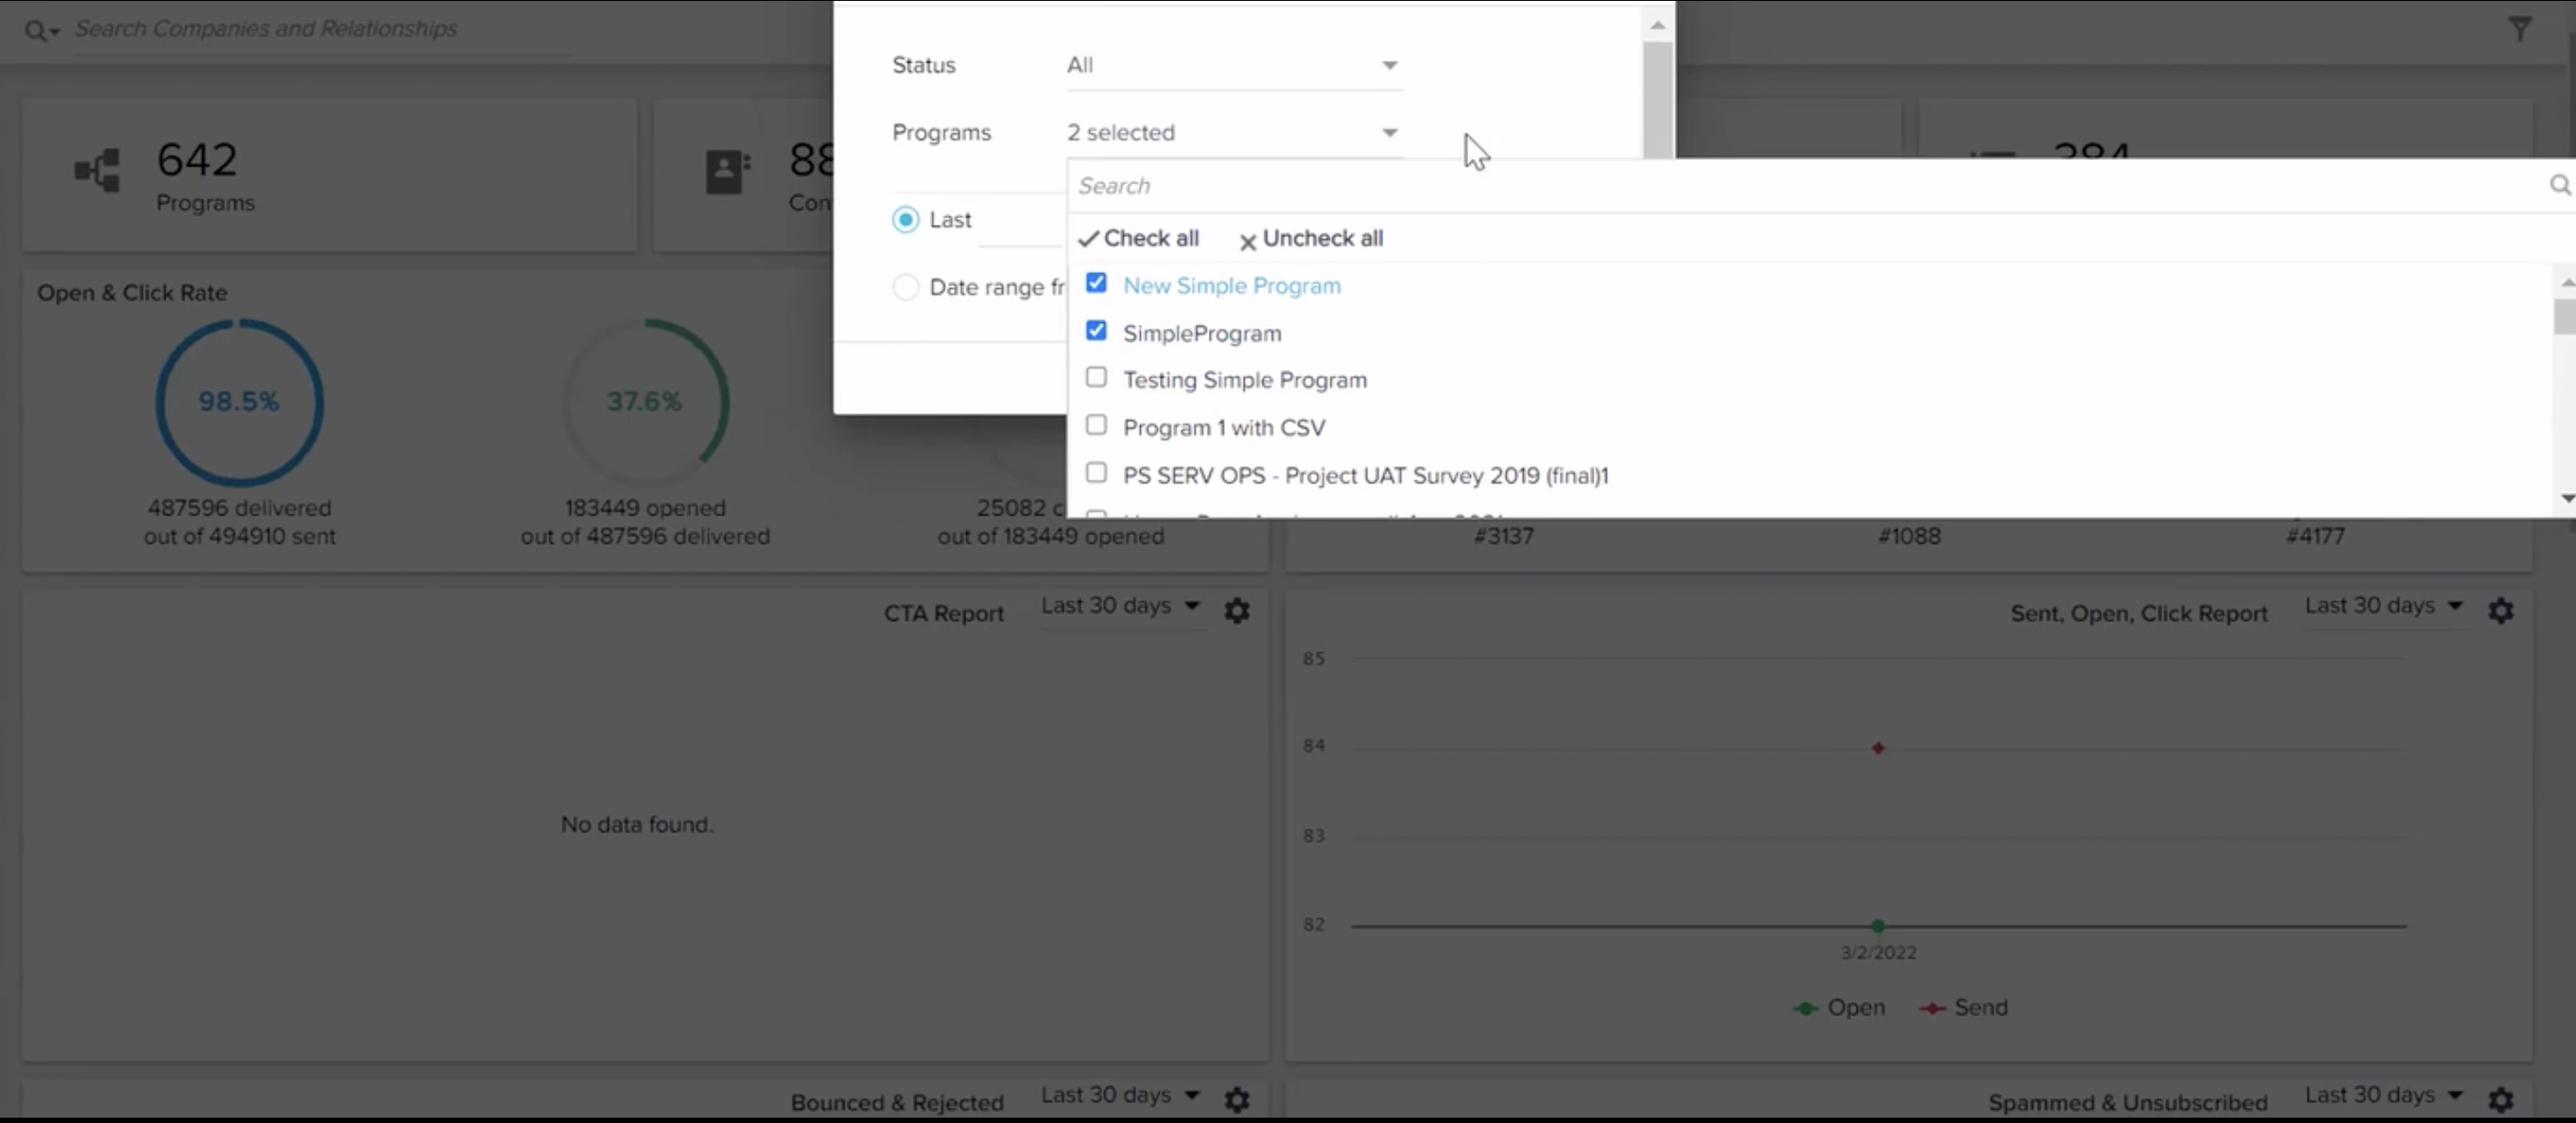
Add Filters
You can use the filters to filter the data on the Dashboard widgets page.
To add filters:
- Navigate to Programs > Active Simple Programs > Analytics > Dashboard.
- Click Add Filters. The Filters slide-out panel appears.
- Click Add Filter, the filters field appears.
- In the Filters window, specify the filter criteria. Perform the following sub-steps:
- Select Field.
- Select the Operator and specify appropriate Value.
- Select the check box of the Value option to include null values.
- (Optional) Click + to add a new filter condition.
- In the Advanced logic field, specify the logic to group the filter conditions. For example, (A AND B) OR (C AND D).
Note: Verify the logic for grouping the filter conditions to avoid errors while loading widgets.
7. Click Apply. The widget data on the Dashboard is filtered based on the applied filters.
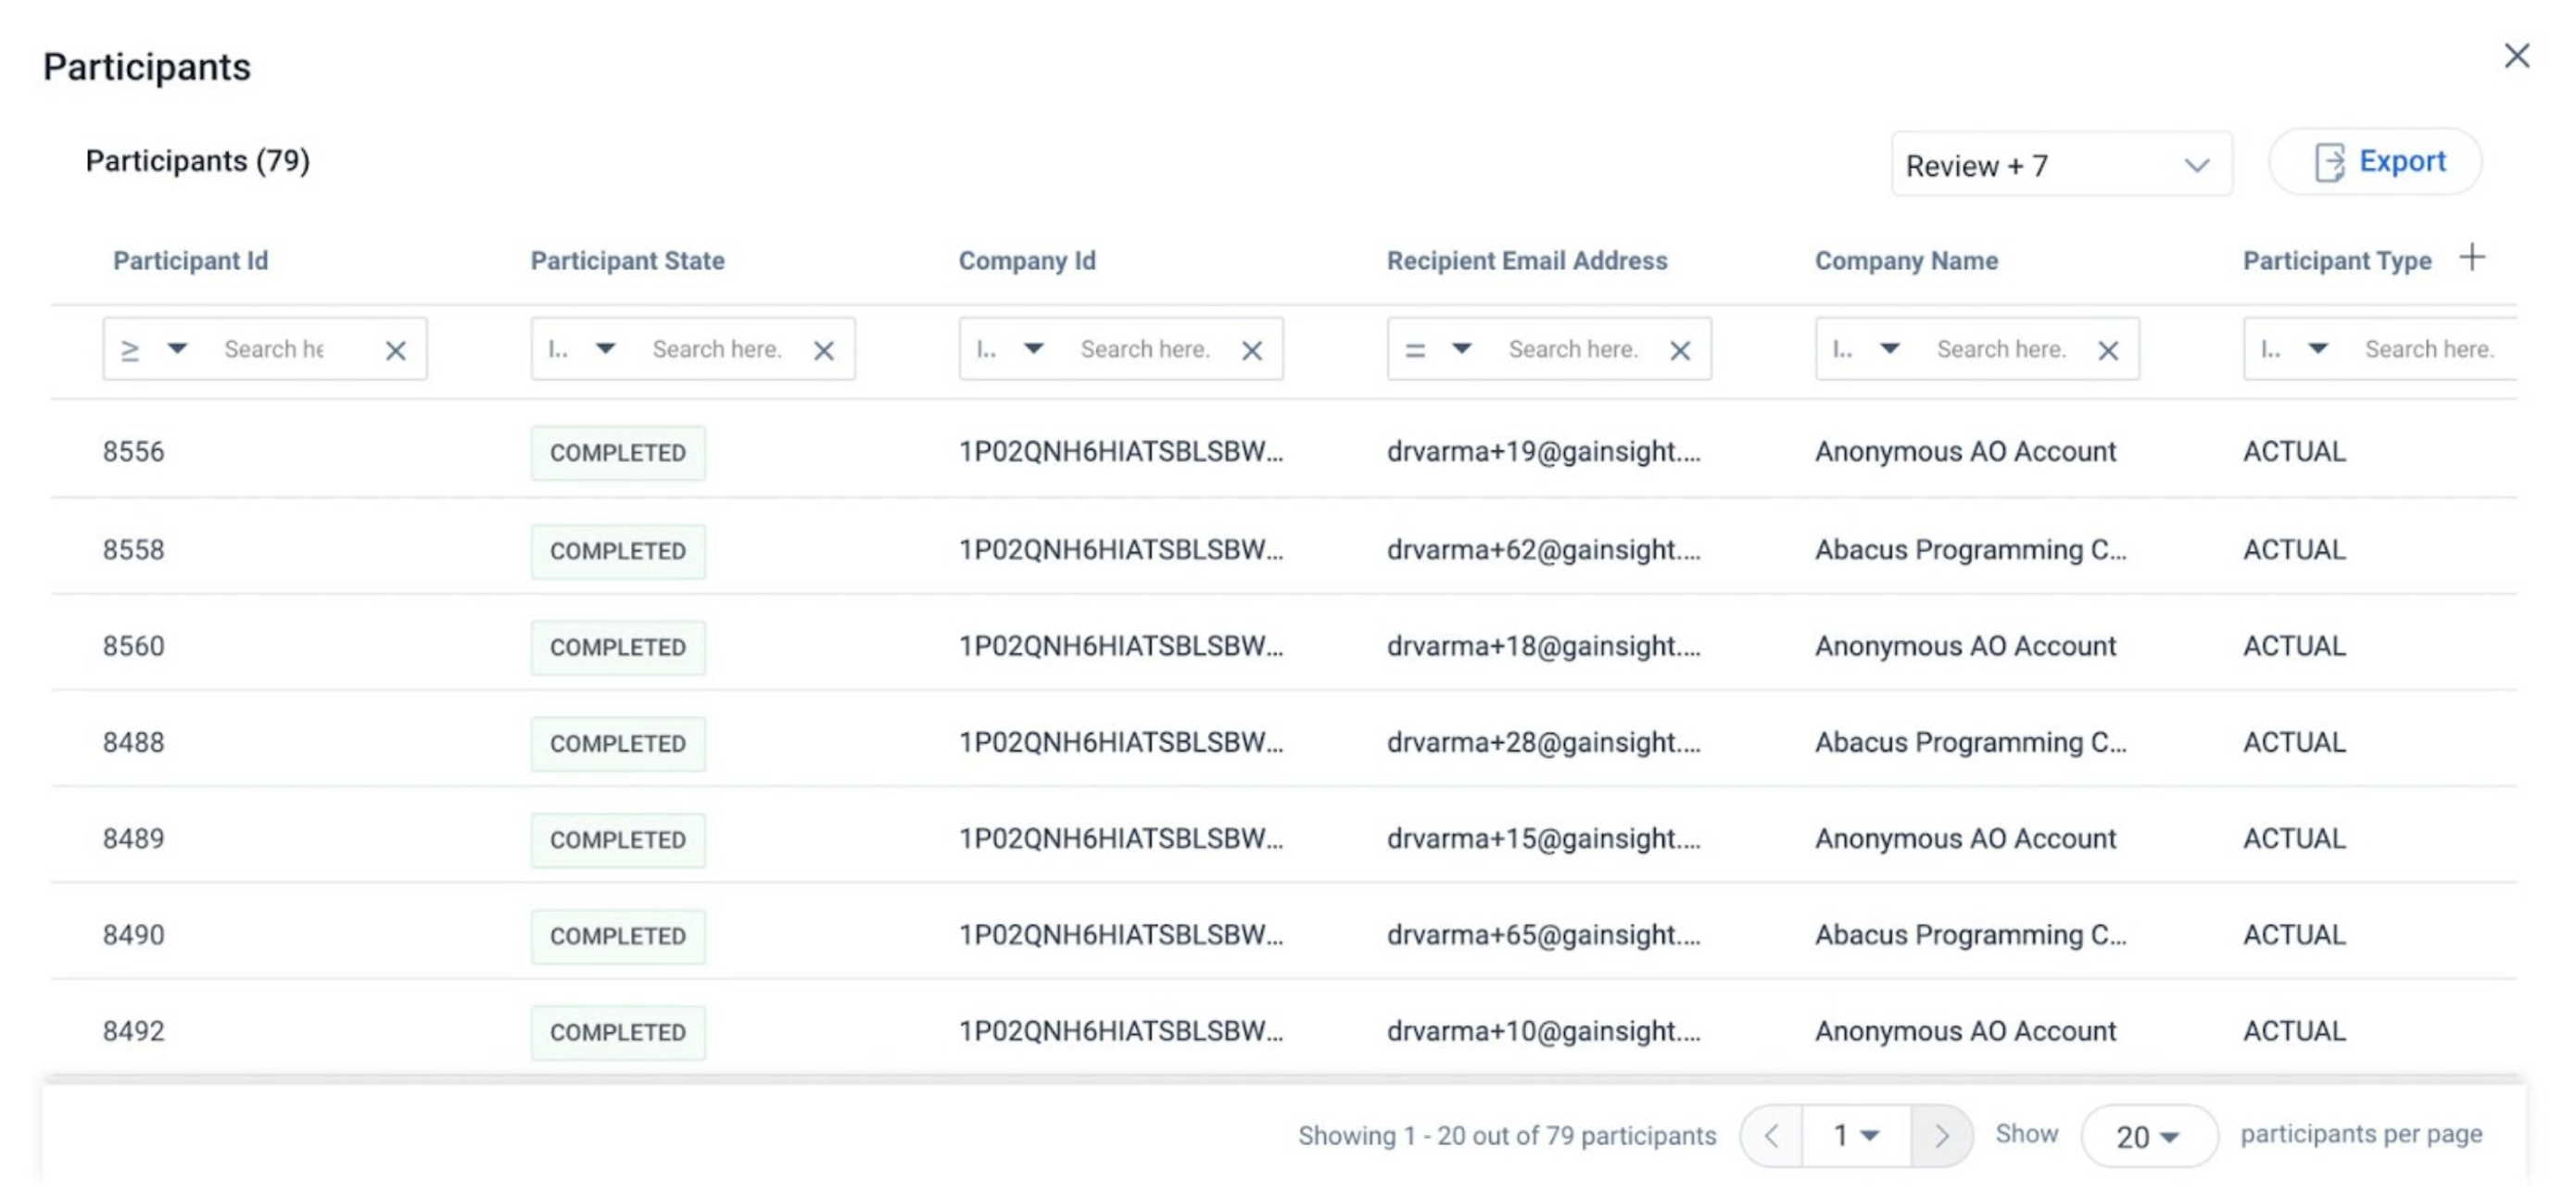
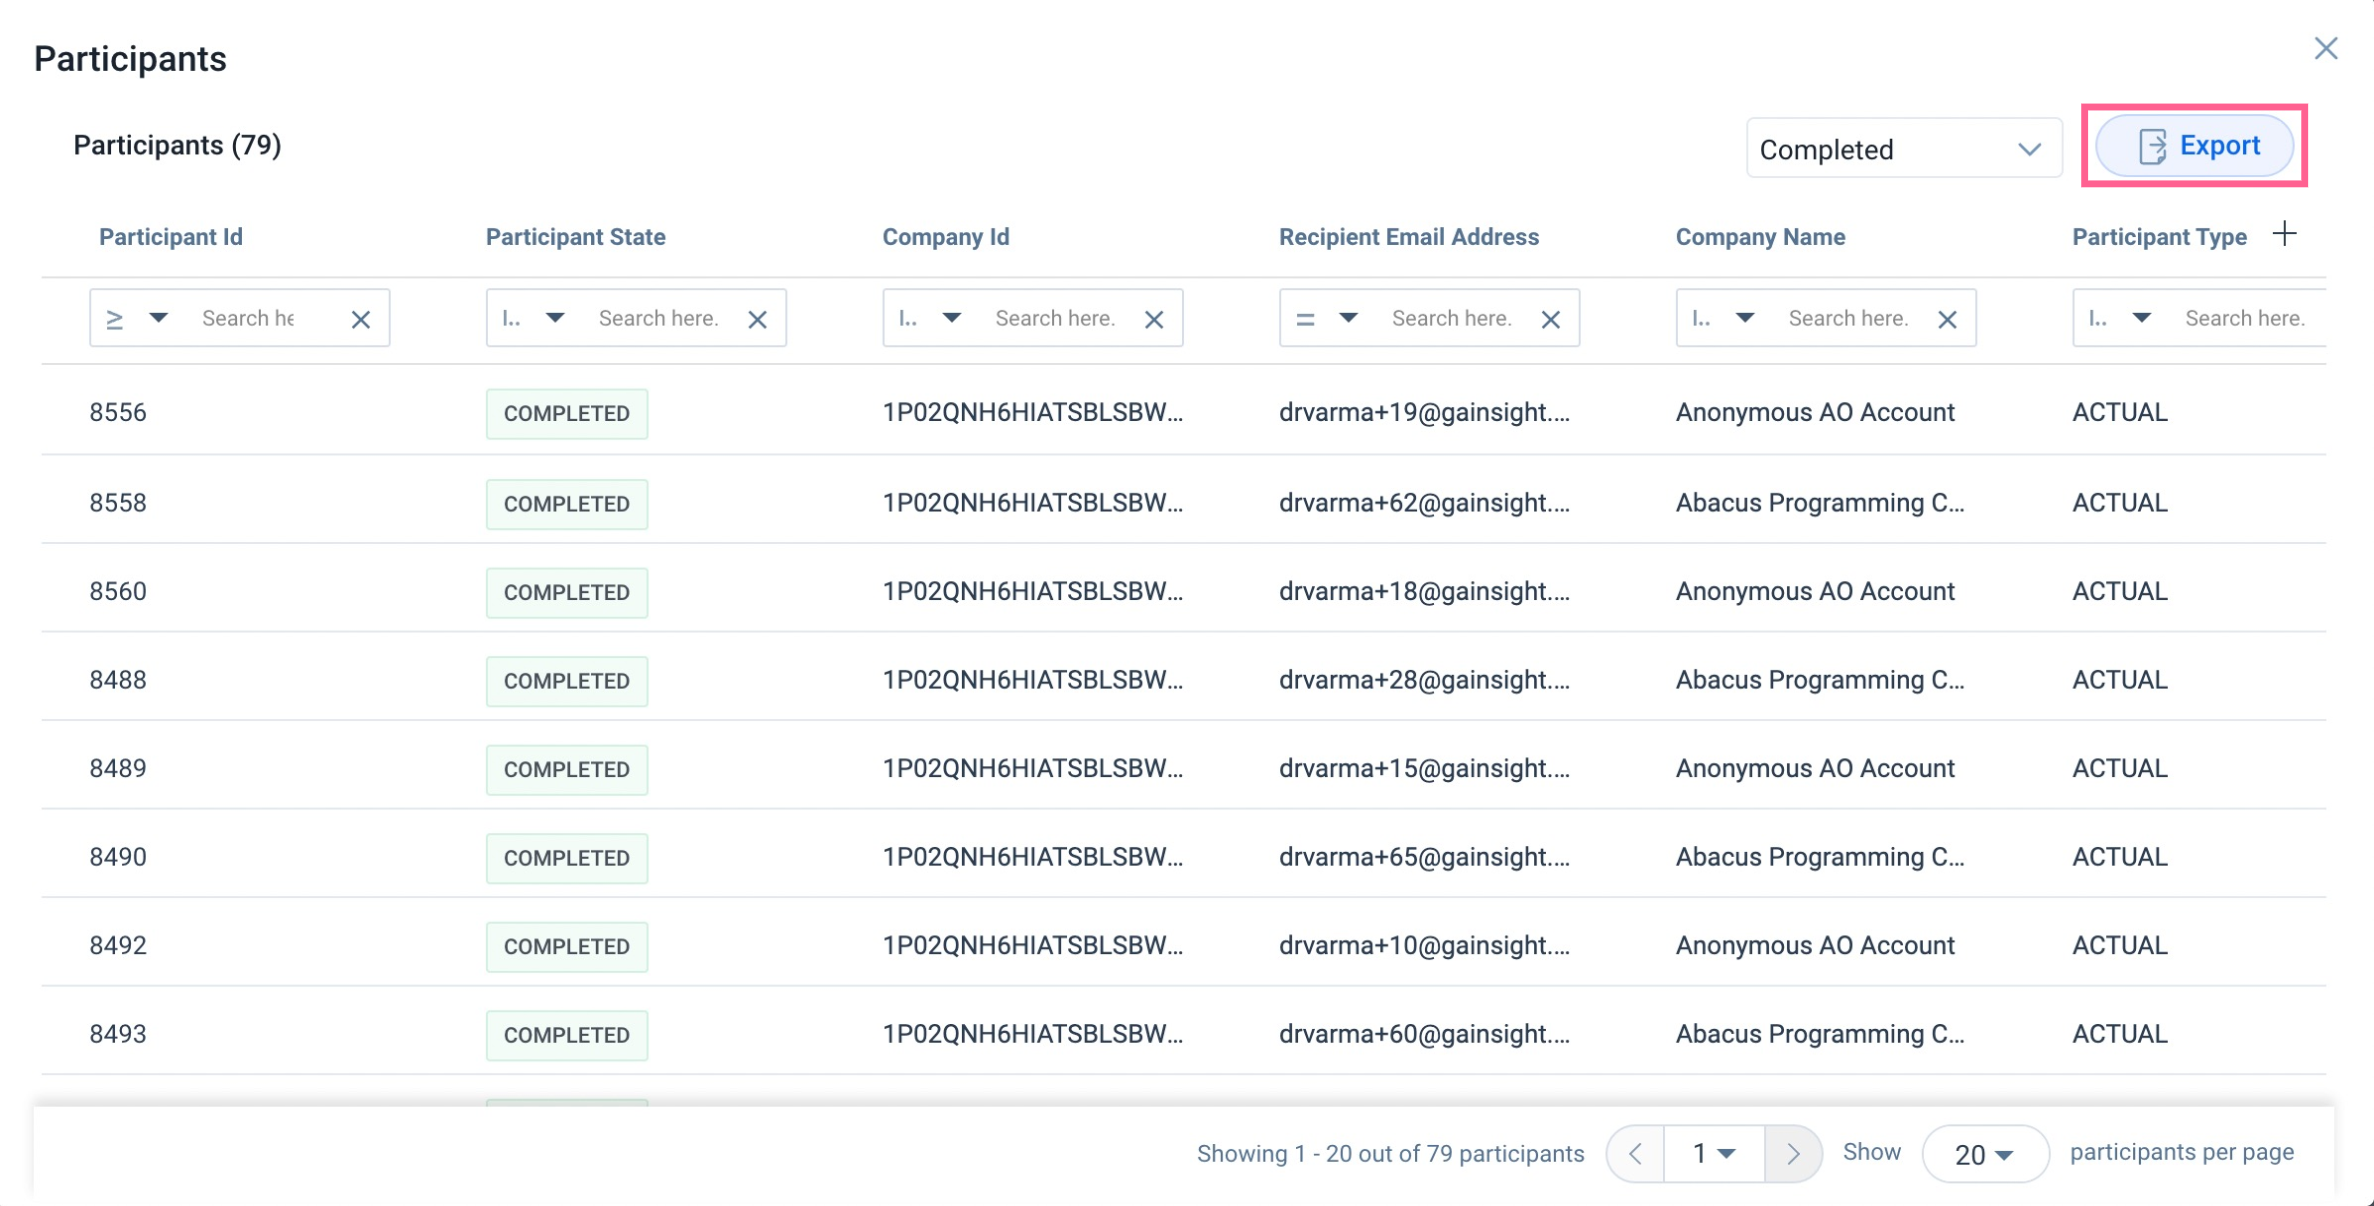
Work with Participants’ Data
The Admins can analyze the participant’s engagement on the sent emails through the Dashboard feature of Gainsight. Dashboard feature provides a user friendly drilldown dashboard with easy access to information.Admin can view, customize, filter and export the participants list.
View Participants’ List
To view the participant’s list:
- Navigate to Programs > Active Simple Programs > Analytics > Dashboard.
- Click any card in the Overall Performance section. Alternatively, click Survey Stats funnel or click Email Stats.The participants list window appears.
The information provided for each participant is as follows:
- Participant Id: Displays the unique ID of Participants specific to the program.
- Participant State: Displays the state of the participant lifecycle. For more information on participant lifecycle, refer to the Participant Lifecycle article from Additional Resources section of this article.
- Company Id: Displays the participant’s company ID.
- Recipient’s Email Address: Displays the participant’s email address.
- Person Id: Displays the unique ID of the person.
- Company Name: Displays the participant’s company name.
- Participant Source Type: Displays the participant's source type. It can be either of the four potential sources: Segments, Events, CSV files, and the Query Builder. For more information on participant source type, refer to the Add Participants to a Program article from Additional Resources section of this article.
- Participant Source Name: Displays the participant’s course name.
- Participant Type: Displays the participant’s type. It can be either Test or Actual.
- Email Group Id: Displays the ID of the group to which the participant belongs.
- Failure Reason: Displays the reason for the program failure. For more information on failure reasons, refer to the Participant Failure Condition article from Additional Resources section of this article.
Customize Participants’ List
Admins can customize the displayed participant’s list by selecting or removing the respective column(s) from the list.
To customize the participant’s list table:
- Navigate to the Programs > Active Simple Programs > Analytics > Dashboard.
- Click any card in the Overall Performance section. Alternatively, click Survey Stats funnel or click Email Stats.The participants list window appears.
- Click the + icon, participant’s columns list appears.
- Select the required columns.
Notes:
- The selected columns list will appear on the right hand side of the window for your preview
- Participants list table has a total of 11 columns out of which only the Recipient's Email Address column is not customizable.
-
Click Confirm. The selected participant’s columns appear in the participants list table.
Filter Participants’ List
Admin can filter the participant’s list by applying the filter and query options that are available in the advanced filters of the participant’s table column header.
To display the filter the participant’s list:
- Navigate to the Programs > Active Simple Programs > Analytics > Dashboard.
- Click any card in the Overall Performance section. Alternatively, click Survey Stats funnel or click Email Stats.The participants list window appears.
- From the States dropdown, select one or more state(s) of the participant’s life cycle.
- Apply filters from the column headers as required.
- Press the enter key. The participants list is updated according to the applied filters.
Note: The AND operation is applied between the selected filter conditions. That means it will display the list of only those participants who fulfills all the applied filter conditions.
Export Participants’ List
Admins can download the required list of participants in a CSV file.
Note: If the participant’s list count is equal to or less than 1000, then the file is downloaded in the local system as a CSV file. If the count is more than 1000, you will receive an email with the participant list.
To export the participant’s list:
- Navigate to Programs > Active Simple Programs > Analytics > Dashboard.
- Click any card in the Overall Performance section. Alternatively, click Survey Stats funnel or click Email Stats.The participants list window appears.
- Click Export. The participants list is downloaded.
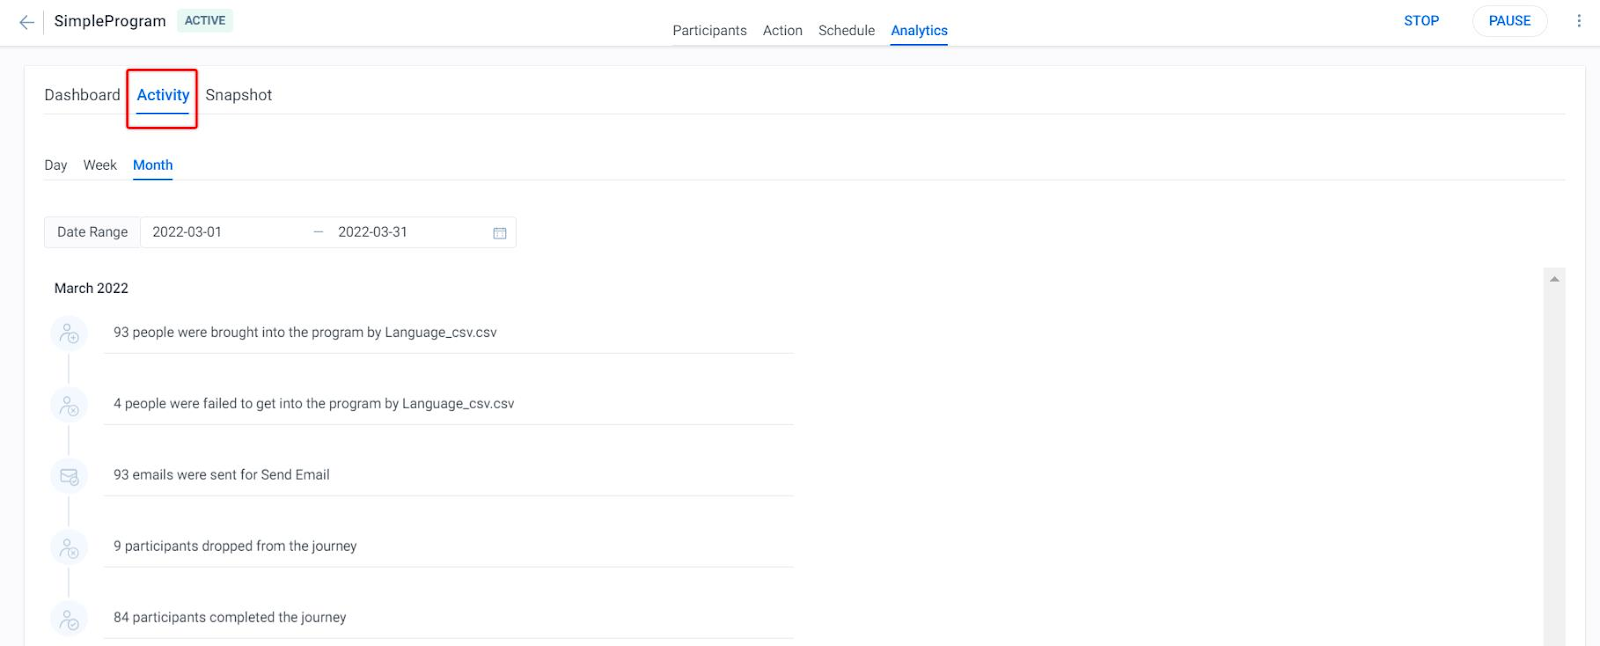
Activity for a Participant
The Activity section in the Analytics tab provides the activity feed of participants that appears as a flow diagram and displays each step of the participant’s journey in the Simple Program. This includes when the participant was sent an email, how long the participant waited between each step, when the participant was dropped from the Program journey, and the failure reason.
To access the activity feed for a participant:
-
In the Analytics tab of an active simple program, navigate to the Activity tab.
-
Select Day, Week, or Month aggregation to view the activity of a participant. The Activity screen appears for the participant.
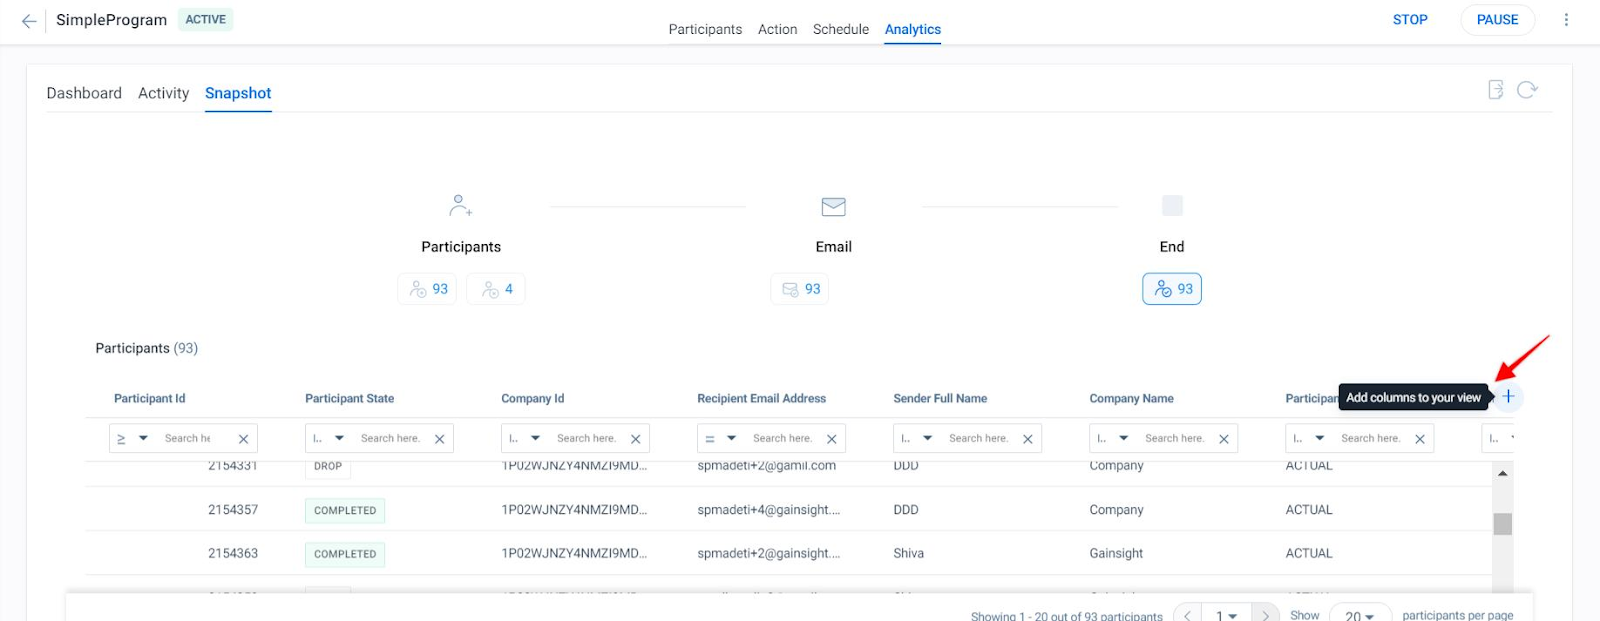
Snapshot
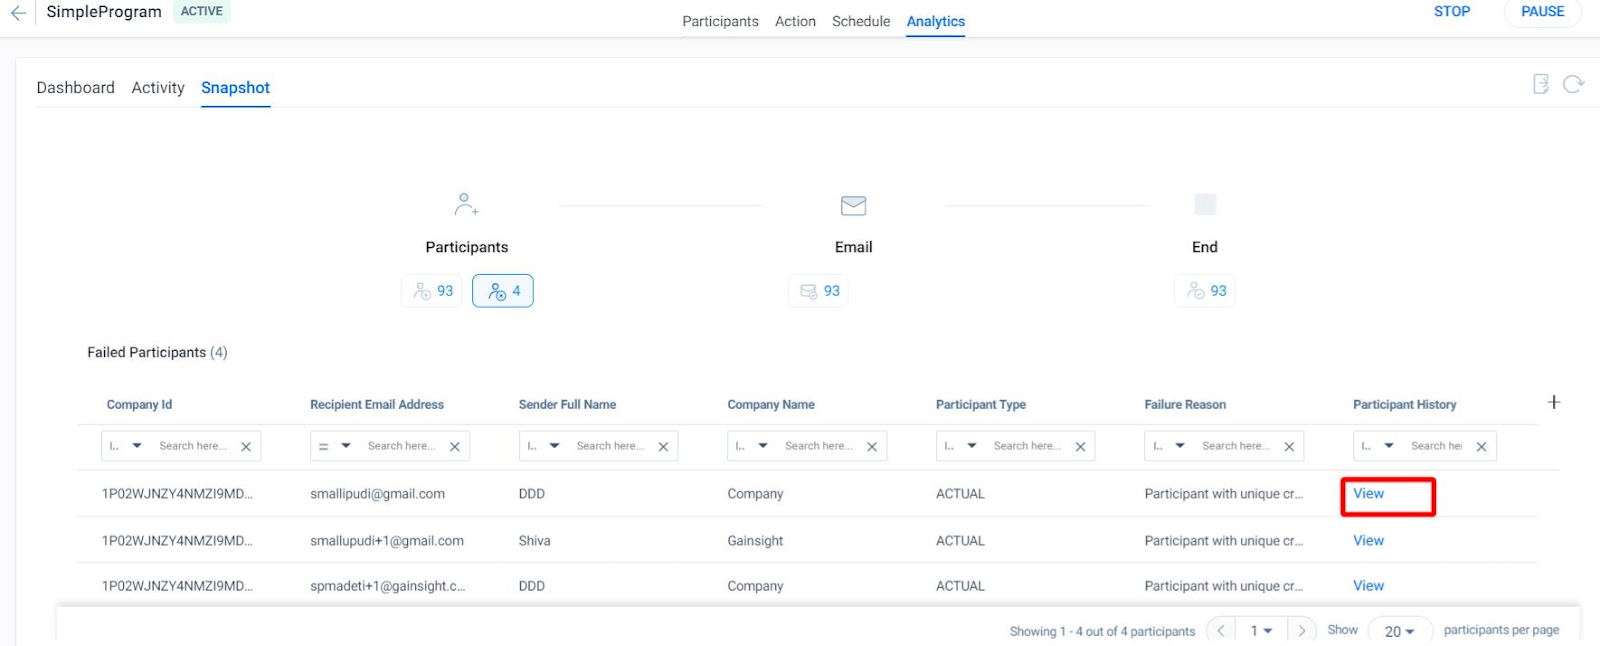
The Snapshot section in the Analytics tab summarizes the total number of participants added to a Simple Program, how many participants were removed or knocked off, how many participants received emails or engagements, and how many participants completed the journey. It also provides the drill down on each section of this report, which reveals the participants' names.
You can select columns for the participants' snapshot Using the + icon.
Click View to view the activity detail for that particular participant in the Simple Program journey.
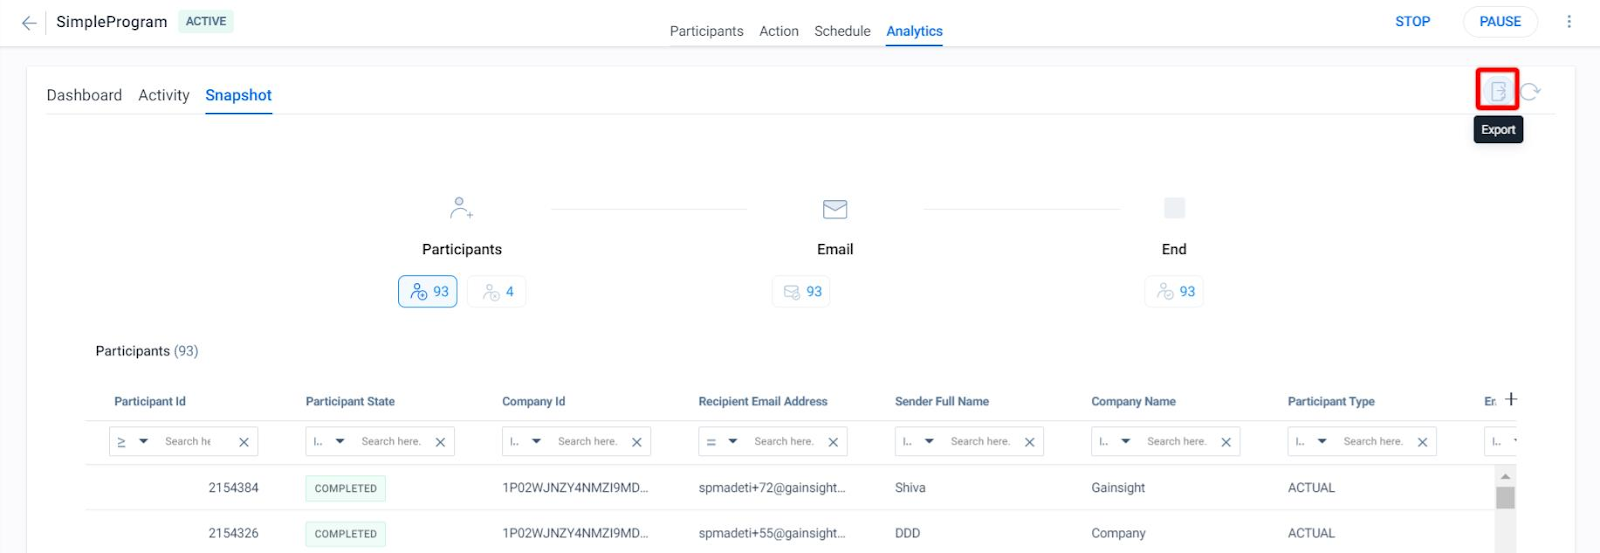
Using the Export option, you can export the participants’ Snapshot information of each Simple Program.
Simple Program in Journey Analytics
The Journey Analytics page displays data across Programs for each customer and contact. Under Journey Analytics, admins can view information including the number of single programs a customer or contact has participated in, as well as out of the box reports for bounce rate, unsubscribe rate, and other data. To navigate to this feature, select Digital Journey > Journey Analytics > select the Simple Program checkbox
IMPORTANT: To access Journey Analytics page, user should be Super Admin or they should have Analyze Permission (program) selected in one of the assigned Permission Bundles.
For more information, refer to the Reports Across Programs article mentioned in the Additional Resources section.
Additional Resources
For information about Participants, refer to the following articles: