Adoption Explorer Functions
Gainsight NXT
This article explains how admins can use the wide range of functions available within Adoption Explorer, with simple use cases.
Overview
You can apply functions on any field while creating a Derived Field and/or while creating a Usage Report.
Notes:
- The String and Date functions are not available while creating a Derived Field.
- The Data Science functions are not available while creating a Usage Report.
Derived Fields are the custom measures and dimensions created in an object, using the ingested measures and dimensions. For example, if you have a Page Views field, then by applying Sum Function (under Aggregate), you can derive the Sum of Page Views.
After you apply a function on the required field and save it, you can create a usage report on the derived field, within the Adoption Explorer project Dashboard. The Adoption Explorer project dashboard can further be added to the C360 page, from Administration > C360 Layouts. And, CSMs can further derive insights from the C360 page, and can take necessary actions, to drive their business outcomes faster.
- For more information on how to create a derived field, refer to the Fields and Derived Fields in Object article from the Additional Resources section of this article.
- For more information on how to create a usage section in a layout, refer to the Create Usage Report in a Dashboard article from the Additional Resources section of this article.
Adoption Explorer Functions
The following function types are available in Adoption Explorer:
Aggregate
The following functions are available in the Aggregate Function Type:
- Sum: Returns the sum value of an expression.
- Count: Returns the count of an expression.
- Count Distinct: Returns the distinct count of an expression.
- Min: Returns the minimum value of an expression.
- Max: Returns the maximum value of an expression.
- Average: Returns the average value of an expression.
You can see the following example on creating a derived measure using the Sum function.
For example, if you have a person's page views data for a company called ABC Financial Services, and you may want to calculate the sum of page views for this company, you can apply the Sum function to get the total page views.
To perform this in an Adoption Explorer project:
- Navigate to Adoption Explorer > Administration.
- Click the project name.
- Select the object from the Objects in Project section.
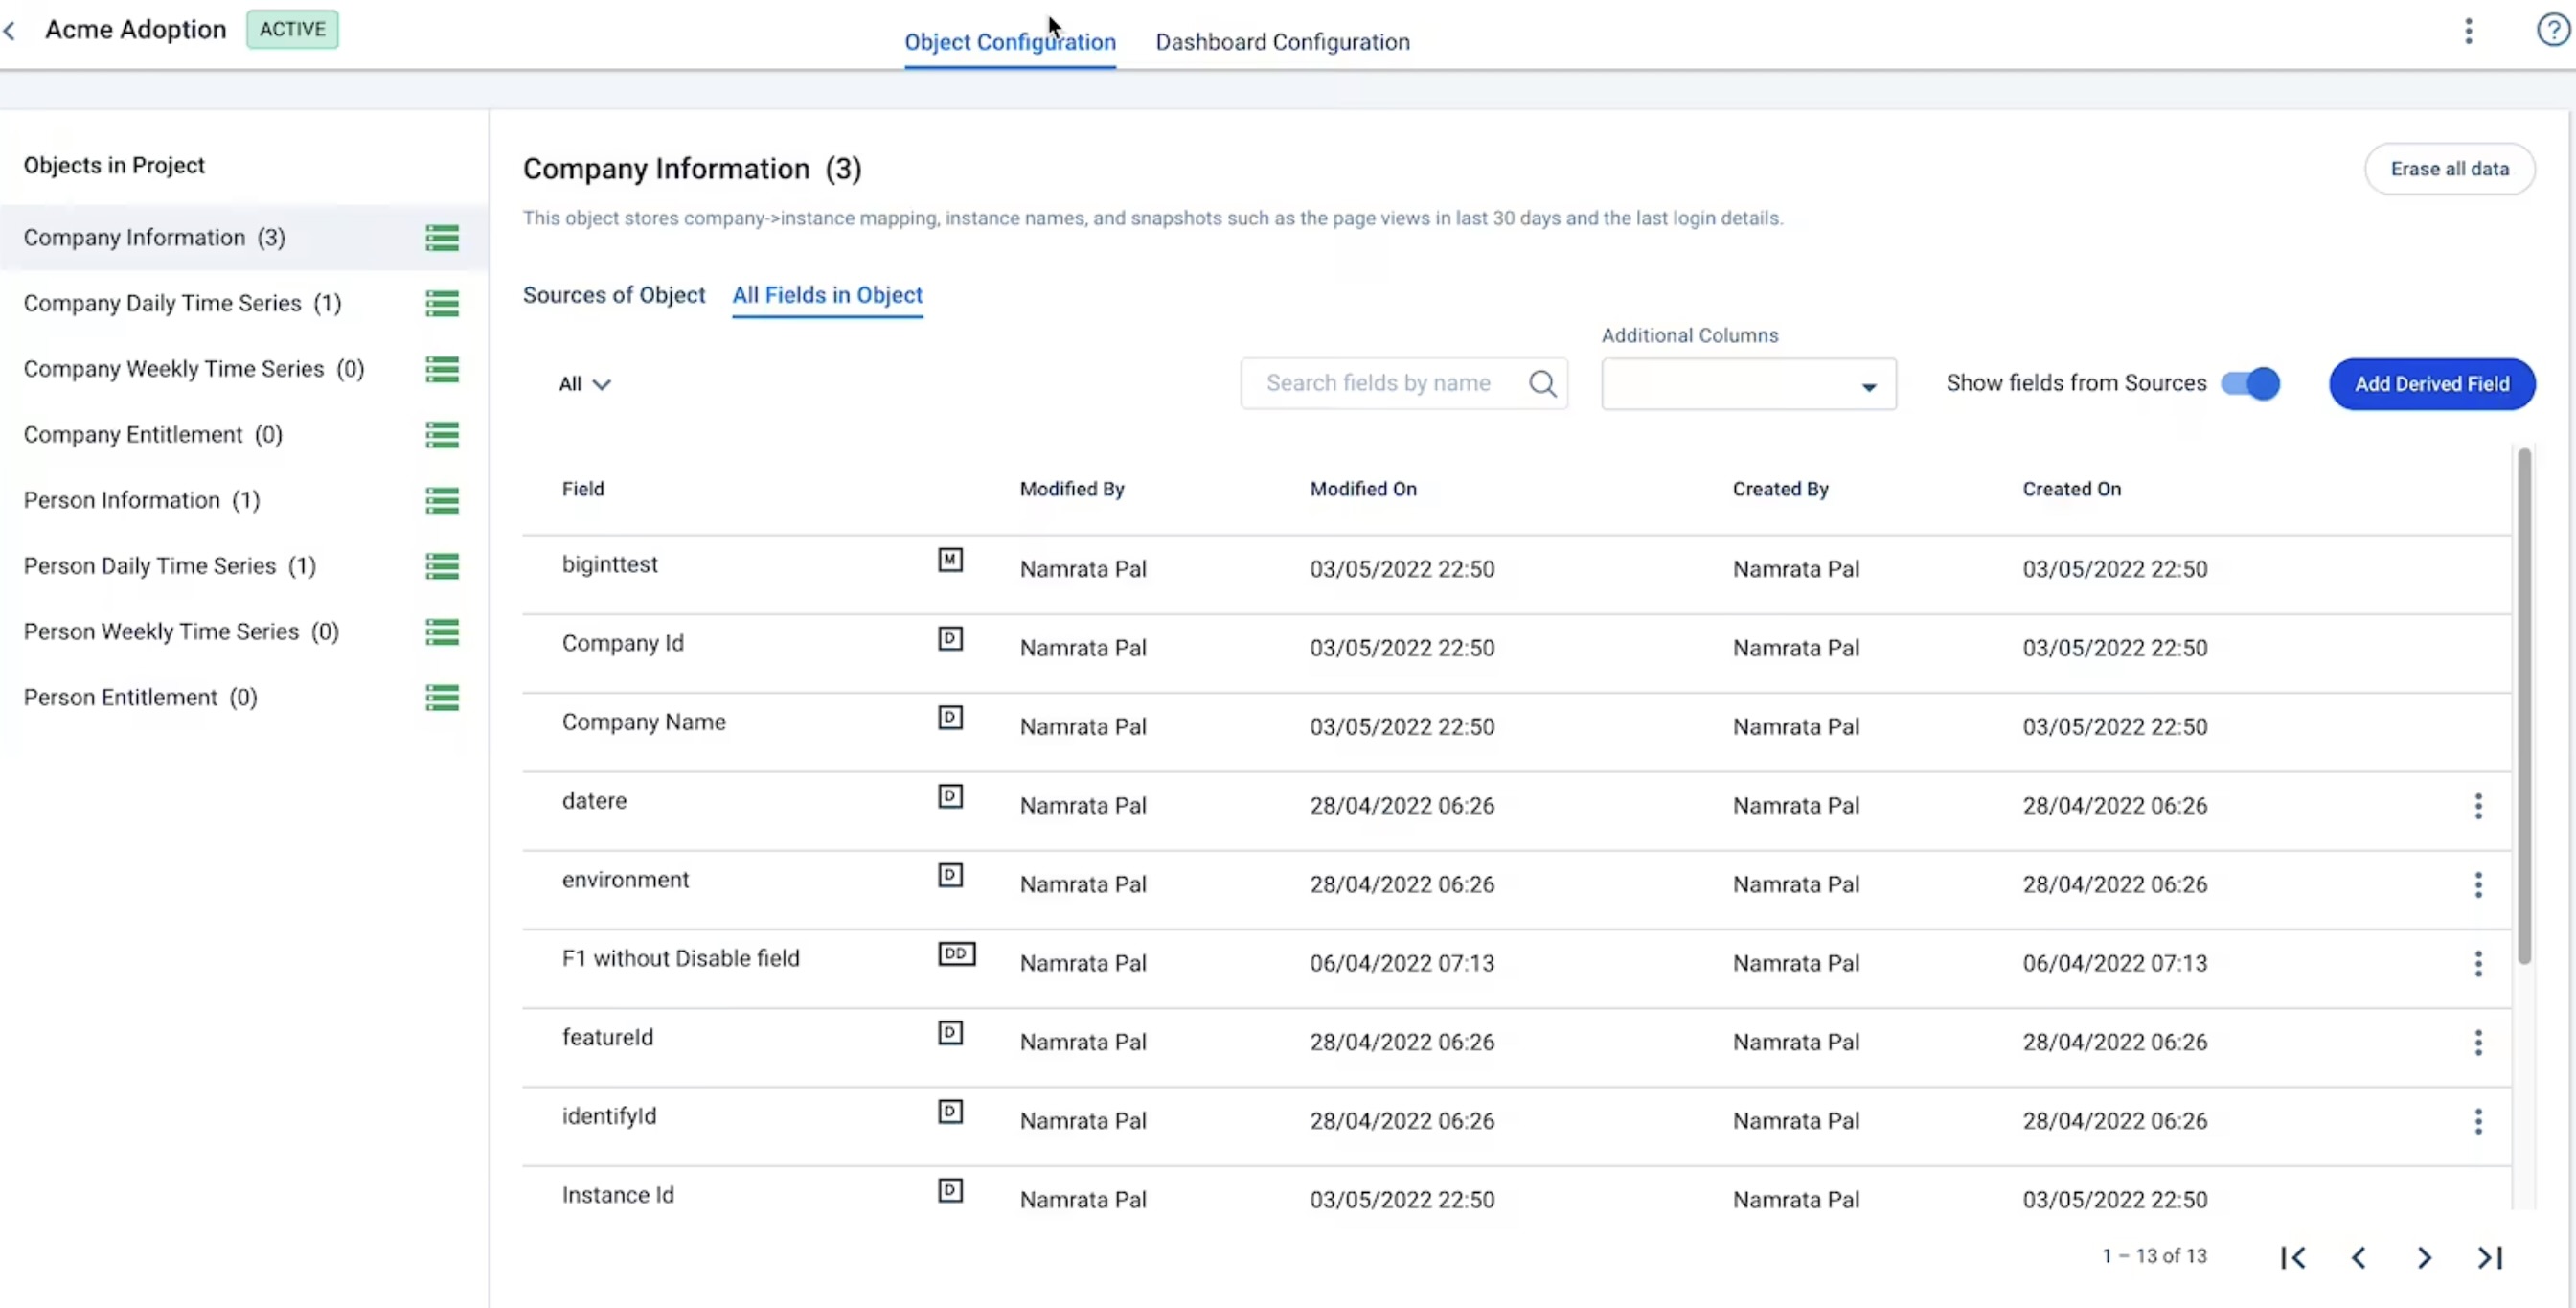
- Click the All fields in Object tab.
- Click Add Derived Field.
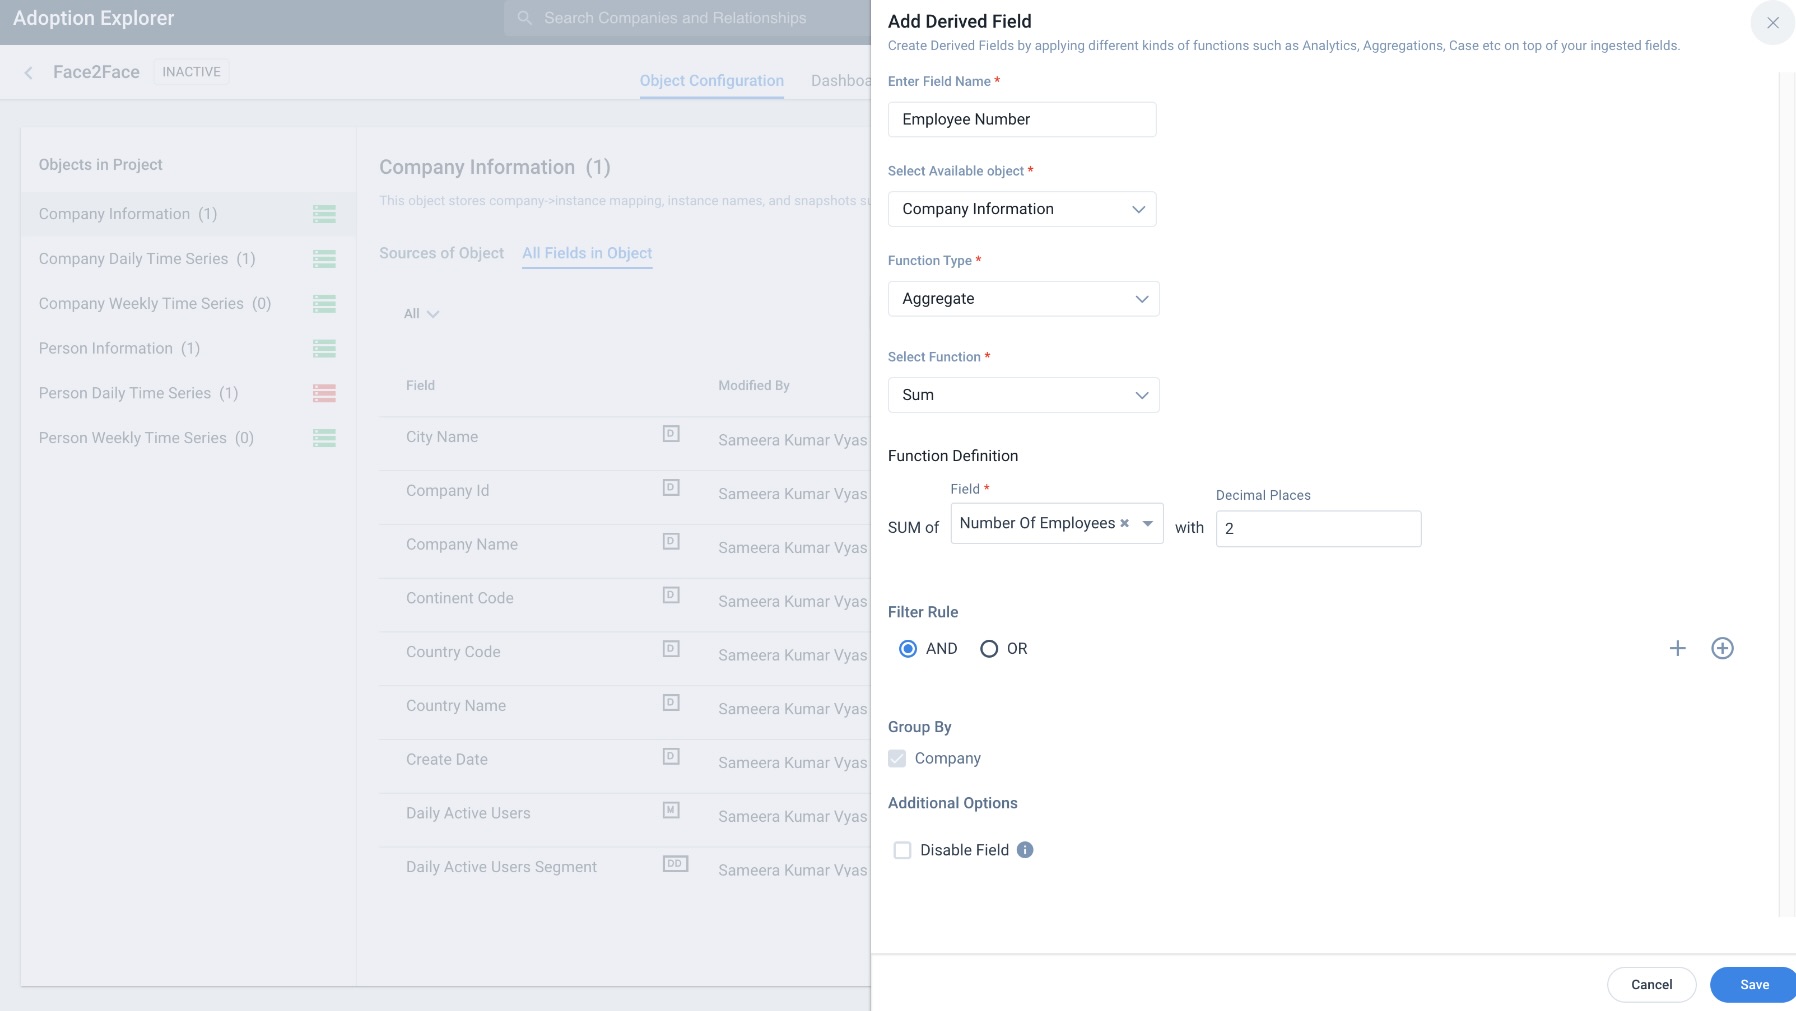
- In the Add Derived Field slide-out panel, perform the following:
- Enter the Field Name.
- Select the required source from the Select Available Object dropdown.
- From the Function Type field, select Aggregate.
- From the Select Function dropdown, select Sum.
- From the Function Definition section, select Page Views in the Field dropdown.
- Click Save.
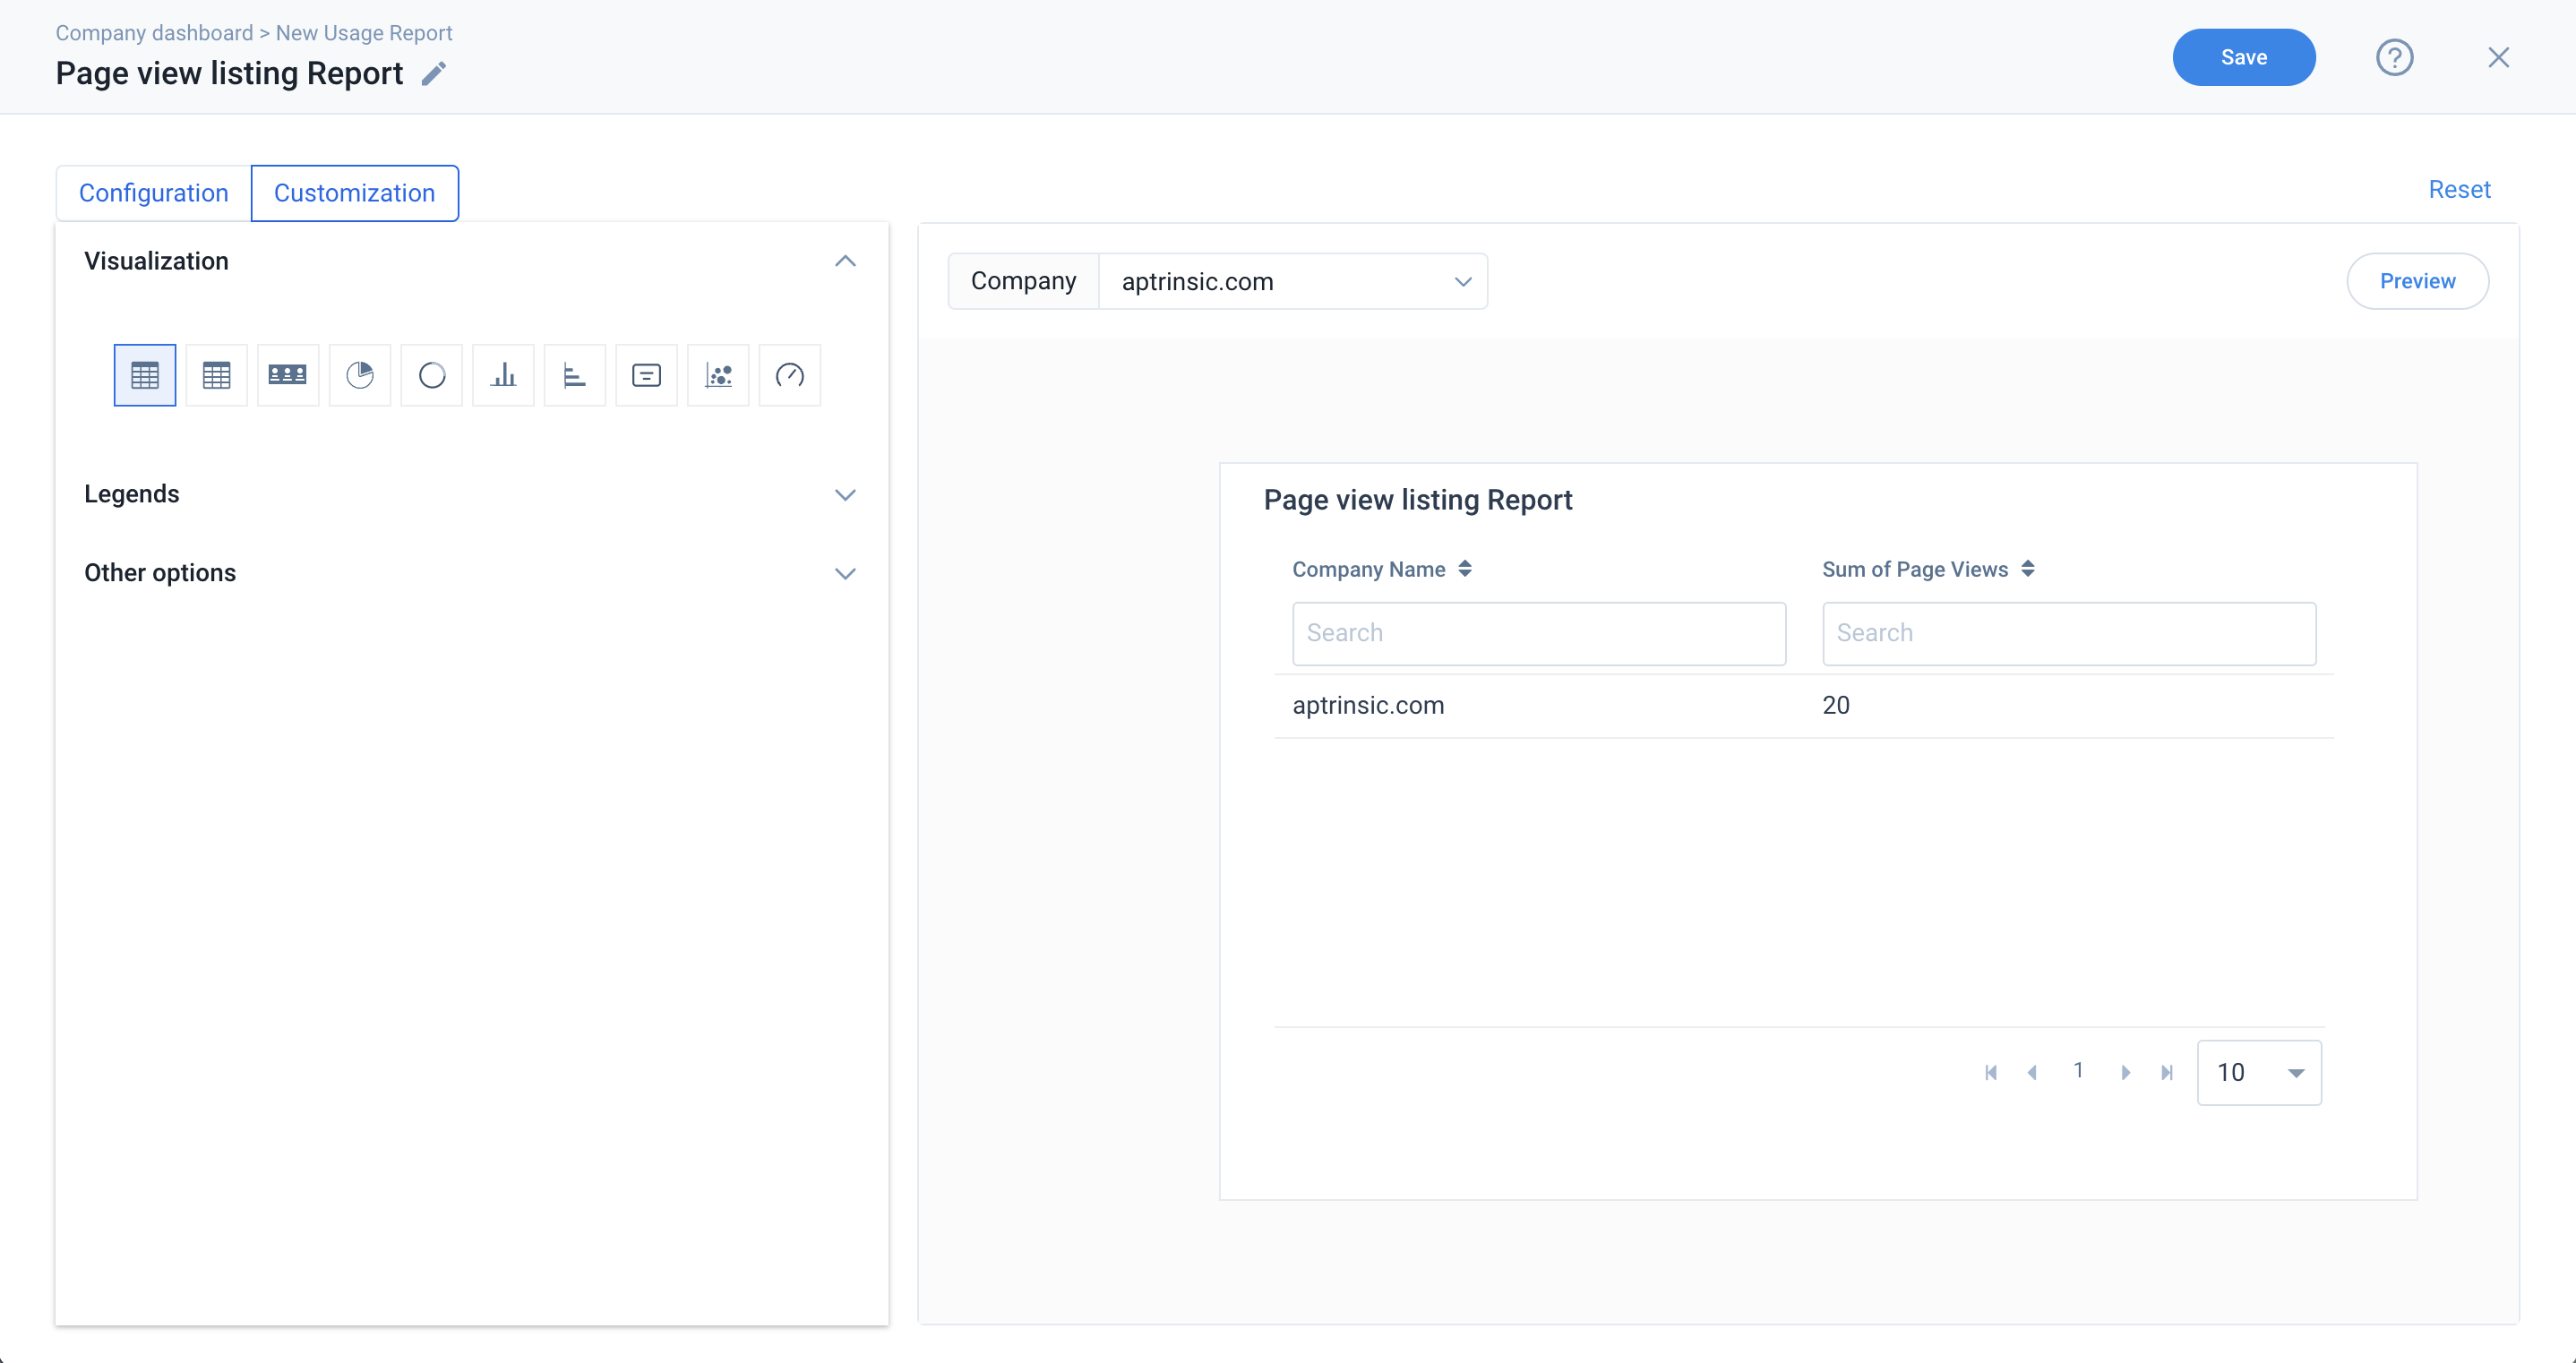
In the Dashboard Configuration tab, while creating a usage report, you can see the newly created Derived Field named Sum of Page Views in the Show Fields section. From the preview, you can see the Sum of Page Views records of a specific company.
Analytics
The following functions are available in the Analytics Function Type:
- Growth: Returns the growth of a field.
- Window Cumulative Distance: Calculates the relative rank of the current row within a window partition: (number of rows preceding or peer with current row) / (total rows in the window partition).
- Window Dense Rank: Determines the rank of a value in a group of values based on the ORDER BY expression and the OVER clause. Each value is ranked within its partition. Rows with equal values receive the same rank. There are no gaps in the sequence of ranked values if two or more rows have the same rank.
- Window Percent Rank: Calculates the percent rank of the current row using the following formula: (x - 1) / (number of rows in window partition - 1) where x is the rank of the current row.
- Window Rank: Determines the rank of a value in a group of values. The ORDER BY expression in the OVER clause determines the value. Each value is ranked within its partition. Rows with equal values for the ranking criteria receive the same rank. Drill adds the number of tied rows to the tied rank to calculate the next rank and thus the ranks might not be consecutive numbers.
- Window Row Number: Determines the ordinal number of the current row within its partition. The ORDER BY expression in the OVER clause determines the number. Each value is ordered within its partition. Rows with equal values for the ORDER BY expressions receive different row numbers nondeterministically.
- Window First Value: Returns the value of the specified expression with respect to the first row in the window frame.
- Window Last Value: Returns the value of the specified expression with respect to the last row in the window frame.
- Window Lag: Returns the value for the row before the current row in a partition. If no row exists, null is returned.
- Window Lead: Returns the value for the row after the current row in a partition. If no row exists, null is returned.
- Window Average: Returns the average value for the input expression values.
- Window Count: Returns the count of the number of input rows.
- Window Minimum: Returns the minimum value of the expression across all input values.
- Window Max: Returns the maximum value of the expression across all input values.
- Window Sum: Returns the sum of the expression across all input values.
Data Science
Segment is the function available in Data Science function type. Segment function allows you to categorize data into segments, in ascending order.
You can see the following example on creating segments on a field using Segment Function (under Data Science).
For example, consider you have ARR data for a company called ABC Financial Services, and you want to know which segment this company’s ARR falls under.
To perform this in an Adoption Explorer project:
- Click Add Derived Field.
- In the Add Derived Field slide-out panel, perform the following:
- Enter the Field Name.
- Select the required source from the Select Available Object dropdown.
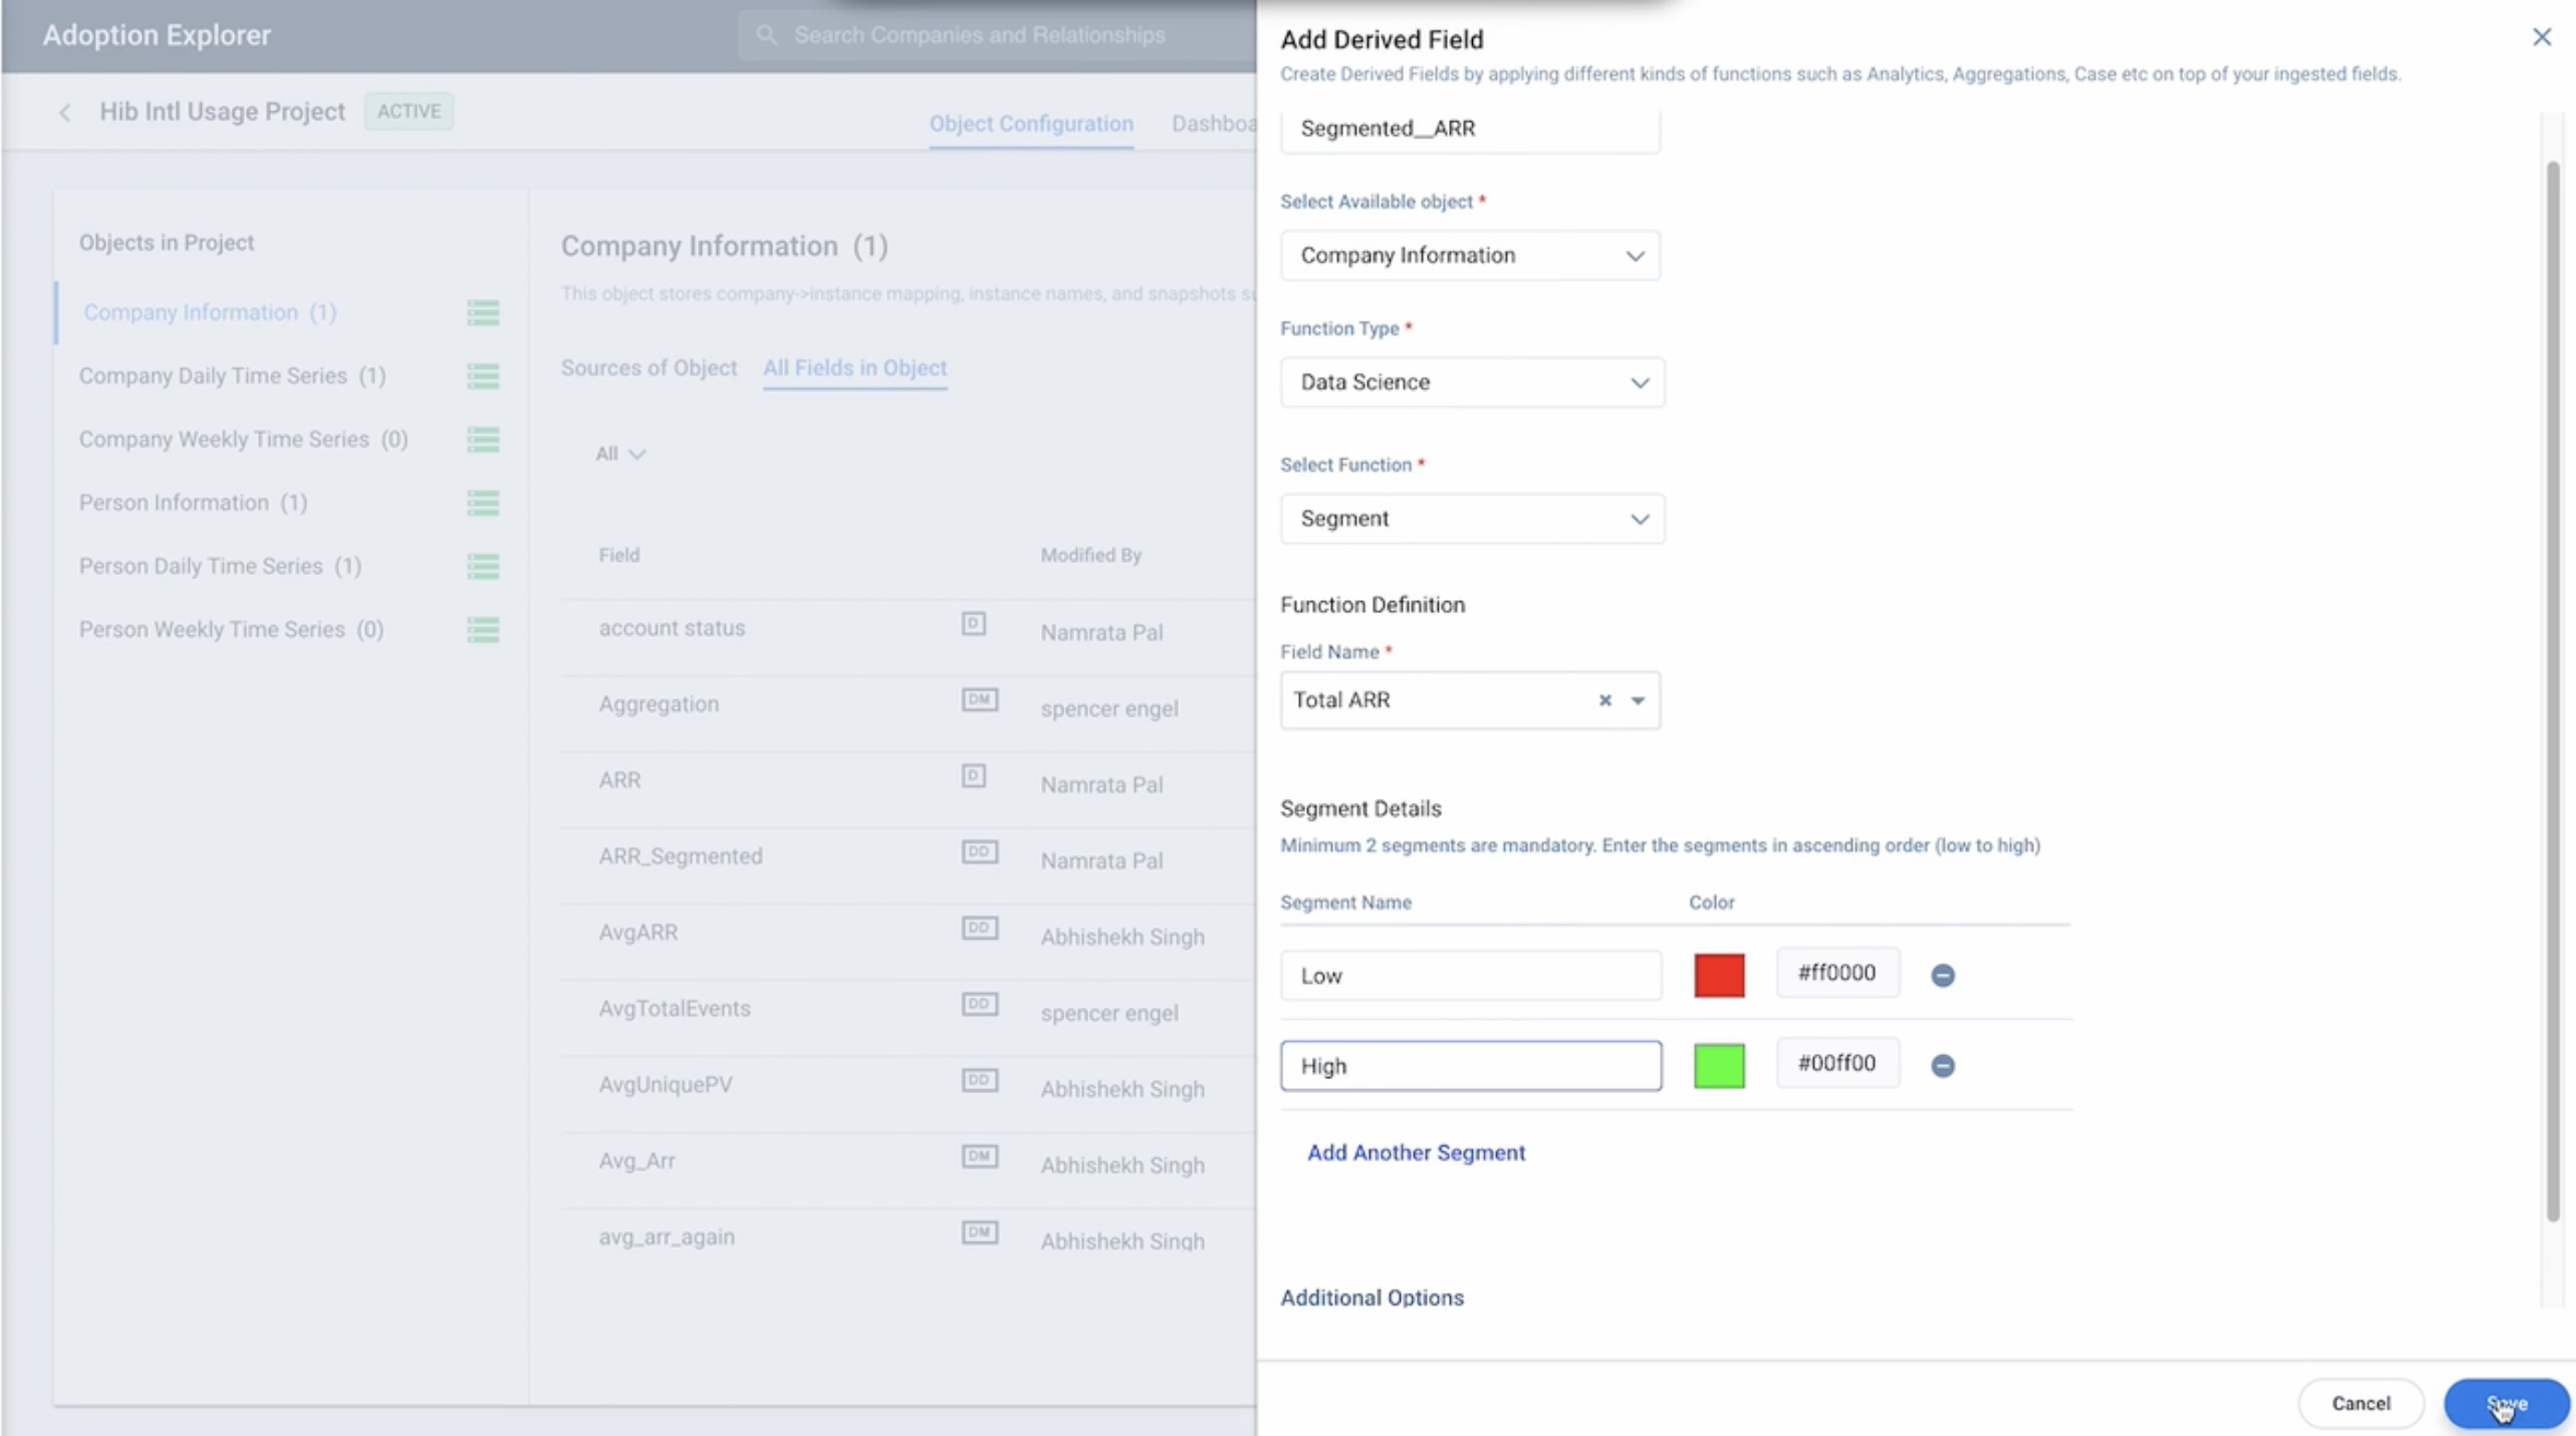
- From the Function Type field, select Data Science.
- From the Select Function dropdown, select Segment.
- In the Function Definition section:
- Select Total ARR from the Field Name dropdown.
- Define the Segments from Low to High. Here, Low is defined as Red and High as Green.
- Click Save.
In the Dashboard Configurations tab, while creating a usage report, you can see the newly created Derived Field named Segmented_ARR in the Show Fields section. From the preview, you can now easily know which segment the selected company’s ARR falls under.
String
The following functions are available in the String function type:
- Concat FUNC (string, string,...): Concatenates two or more strings together.
- Initcap FUNC (string): Returns the string using Initial caps.
- Length FUNC (string): Returns the number of characters in the string. For example, LENGTH(“string”) returns 6.
- Lower FUNC (string): Converts the characters in the string to Lowercase.
- Upper FUNC (string): Converts the characters in the string to Uppercase.
- Substring FUNC (string, x, y): Extracts characters from position 1 - x of the string an optional y times. Finds the substring based on the position and length. For example, Substring (Agriculture, 2,4) will return values from 2 to 4, i.e “gric” as the output.
You can see the following example on creating a derived field using the Concat function (under String).
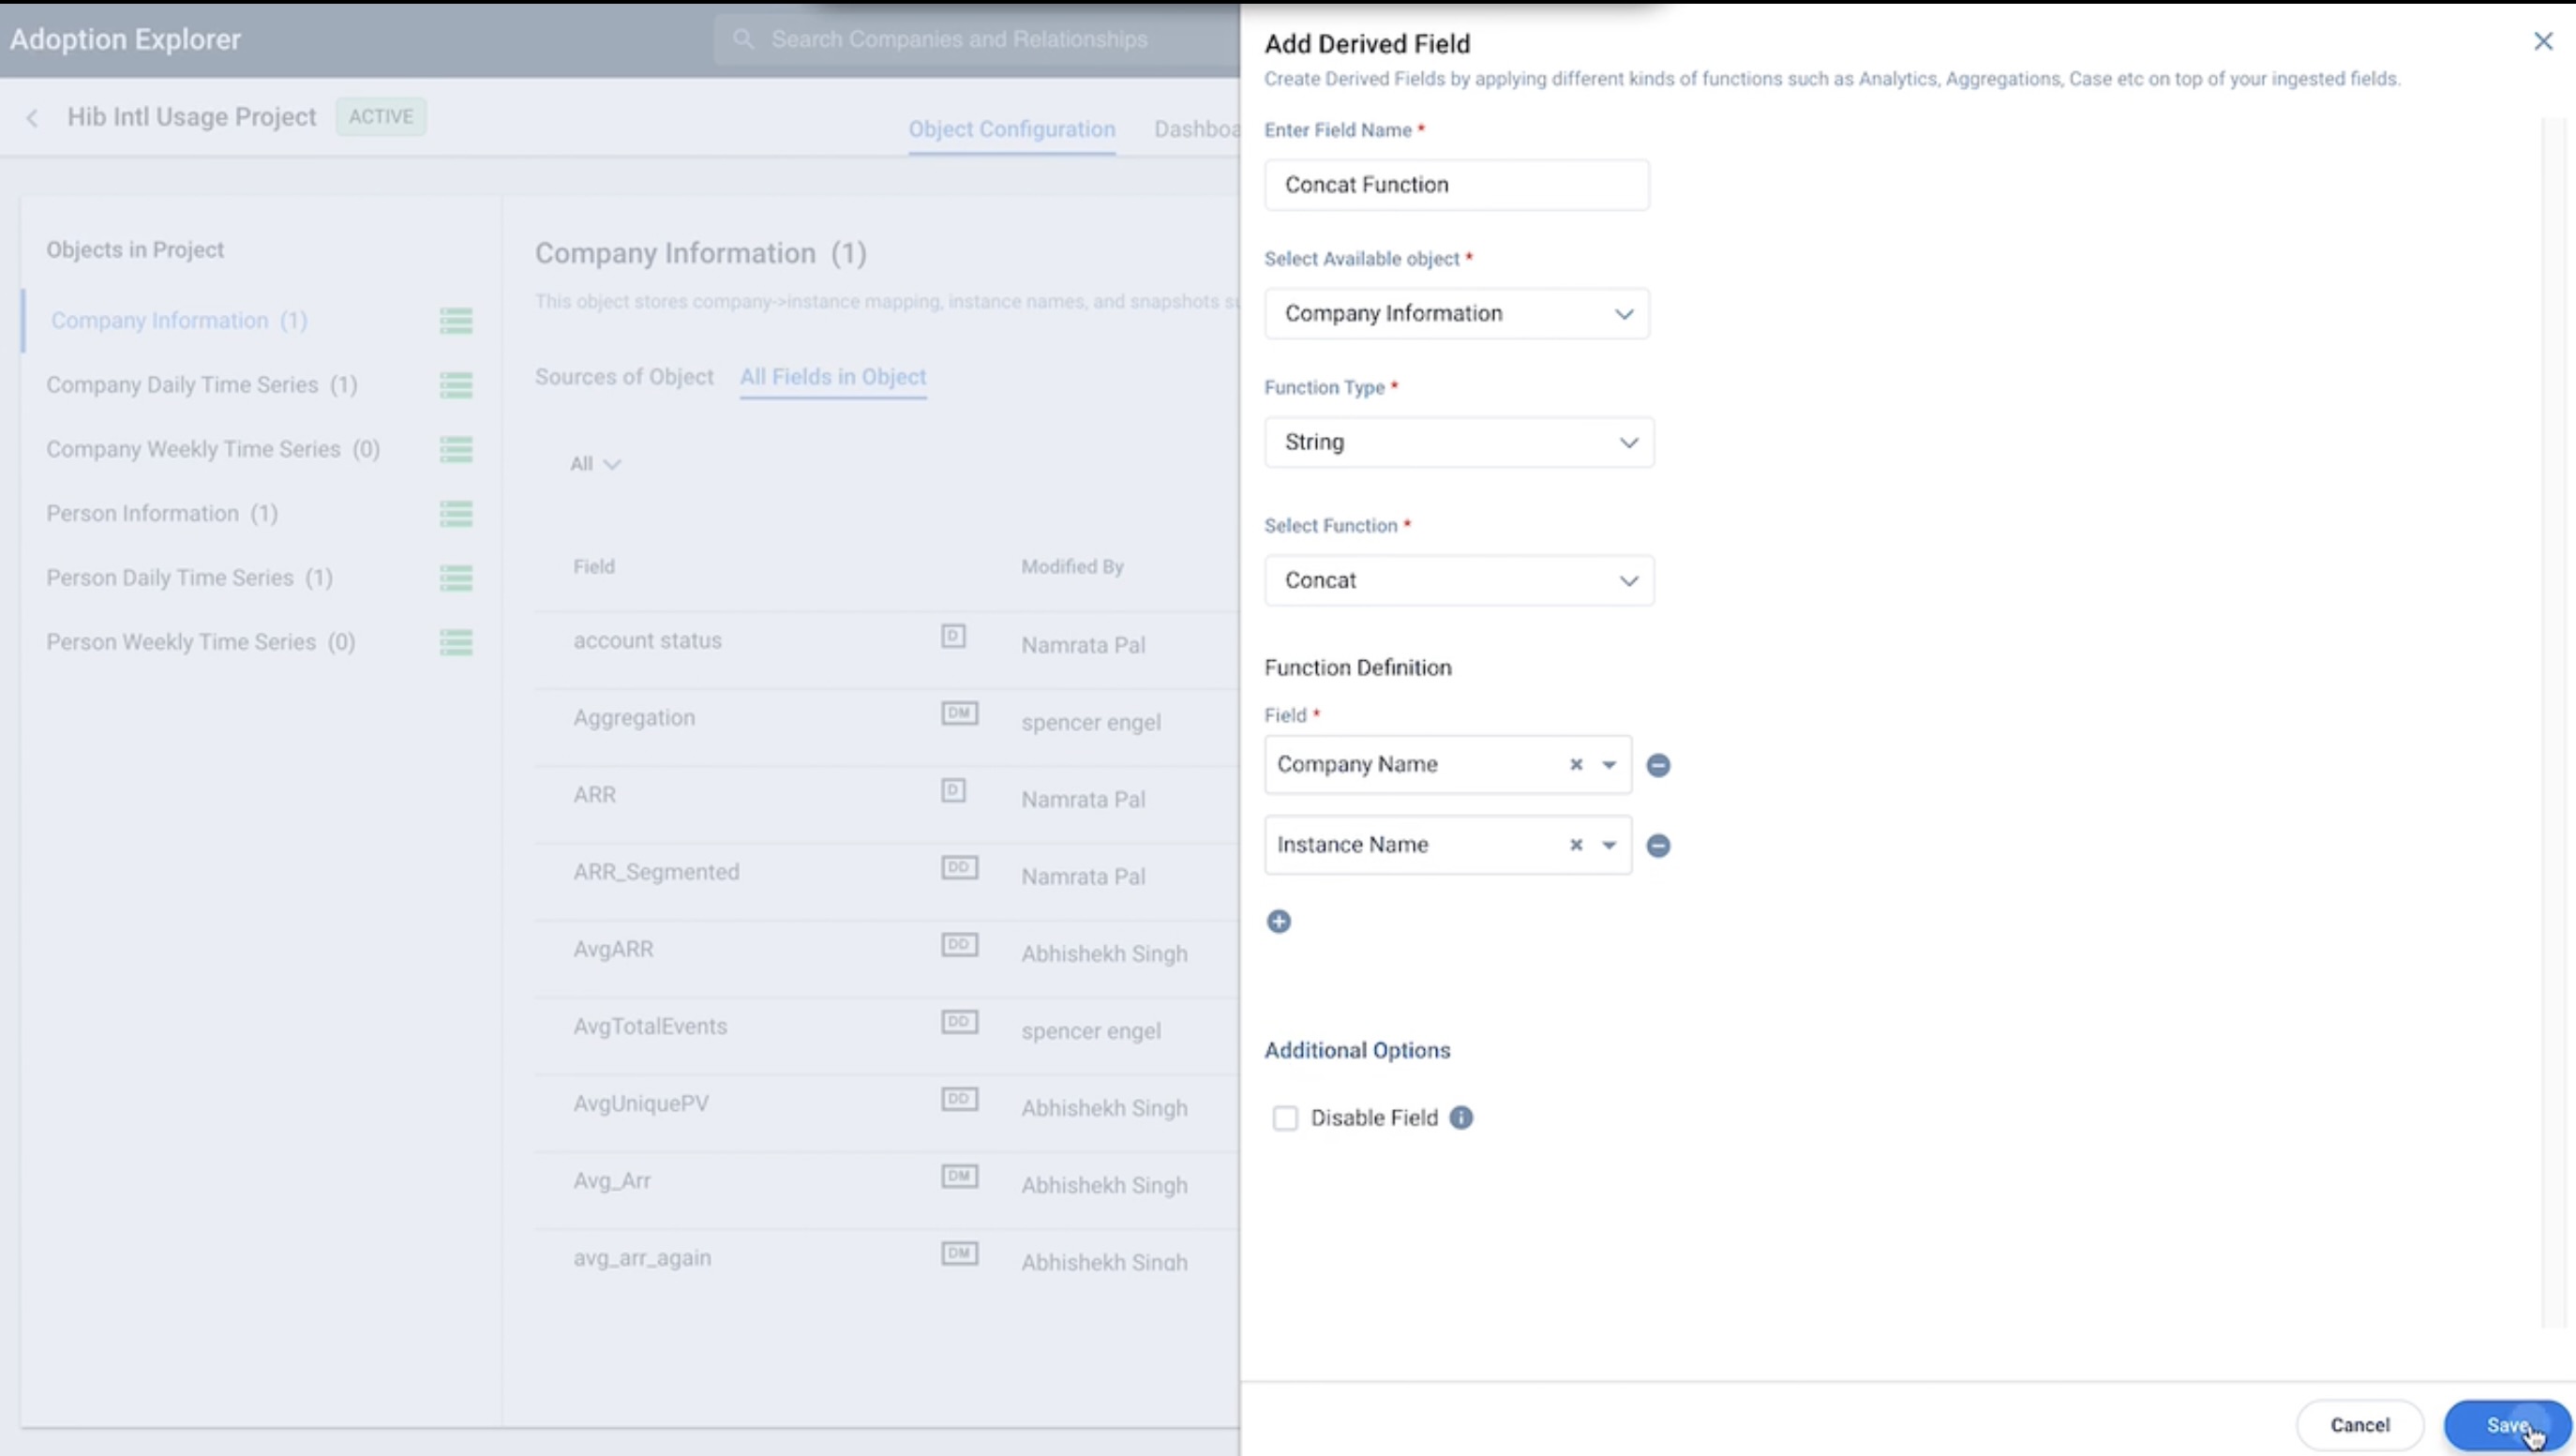
For example, if you have Company Name and Company Instance fields in the Company Information object and want to see the records of both the fields in a single field, you can apply the Concat function.
To perform this in an Adoption Explorer project:
- Click Add Derived Field.
- In the Add Derived Field slide-out panel, perform the following:
- Enter the Field Name.
- Select the required source from the Select Available Object dropdown.
- In the Function Type field, select String.
- In the Select Function dropdown, select Concat.
- In the Function Definition section, select Company Name and Instance Name fields from the Field dropdown.
- Click Save.
In the Dashboard Configurations tab, while creating a usage report, you can see the newly created Derived Field named Concat Function in the Show Fields section. From the preview, you can now see the concatenated records for a specific company.
Expression Builder
You can use the Expression Builder to perform various arithmetic calculations on data. For example, if you have Total Seats and Used Licensed Seats fields in your Company Information object, and want to know the Unused Licensed Seats, you can achieve this by applying the Expression function.
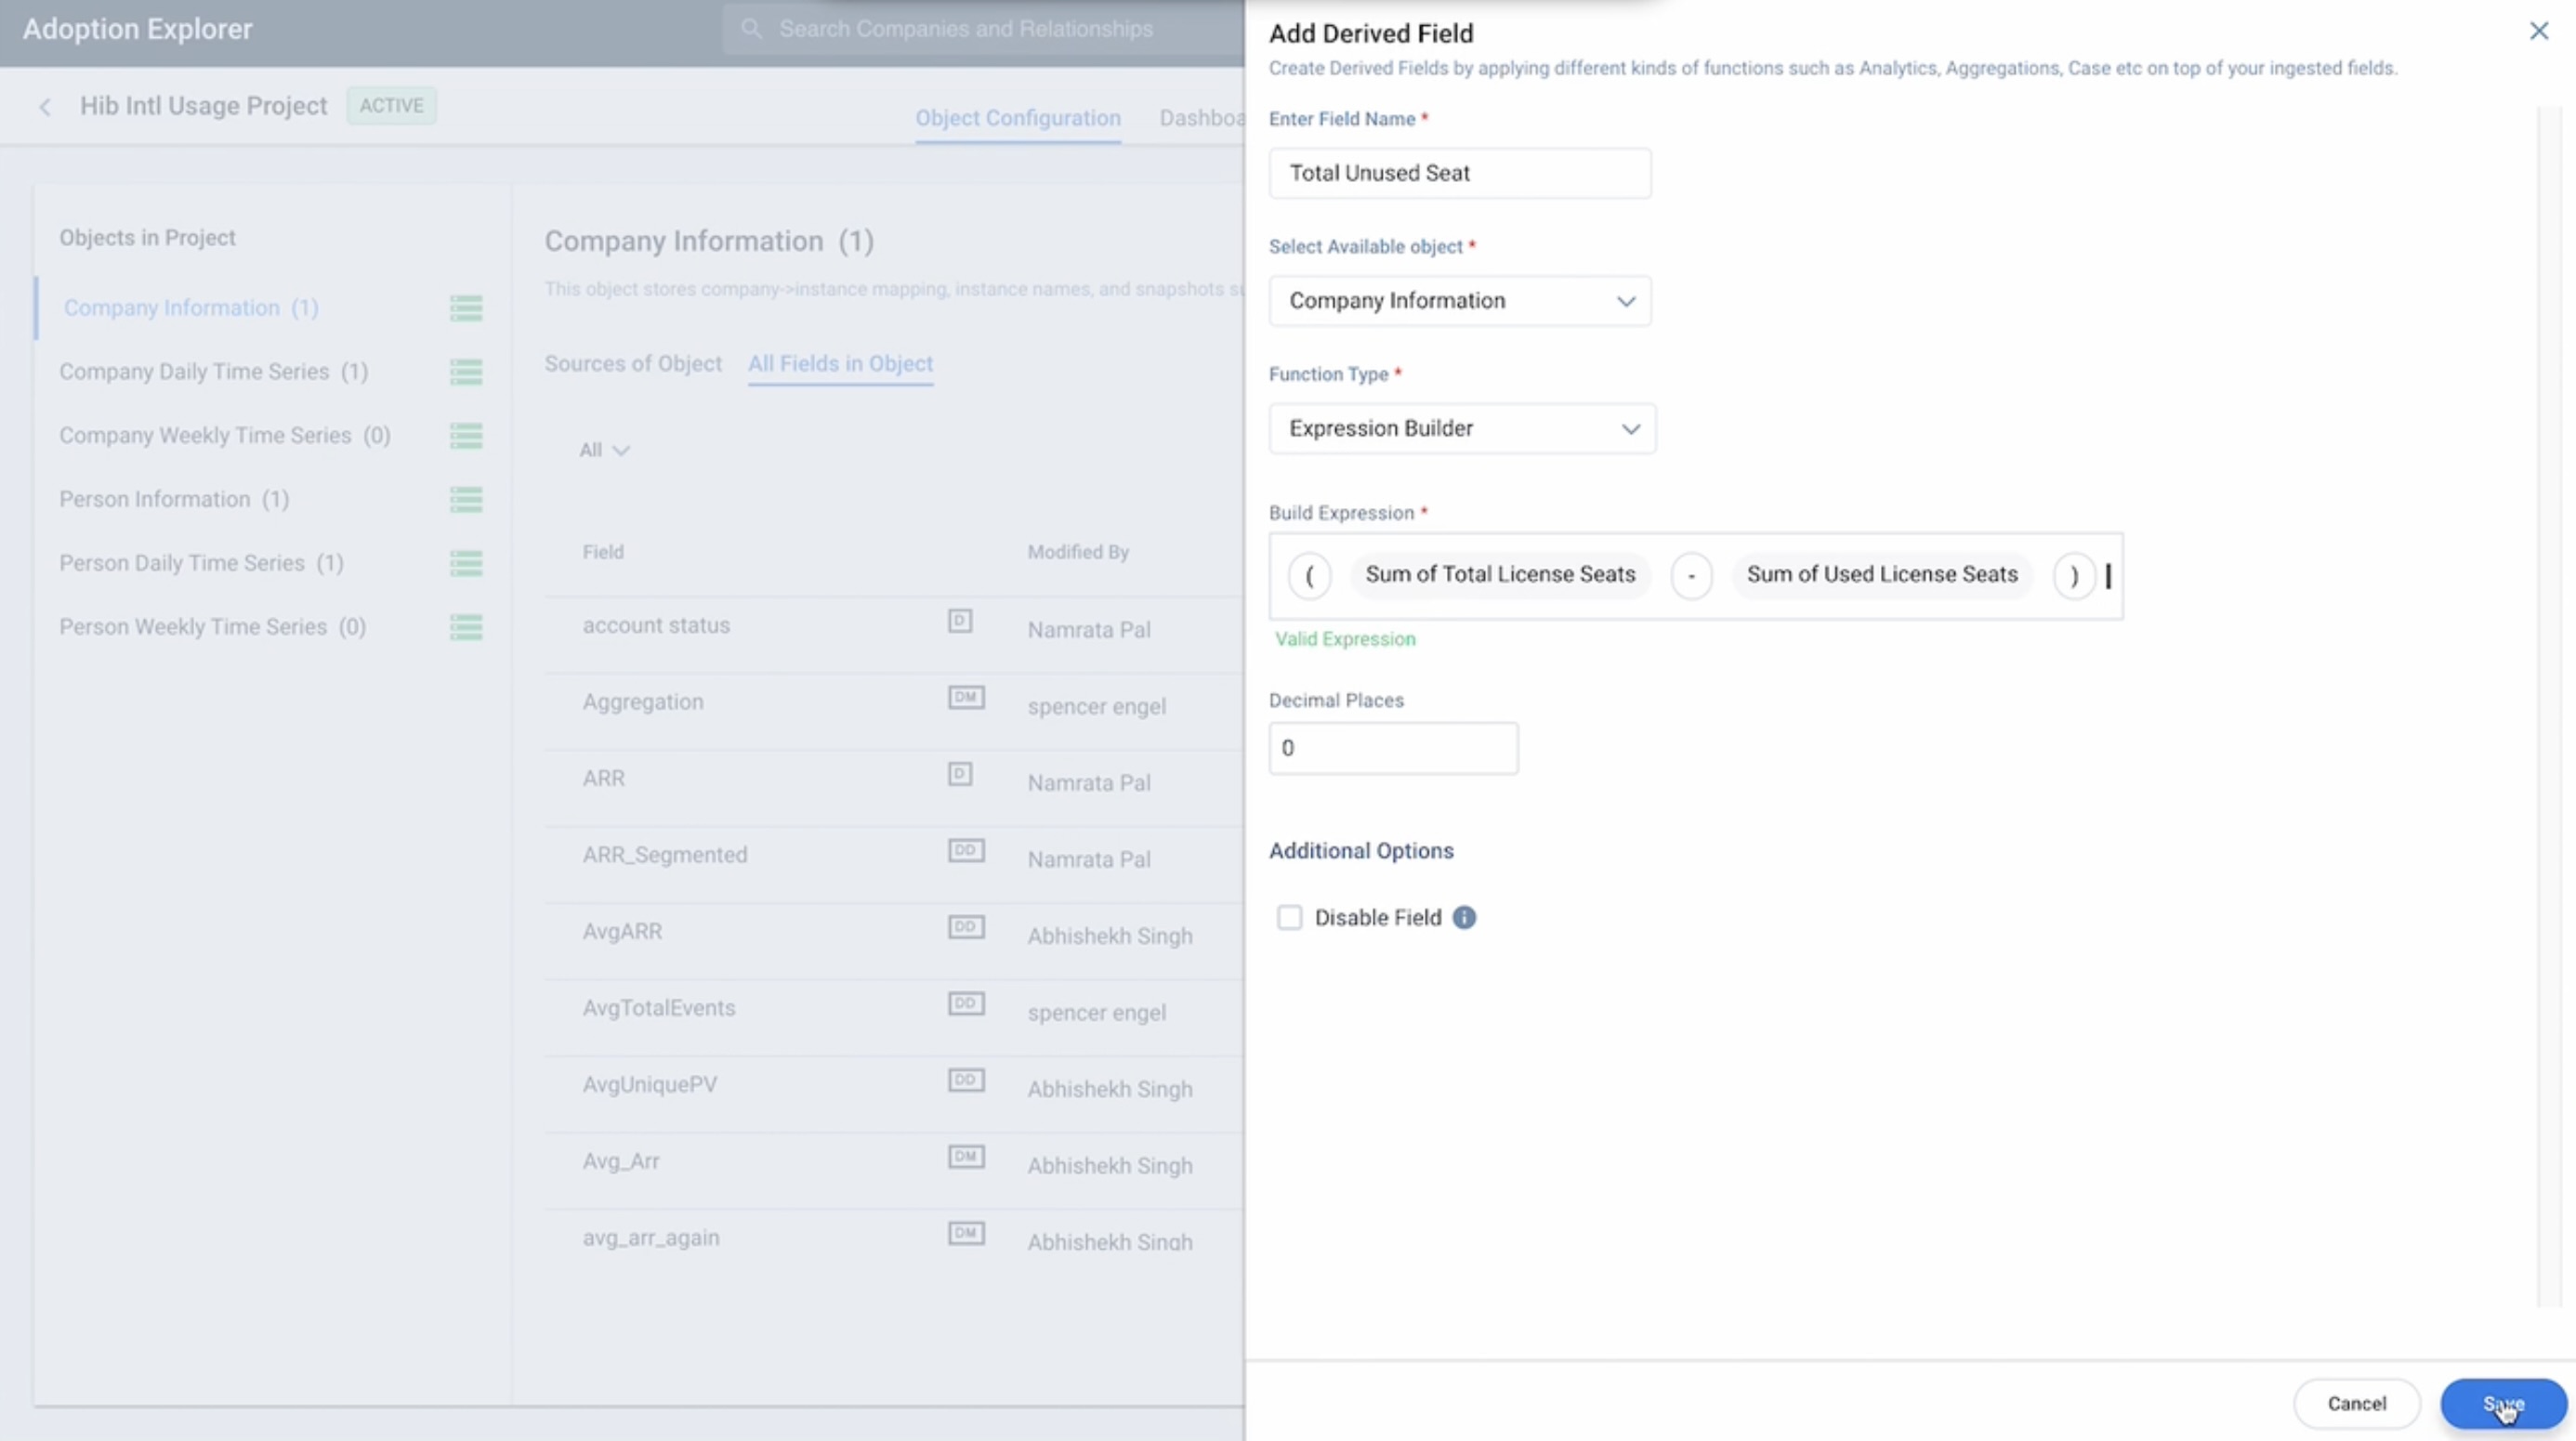
The following example on Numeric expressions guides you in calculating the number of unused licenses for a customer. The number of unused licenses is the difference between the Total number of assigned licenses and the Total number of Licenses used.
- Total number of Assigned Licenses = The number of licenses purchased by the customer.
- Total number of used Licenses = The number of licenses the customer is using actively.
- Unused Licensed Seats = Sum of Total Seats - Sum of Used Licensed Seats
To create Numerical Expression for this formula:
- Click Add Derived Field.
- In the Add Derived Field slide-out panel, perform the following:
- Enter the Field Name.
- Select the required source from the Select Available Object dropdown.
- From the Function Type field, select Expression Builder.
- In the Build Expression field, perform the following:
- Click inside the expression box to build an Expression.
- Select Brackets and click the open bracket icon.
- Select Fields and choose the required field from the dropdown. Here, to meet the business use case, select the Total Seats field.
- Select Operators and choose the required operator. Here, to meet the business use case, select - (subtraction).
- Select Fields and choose the required field from the Fields dropdown list. Here, to meet the business use case, select the Used Licensed Seats field.
- Select Brackets and click the close bracket icon. This completes the expression.
- Click Save.
In the Dashboard Configurations tab, while creating a usage report, you can now see the newly created Derived Field named Unused Licensed Seats in the Show Fields section. From the preview, you can now see the value of the unused licensed seats for a selected company.
You can also create complex expressions that include Aggregations. For example, you may want to calculate the percentage of Sum of Emails Opened over Sum of Emails Sent for a specific period of time.
Case Function
You can use Case Function to categorize data, based on a specific set of requirements. Case Functions can be created from the following locations in Adoption Explorer:
- From the All fields in Object tab to create an output field (Derived Field)
- From the Dashboard Configurations tab in Analytics/Analytics with Gainsight Milestones usage reports.
The output field created out of this Case Function has values for the records that match your specific set of requirements.
Anatomy of Case Expression:
- Case Function is made up of multiple cases.
- Every Case consists of multiple criteria. Each criterion is a specific requirement that any record should match. For example, a criteria for a customer to be classified as Detractor can be NPS® score between 0-6.
Every Case has an associated action when any record matches with the given criteria. A value (Example: Detractor) is populated in the Output field. This value can be a custom value or fetched from another field in the source dataset.
Execution of the Case Function detail:
- Execution of the Case Expression begins with the evaluation of the first case on a record. If all the criteria in this case are satisfied by the record, the action associated with this case is executed. The execution of Case Function halts here for this record and none of the other cases are evaluated.
- However, if the first case is not satisfied, the system evaluates the second case on the same record, and so on. If none of the available cases are satisfied by the record, the default case is executed.
This process is applied to all the records.
Default: The Case Function also has a default case. This default case does not have any criteria. It only has an action; Default action. You cannot delete the default case. When a record does not match any of the specified criteria, the action associated with the default case is executed.
Following is the list of fields in Case Function formula:
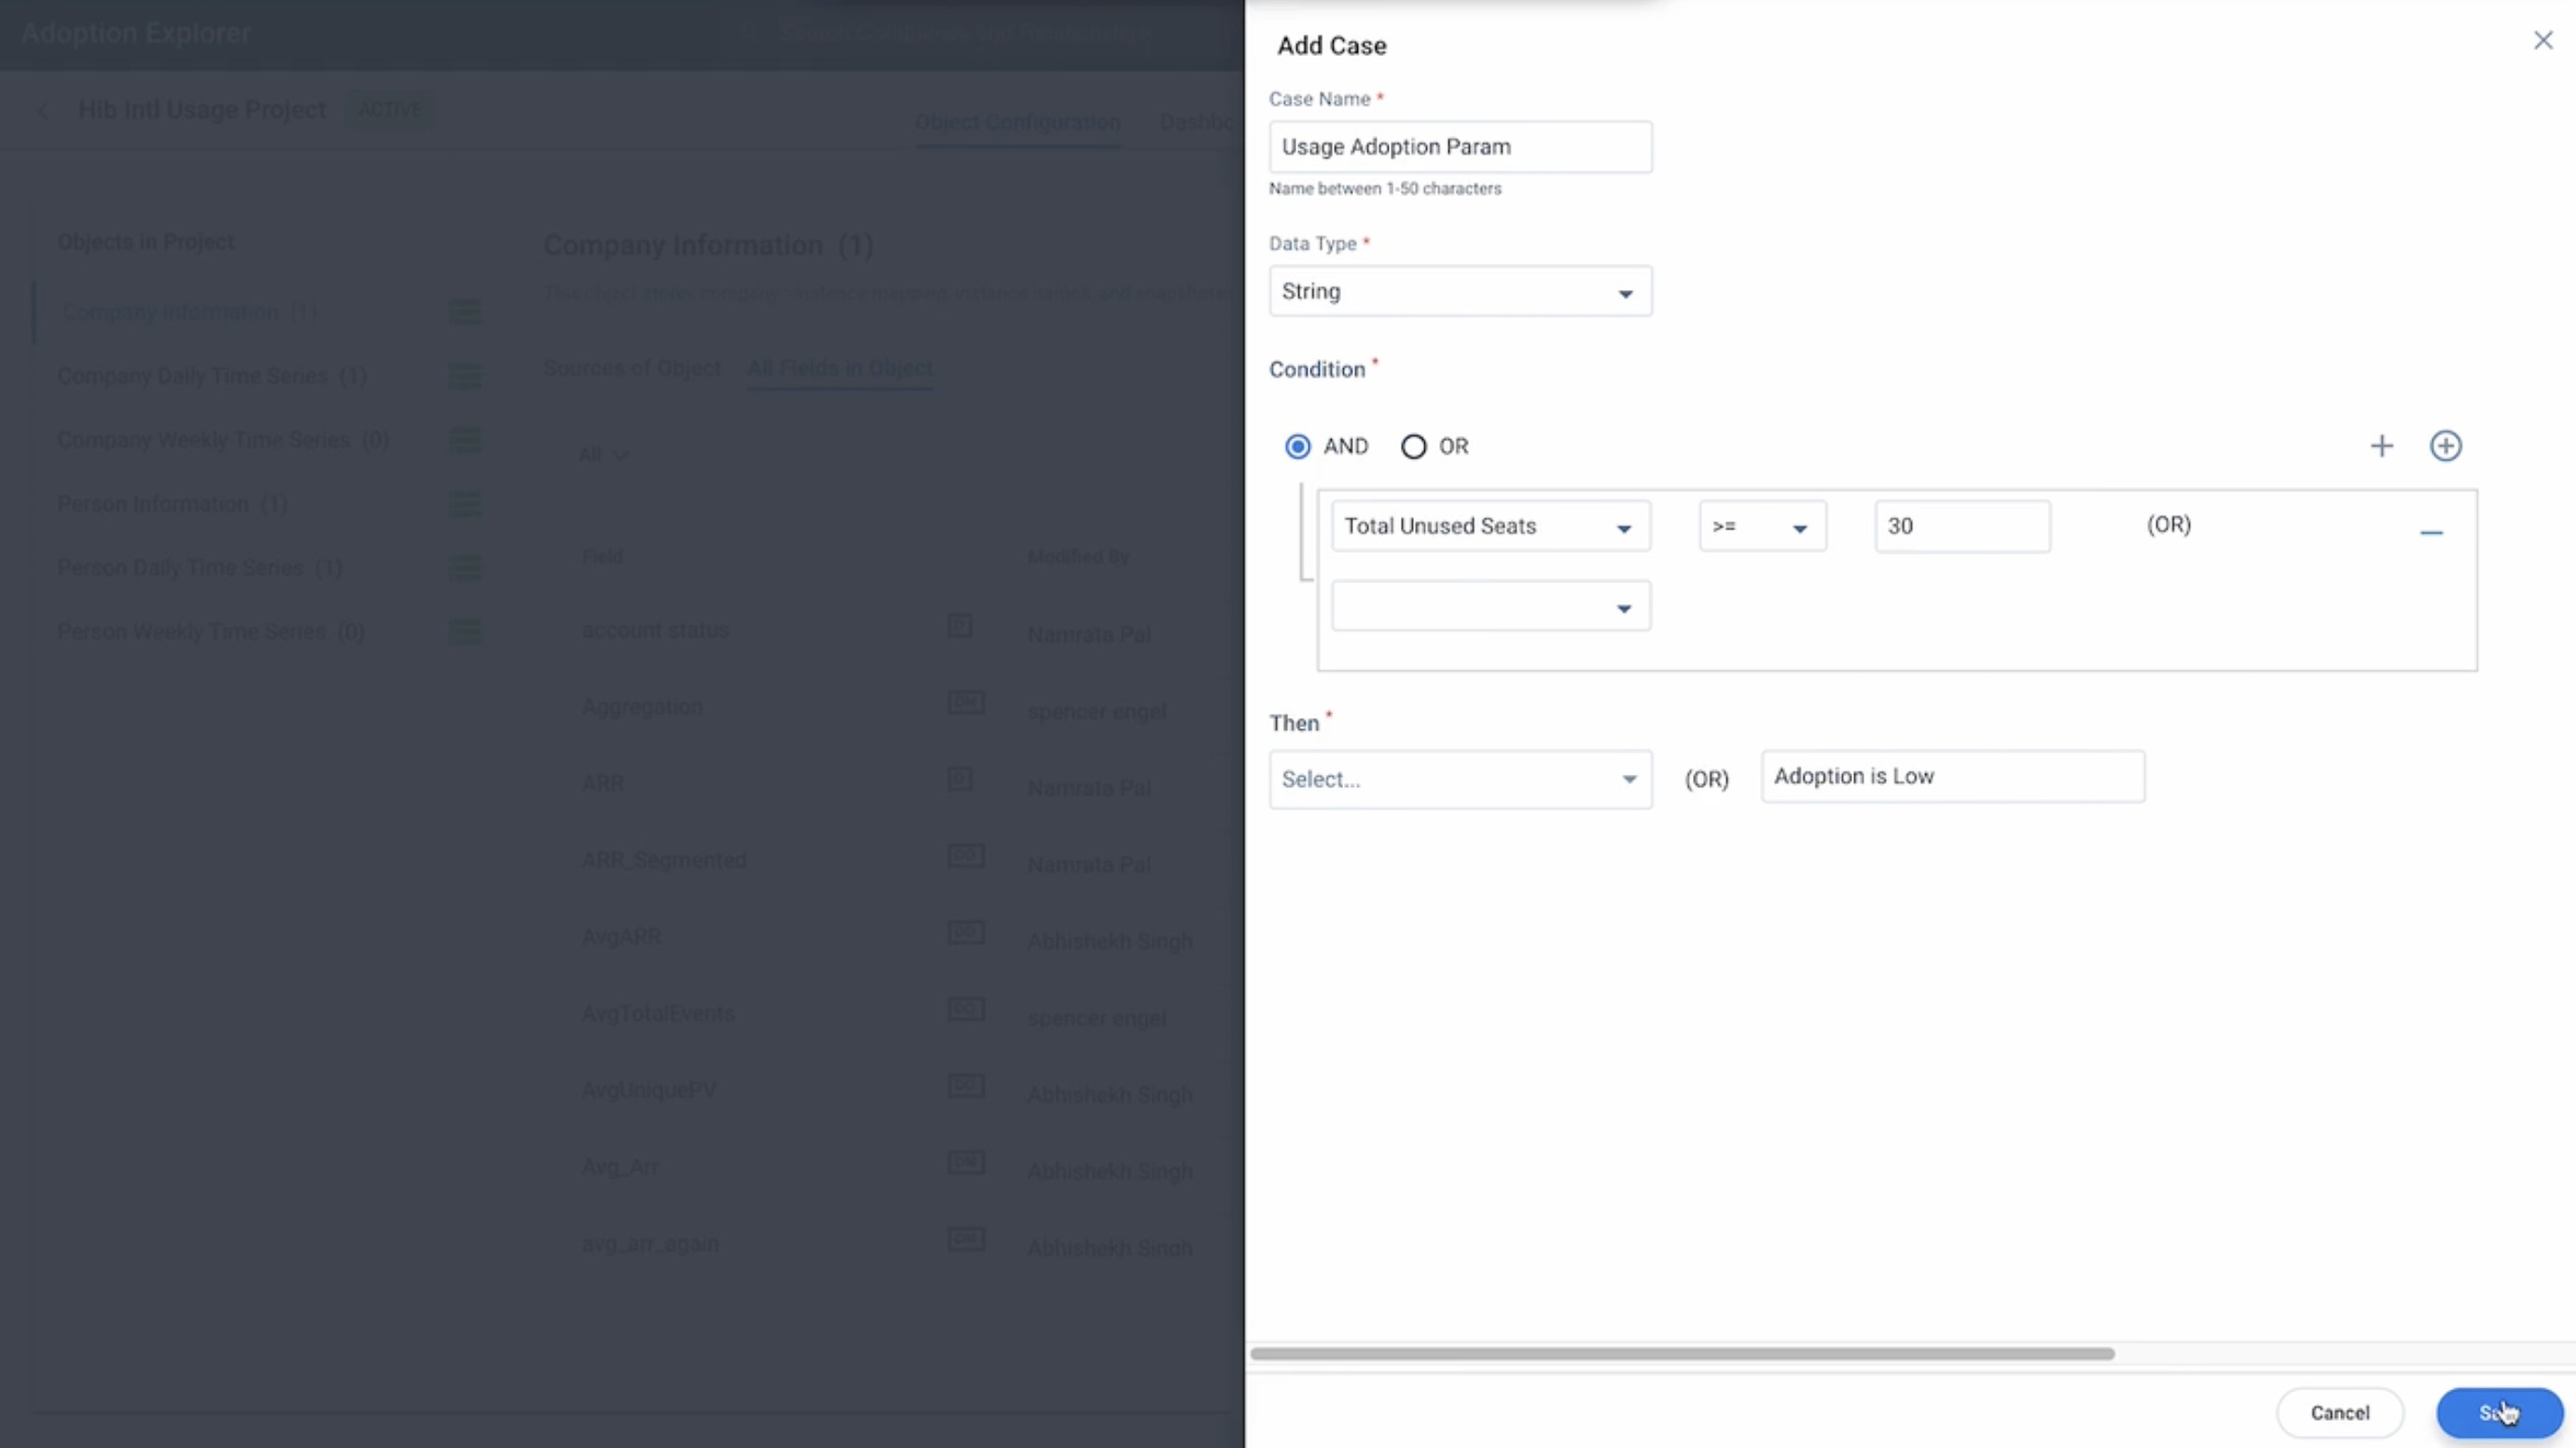
- Case Name: Enter a name for the Output column. This name is displayed on the final output page for the Case Expression result.
- Data Type: Select the data type for the output. The options present in the Case Output depends on the Output data type. The following data types are available:
- Boolean
- Number
- String
- Condition: Case consists of the Criteria(s). You can add multiple criteria by clicking +. The following fields are present in a criteria:
- Field: Select the field on which the Criteria must be applied. All the fields included in the Dataset are displayed here.
- Operator: Select an Operator to be applied on the field. The operators are displayed based on the field selected.
- Matching Criteria: Enter the value (matching criteria) which must be satisfied, for this criteria to be successful.
- Advanced Logic: When you have multiple criteria, select the logical operator to be applied between those criteria(s). By Default, the AND logic is applied.
- Multiple Cases: Click the rounded-plus icon to create multiple cases.
- Then: If all the criteria(s) are matched, the action specified in this field is executed. The options available in this field depend on the value selected in the Data Type field.
- (OR): If you select the Data Type as Number/String, you will see the (OR) field. You can enter a custom value in the (OR) field, if you want to execute either of the actions specified in Then or (OR).
- Default: This field represents the default case. There is no criteria for this case. It only has action. If all the cases fail, this case is executed.
In the following example, a Case Name called Usage Adoption is created. The Output Data Type for this is String. So, if there is a customer whose Unused Licensed Seats are greater than or equal to 30, the field displays Adoption is Low. For the rest of the customers, it displays High, which is the Default Case Action.
In the Dashboard Configuration tab, while creating a usage report, you can now see the newly created Derived Field named Usage Adoption in the Show Fields section. From the preview, you can now know if the adoption is low or high for a selected company.
Similarly, you can also apply Case Functions from the Dashboard Configuration tab (in the Analytics/Analytics with Gainsight Milestones usage reports).
Date
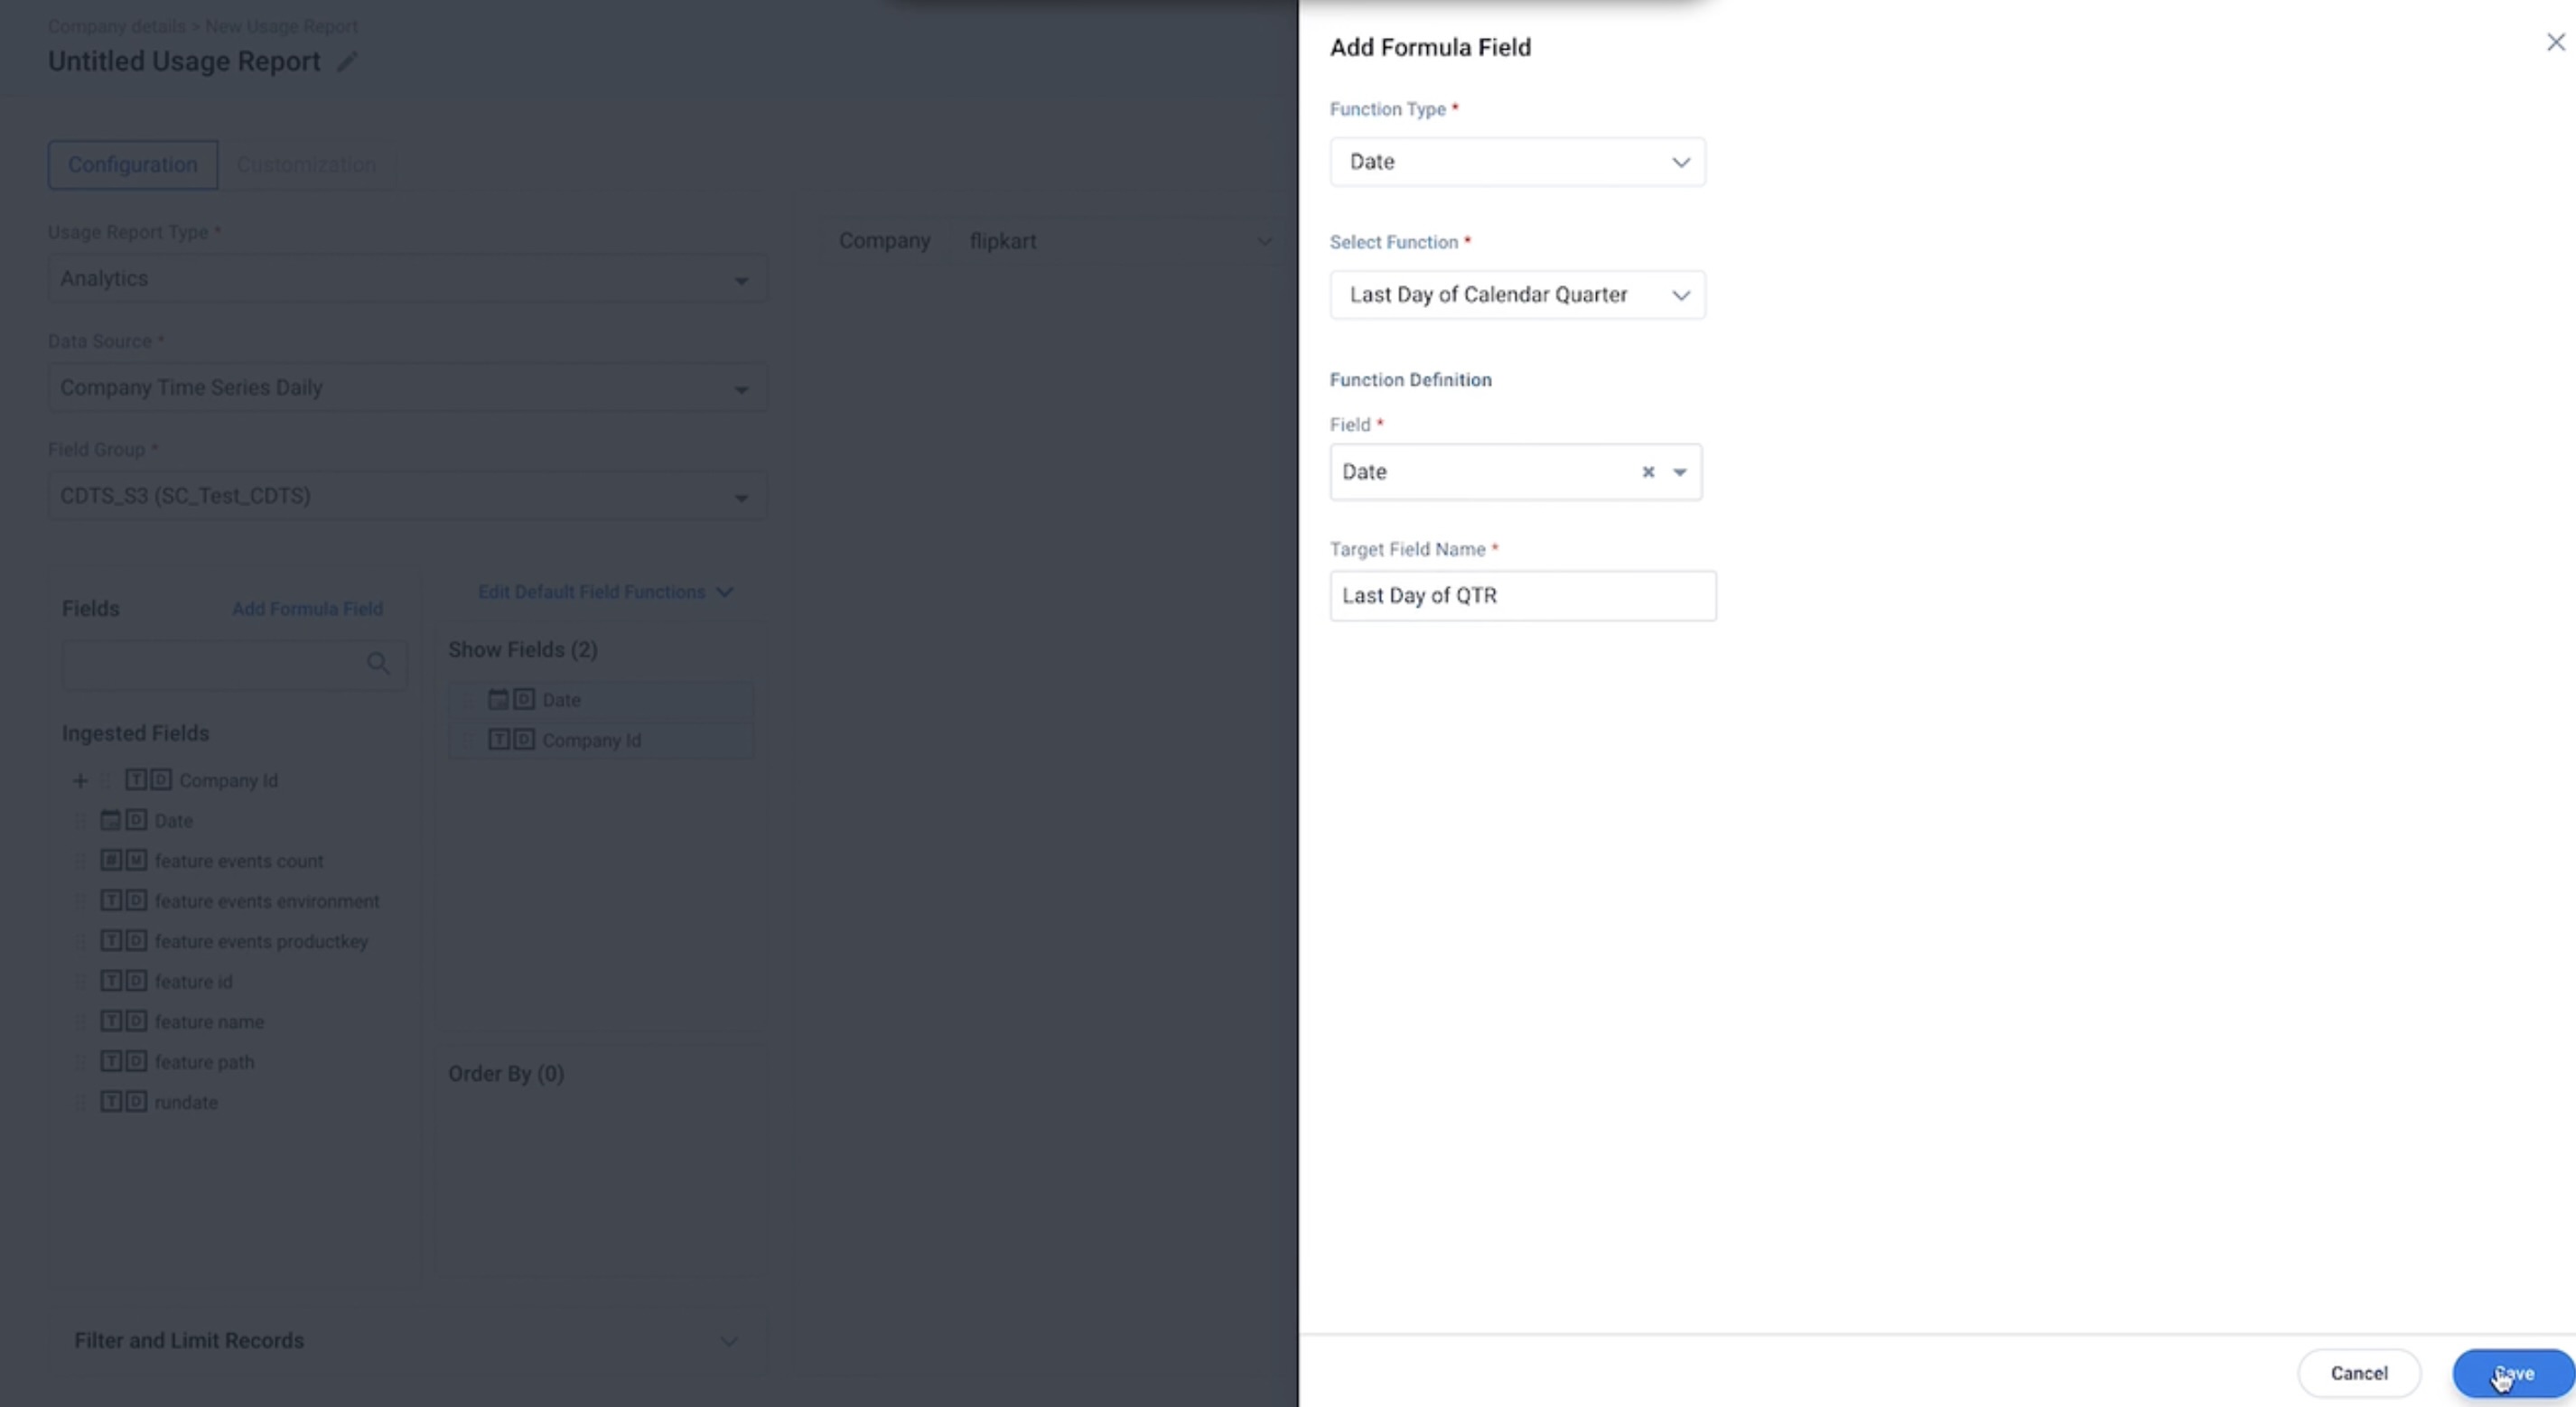
Date Function in Adoption Explorer Dashboards helps you adjust date ranges as required, such as: Start of Week, Month, Quarter, Year, etc. For example, CSMs might want to know how a Product is being adopted by their customers on a quarterly basis, to inform their priorities. Using the Last Day of Calendar Quarter date function, you can create a usage report to see the number of Page Views for each quarter (that ends on the last day of every quarter). CSMs can then analyze the adoption rate, and accordingly send out Surveys to gather feedback, if the adoption is low, or trigger CTAs to work on increasing the adoption.
Note: You can apply Date Functions only on the Time Series and Entitlement Objects.
To use a Date function:
- Navigate to Adoption Explorer > Administration.
- Click the required project.
- In the Dashboard Configuration tab, select the dashboard in which you want to add a usage report.
- Click the Edit Dashboard icon from the top-right corner.
- In the Dashboard detail view, click New Usage Report.
- From the Usage Report Type dropdown list, select Analytics.
- From the Data Sources dropdown list, select the required object.
- Add the required fields in the Show Fields section.
- From the Fields section, click Add Formula Field.
- From the Function Type dropdown, select Date.
- From the Select Function dropdown, select a Function. Here, to solve this use case, select Last Day of Calendar Quarter.
- From the Field dropdown, select Date.
- In the Target Field Name field, enter the name of your choice.
- Click Save.
Note: Click Show Preview and select the Date Range as 365 days to see the report on Page Views data for each quarter, and click Save. If required, you can add this report to the C360 page and monitor usage adoption.
The following is a list of Date Functions supported by Adoption Explorer:
- Add N Months To Start of Month: Adding a value N to a date returns the Start of the Month after N months. For example, Date(11/20/2019) with a Value as 1 will return “12/01/2019” as the output.
- Subtract N Months To Start of Month: Subtracting a value N from a date returns the Start of the Month before N months. For example, Date(11/20/2019) with a Value as 1 will return 10/01/2019 as the output.
- Add N Months To End of Month: Adding a value N to a date returns the End of the Month after N months. For example, Date(11/20/2019) with a Value as 1 will return 12/31/2019 as the output.
- Subtract N Months To End of Month: Subtracting a value N from a date returns the End of the Month before N months. For example, Date(11/20/2019) with a Value as 1 will return 10/31/2019 as the output.
- First Day of Month: Returns the first day of the Current Month. For example, First Day of Month(3/27/2019) will return 3/1/2019 as the output.
- Last Day of Month: Returns the last day of Current Month. Returns the last day of the Month. For example, Last Day Of Month(3/27/2019) will return 3/31/2019 as the output.
- First Day of Previous Month: Returns the first day of the Previous Month. For example, First Day of the Previous Month(3/27/2019) will return 2/1/2019 as the output.
- Last Day of Previous Month: Returns the last day of the Previous Month. For example, Last Day of the Previous Month(4/27/2019) will return 3/31/2019 as the output.
- First Day of Next Month: Returns the first day of Next Month. For example, First Day of Next Month(3/27/2019) will return 4/1/2019 as the output.
- Last Day of Next Month: Returns the last day of Next Month. For example, Last Day of Next Month(2/27/2019) will return 3/31/2019 as the output.
- First Day of Week: Returns the first day of the Current Week.
- Last Day of Week: Returns the last day of Current Week.
- First Day of Previous Week: Returns the first day of the Previous Week.
- Last Day of Previous Week: Returns the last day of the Previous Week.
- First Day of Next Week: Returns the first day of Next Week.
- Last Day of Next Week: Returns the last day of Next Week.
- Get Year: Returns the Year from the date record as output.
- Get Month: Returns the Month from the date record as output.
- Get Weekday: Returns the Weekday from the date record as output.
- First Day of Calendar Year: Returns the first day of Calendar Year as output.
- Last Day of Calendar Year: Returns the last day of Calendar Year as output.
- First Day of Calendar Quarter: Returns the first day of Calendar Quarter as output.
- Last Day of Calendar Quarter: Returns the last day of Calendar Quarter as output.
- Add N Days: Add a value to a date in the specified interval. For example, Date(3/27/2019) with a Value as 1 will return 3/28/2019 as the output.
- Subtract N Days: Subtract a value from a date in the specified interval. For example, Date(3/27/2019) with a Value as 1 will return 3/26/2019 as the output.
- Date Difference: This function returns the difference between the two selected dates. The output is always returned in numerical format (number of days).
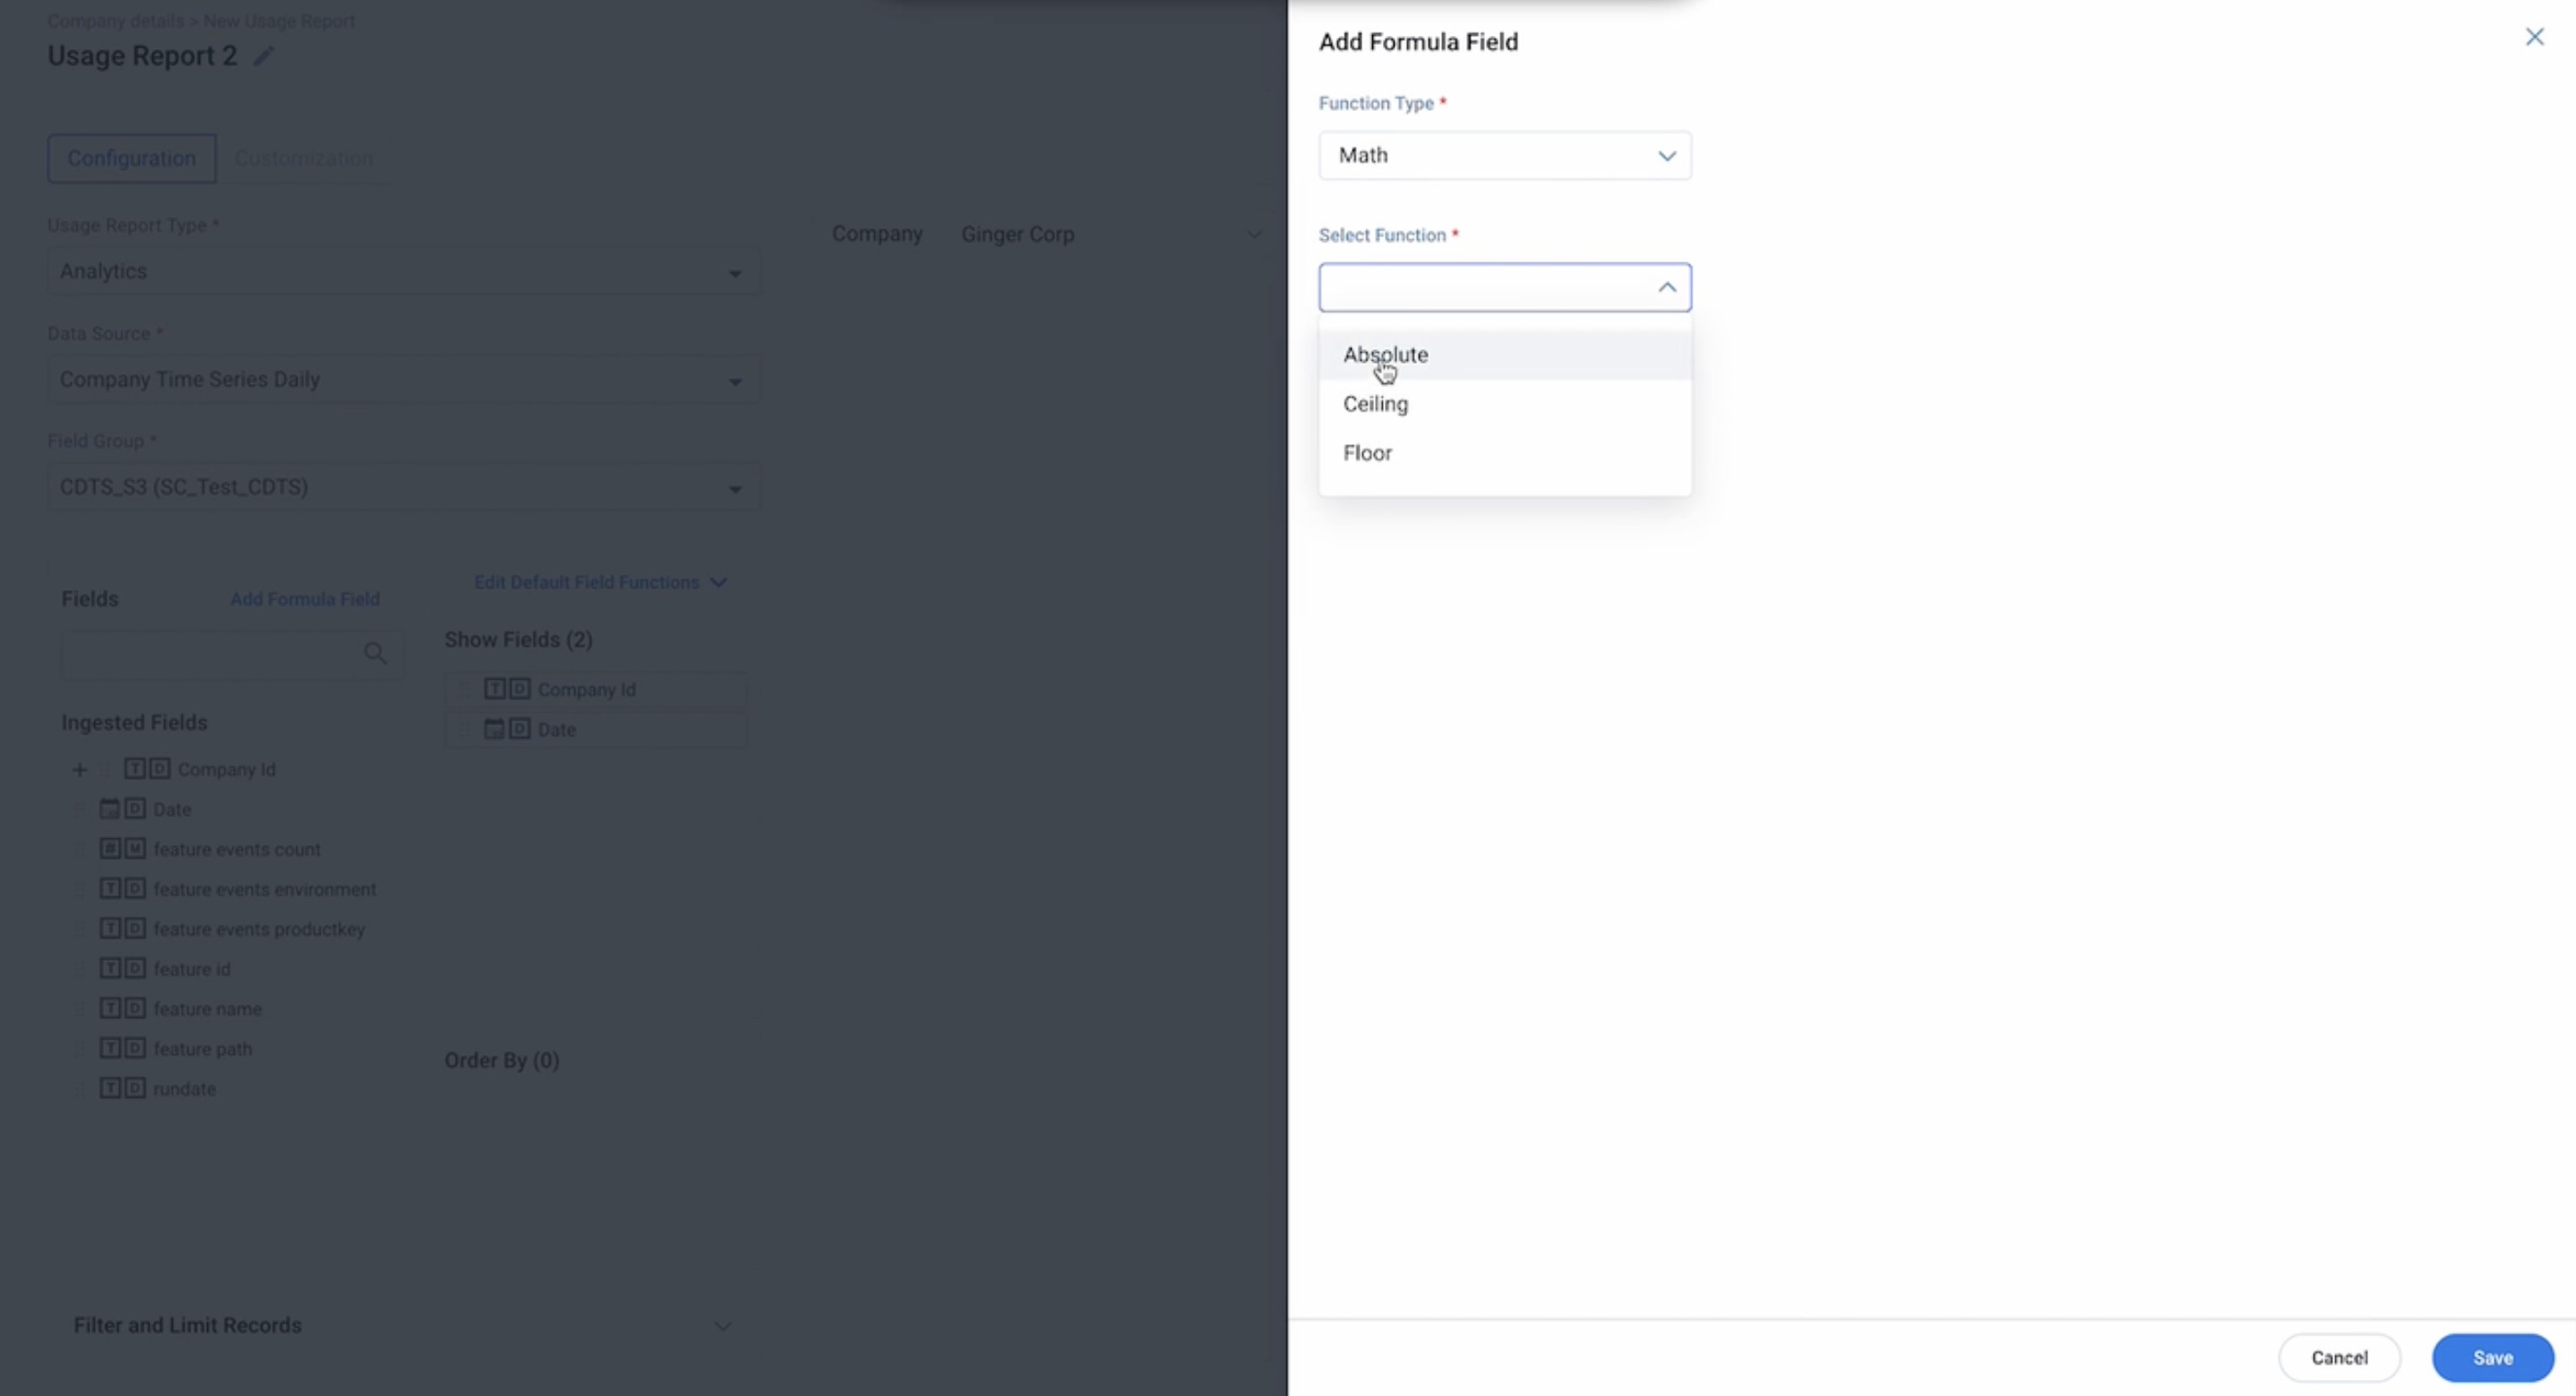
Math
Math functions are enabled in Analytics Usage Report, and admins can apply these functions on a selected numeric field to view the Absolute, Ceiling, and Floor values based on their business need.
Note: This function is allowed only in the Usage Dashboards (Analytics Usage Report), and not while creating a Derived Field.
In Math Functions, you have the following options available:
- Absolute: To get the Absolute value of a number field. For example, if the record value is 5.80, then the Absolute Value is also 5.80.
- Ceiling: To get the Ceiling value of a number field. For example, if the record value is 5.80, then the Ceiling Value is 6.
- Floor: To get the Floor value of a number field. For example, if the record value is 5.80, then the Floor Value is 5.
Additional Resources
- Fields and Derived Fields in Object
- Create Usage Report in a Dashboard.
- Create Dashboards in a Project
- Configure Usage Section in C360
| NPS, Net Promoter, and Net Promoter Score are registered trademarks of Satmetrix Systems, Inc., Bain & Company and Fred Reichheld. |