Rules Analyzer Admin Overview
Gainsight NXT
Overview
Rules Analyzer enables Gainsight Admins to identify the rules which cause failures or identify inefficiencies in performance. It also includes recommended actions to improve performance. This helps Gainsight Admins to analyze which Rules are broken and need debugging. This helps analyse how the rules in an Org are performing by consolidating rules, merging rules, and reducing actions. Gainsight Admins can also schedule rules for optimum performance.
Perform the following steps to use Rules Analyzer:
Navigate to Administration > Analyzer > [click on Object Analyzer icon on the left].
The Rules Analyzer contains the following tabs:
Dashboard
The Rules Analyzer dashboard displays data on rule executions, audits, and schedules. You can also view options to compare how a rule has run from one day to the next. The dashboard contains the following sub-tabs:
Execution & Audit Trend
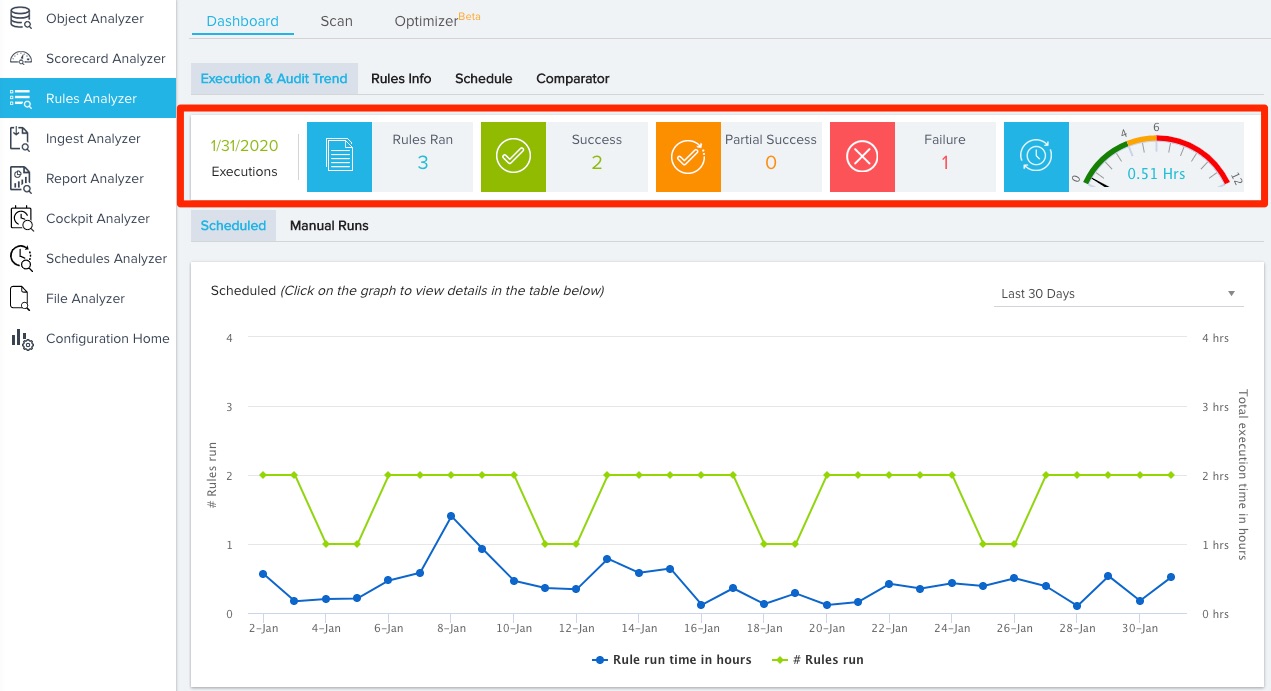
This tab displays reports for rule run time, execution stats, and audit stats. At the top of the tab is a summary of rule executions for the current date. This summary displays the number of rules run, successful rules, partially successful rules, rule failures, and total amount of rule run time.
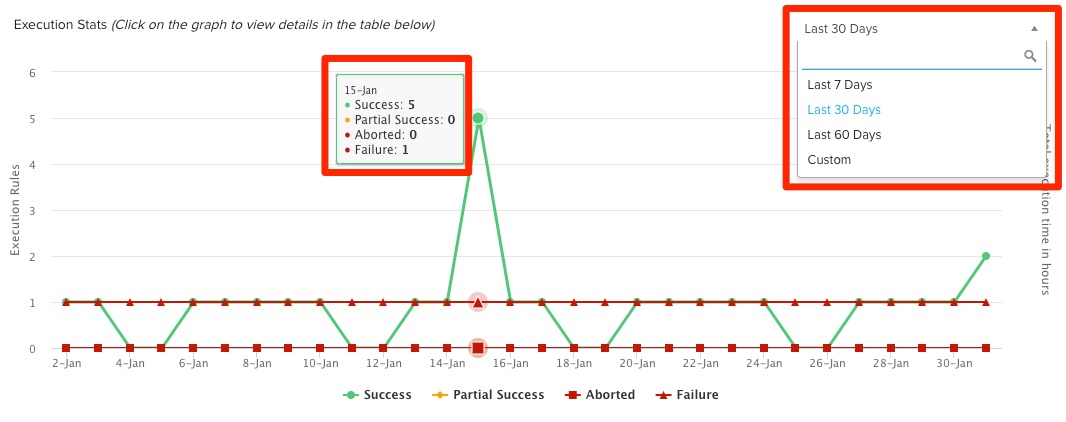
For each report, you can configure the time range using the dropdown menu in the top right. You can also hover over the datapoint of each report to view granular data. The type of data displayed depends on the report being viewed.
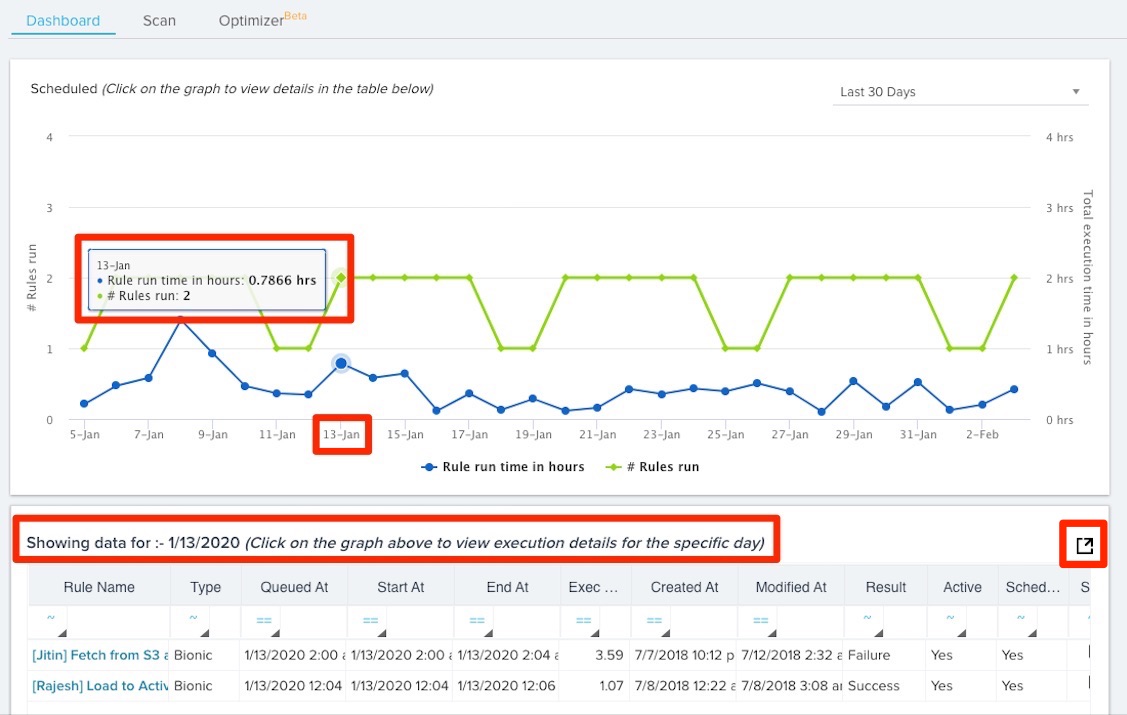
You can click any datapoint in each graphical report to display a more detailed break down of the data in a tabular report that’s immediately below. These tabular reports display the date of the data it is showing and includes an entry for each rule. You can export any of these tabular reports as .xlsx files by clicking the export button.
Rule Run Time Report
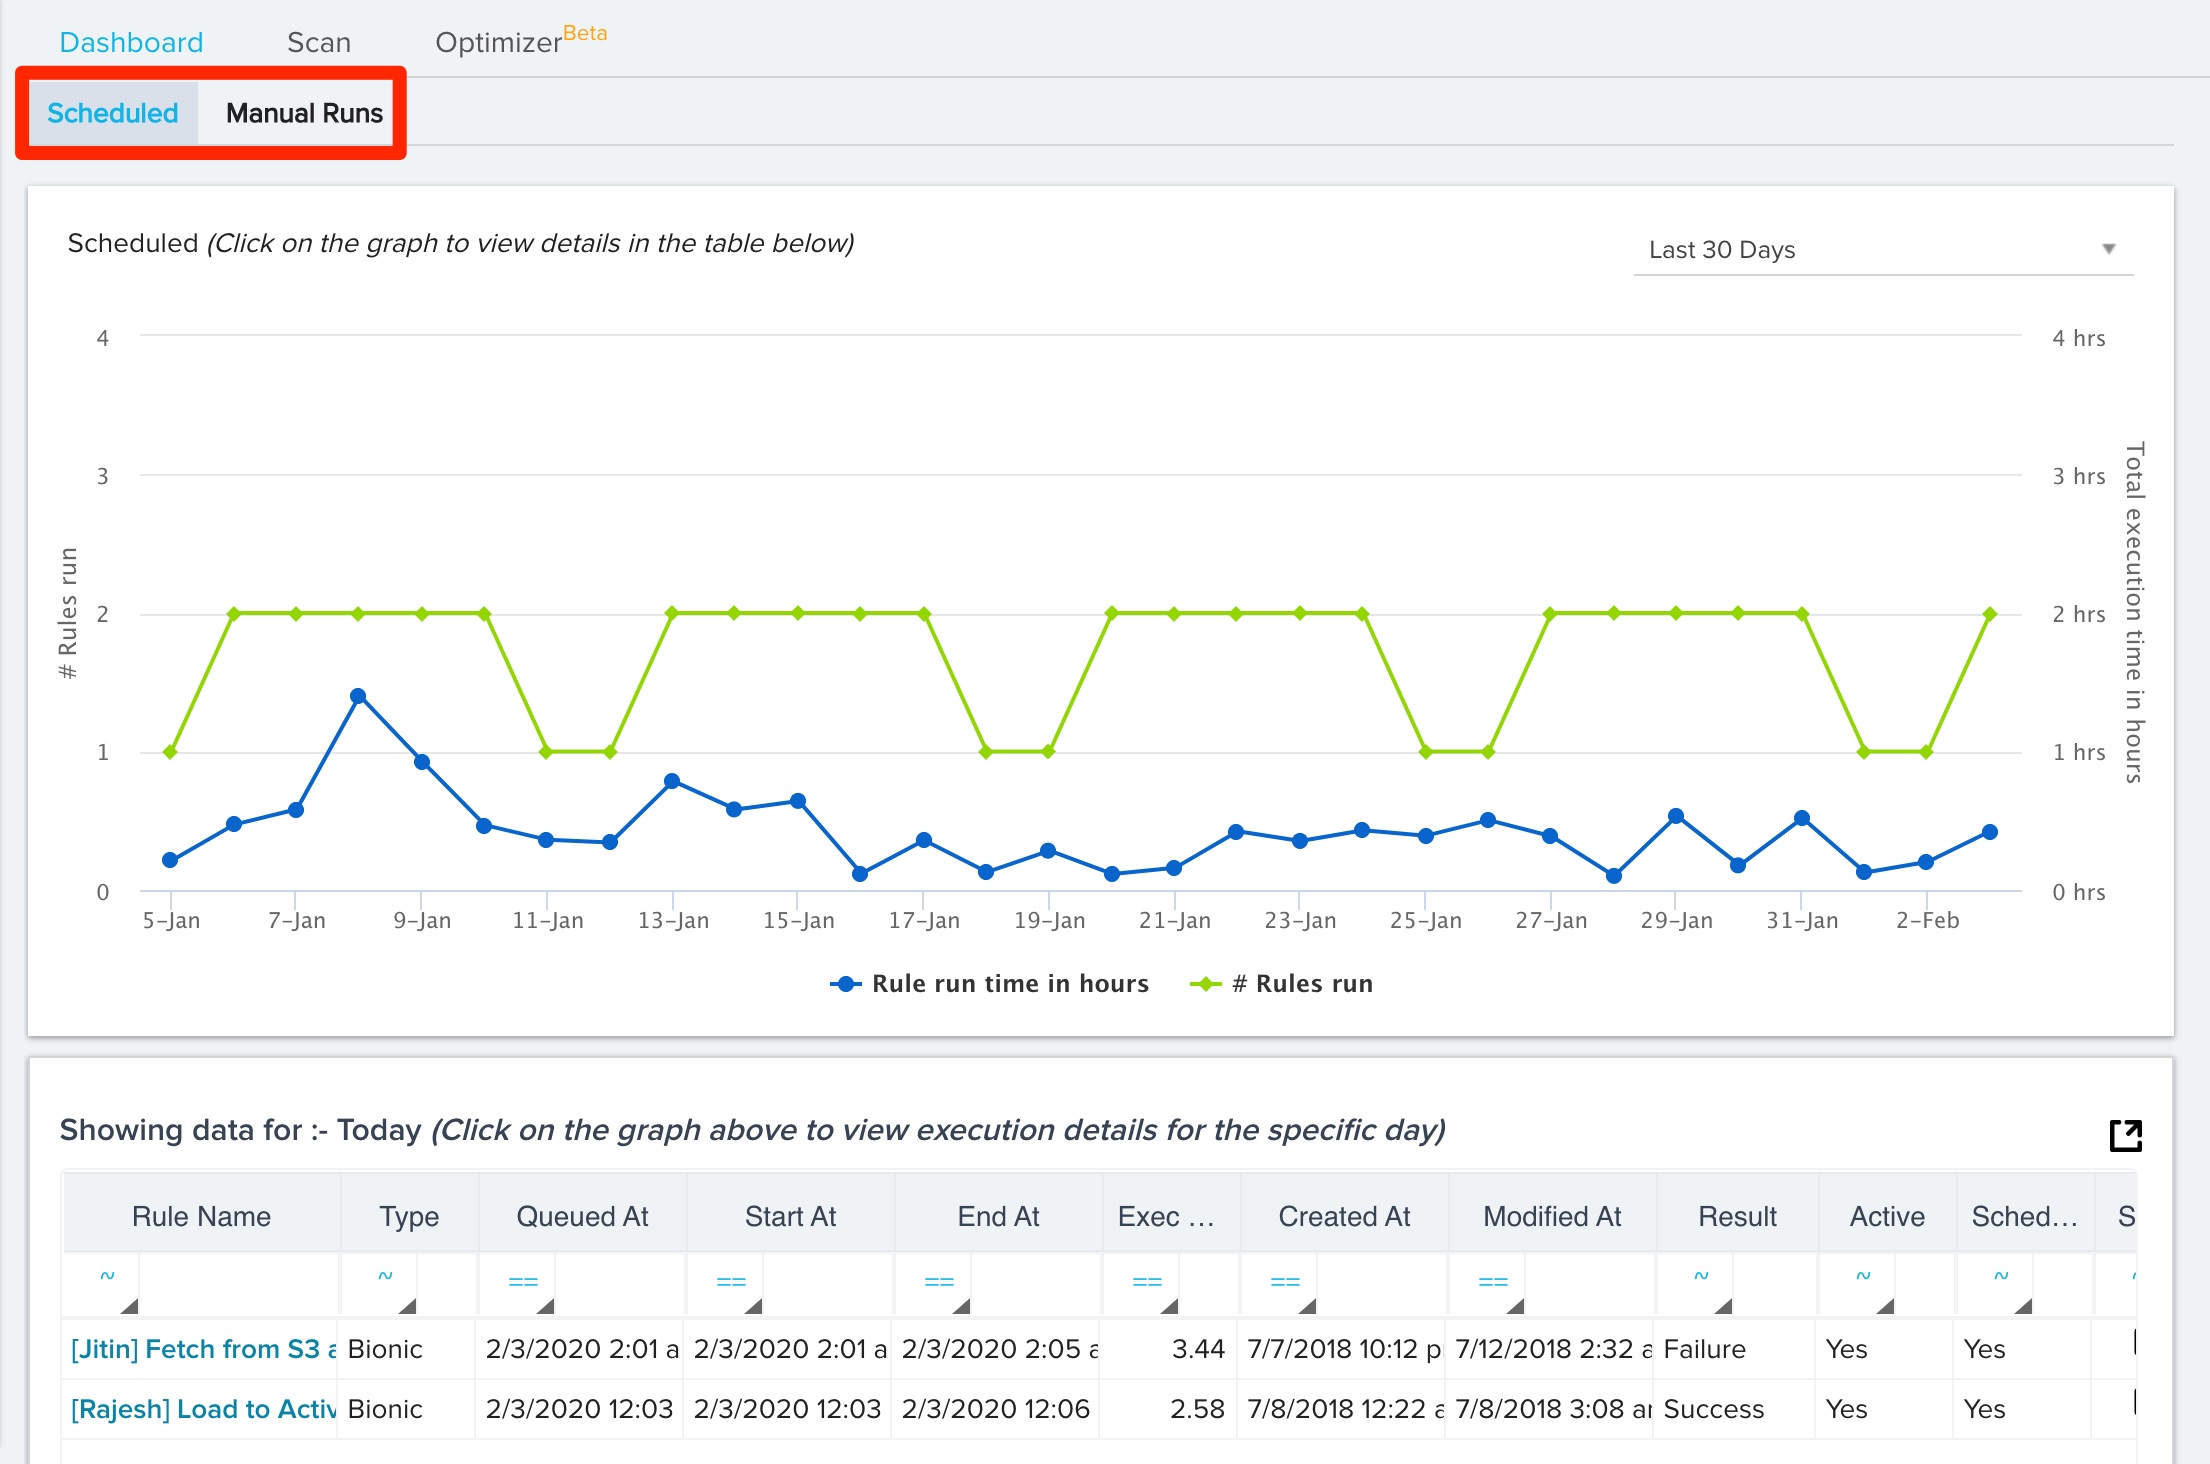
The graphical Rule Run Time Report displays the total run time for all rules by date. You can configure the report to display data from either scheduled rule runs or manual rule runs.
Each datapoint in the graphical report contains the total rule time in hours, as well as the number of rules ran for that specific date.
Each entry in the Rule Run Time tabular report displays the rule’s name, type, queued date/time, start date/time, end date/time, execution time, created date/time, modified date/time, run result, active status, scheduled status, and a button to scan the rule.
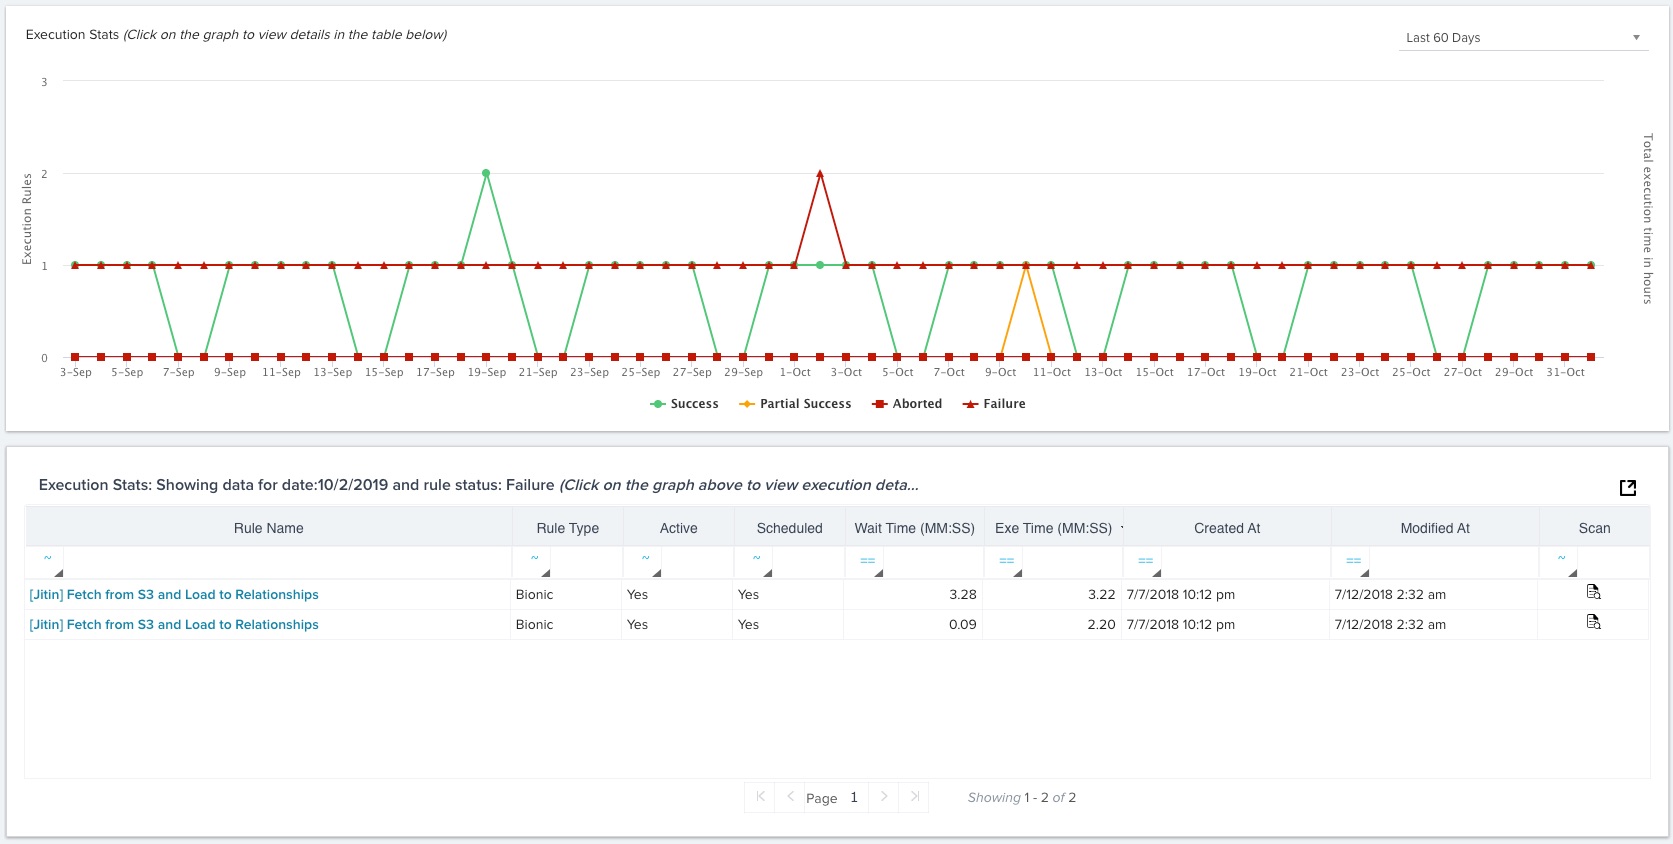
Execution Stat Report
This report displays the execution status for all rules by date. Each data point of the report contains the number of rules ran for each date by execution status.
Each entry in the tabular Execution Stat Report displays the rule’s name, type, active status, scheduled status, wait time, execution time, created date/time, modified date/time, and a button to scan the rule.
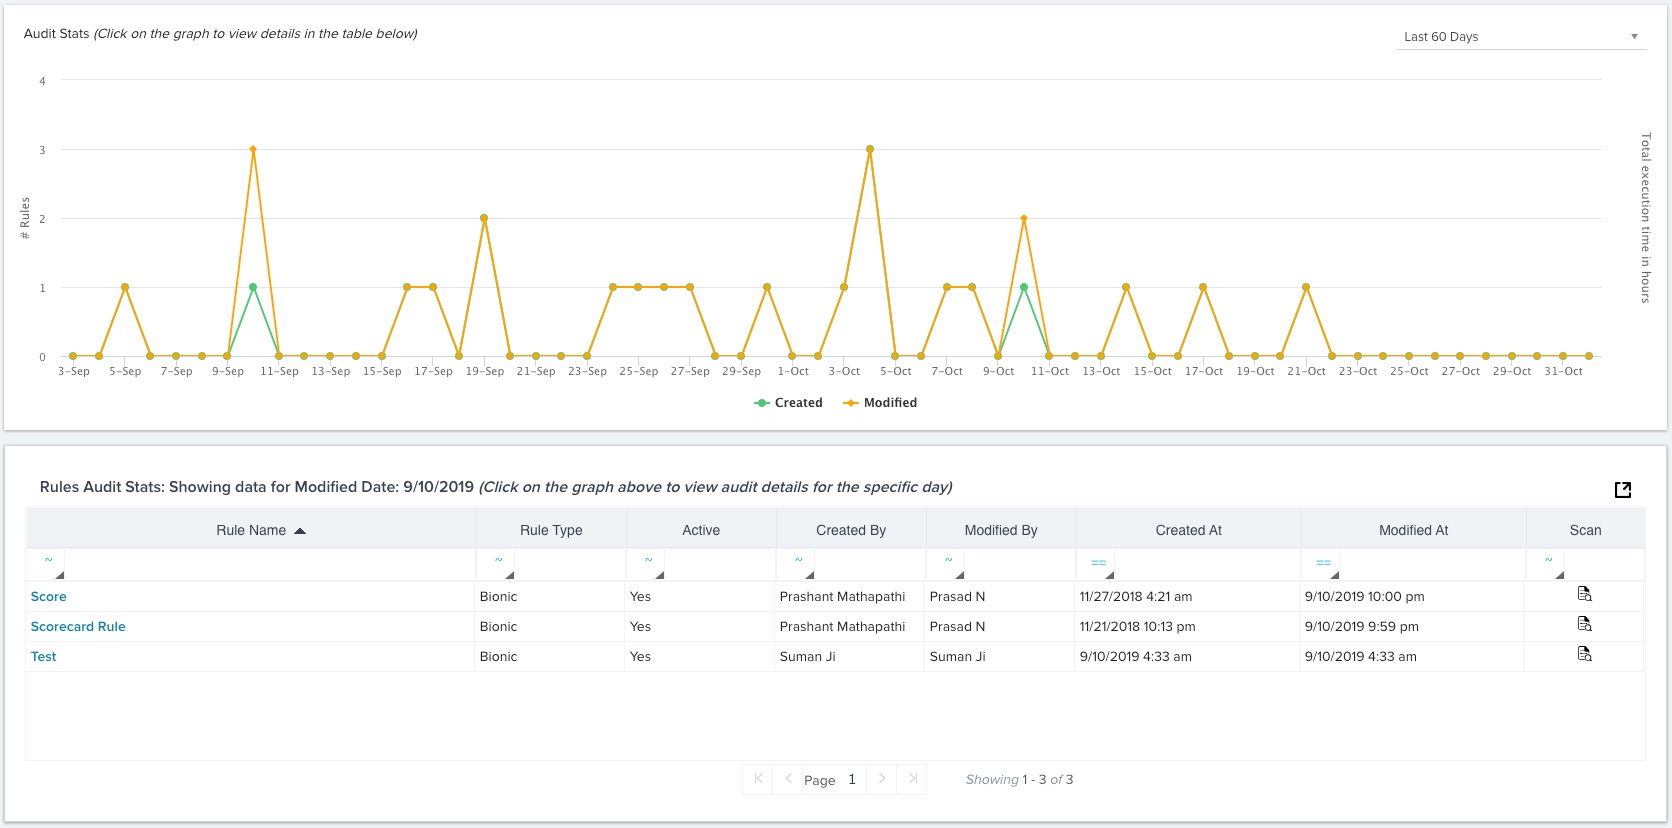
Audit Stat Report
This report displays the number of created and modified rules by date. Each datapoint in the graphical Audit Stat Report contains the number of rules created and modified.
Each entry in the tabular Audit Stat Report includes the rule’s name, type, active status, created by user, modified by user, created date/time, modified date/time, and a button to scan the rule.
Rules Info
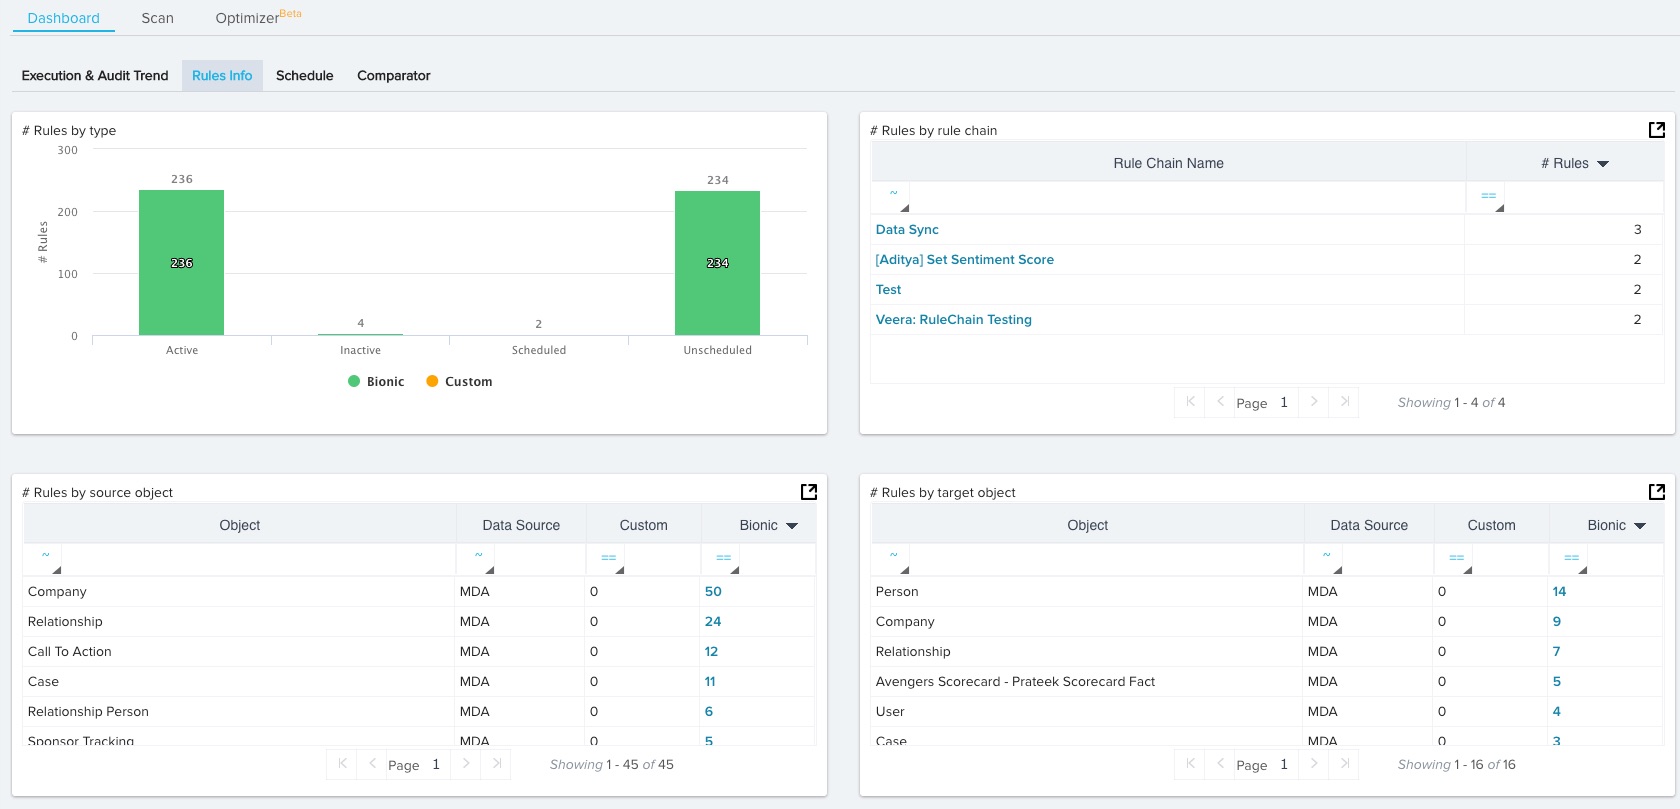
This tab displays rule data in the following reports:
-
Number of Rules by Type: Displays the number of Bionic and Custom rules by active and scheduled status. You can click the labels for Bionic and Custom rules to hide or display the associated data.
-
Number of Rules by Rule Chain: Displays an entry for each rule chain including the name of the chain and the number of rules associated with it. You can export this report as a .xlsx file by clicking the export button.
-
Number of Rules by Source Object: Displays an entry for each rule source object including the name of the object, the data source of the object, and the number of custom and bionic rules built off of the object. You can export this report as a .xlsx file by clicking the export button.
-
Number of Rules by Target Object: Displays an entry for each rule target object including the name of the object, the data source of the object, and the number of custom and bionic rules built to target the object. You can export this report as a .xlsx file by clicking the export button.
Schedule
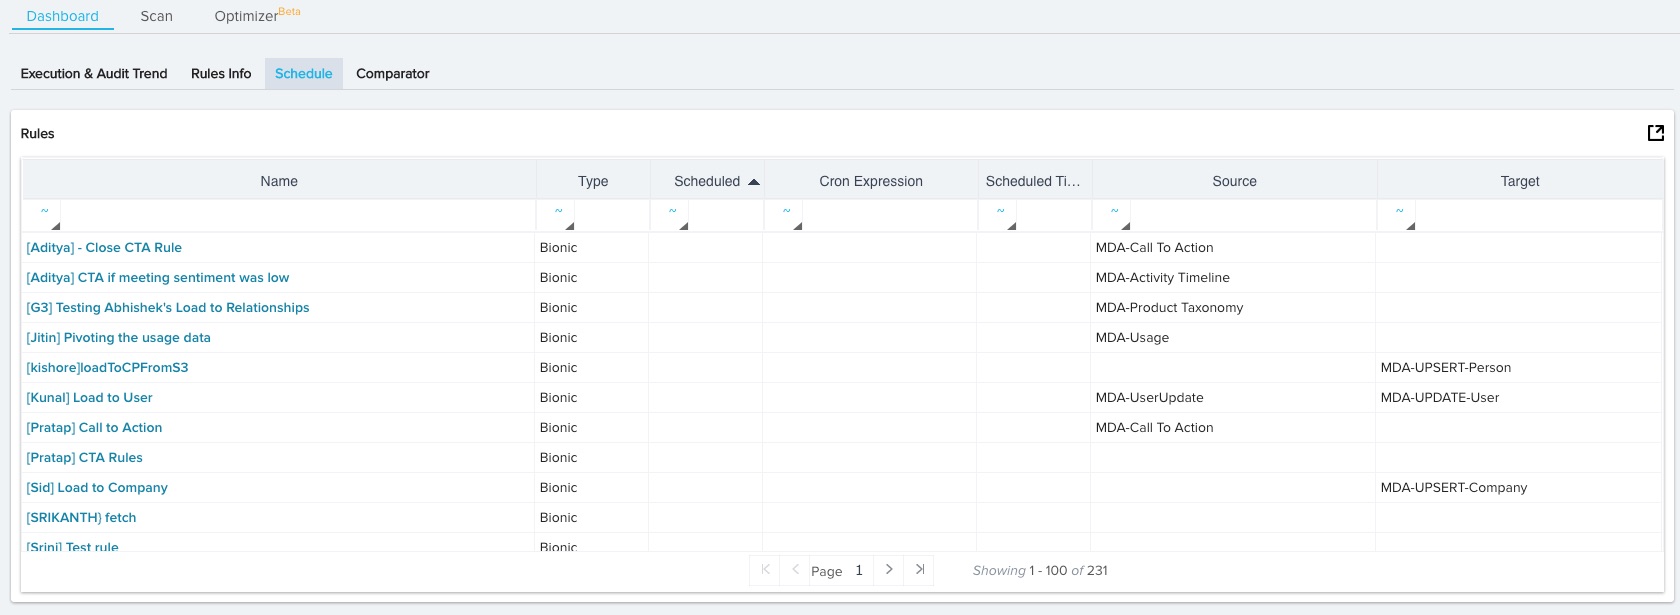
Scheduling a rule at the right time is critical to its success. However, arriving at the right sequence of when to run a rule is difficult when an Org is running hundreds of rules. The Schedule feature analyses the rules based on several factors (such as runtime, prerequisite rules, etc) to arrive at the best sequencing possible for the best utilization. This can help the Admin know the right sequence in which the rules should be scheduled for reducing overall execution time.
The column on the left of the screen provides the order in which the rules can be scheduled for optimum performance.
Comparator
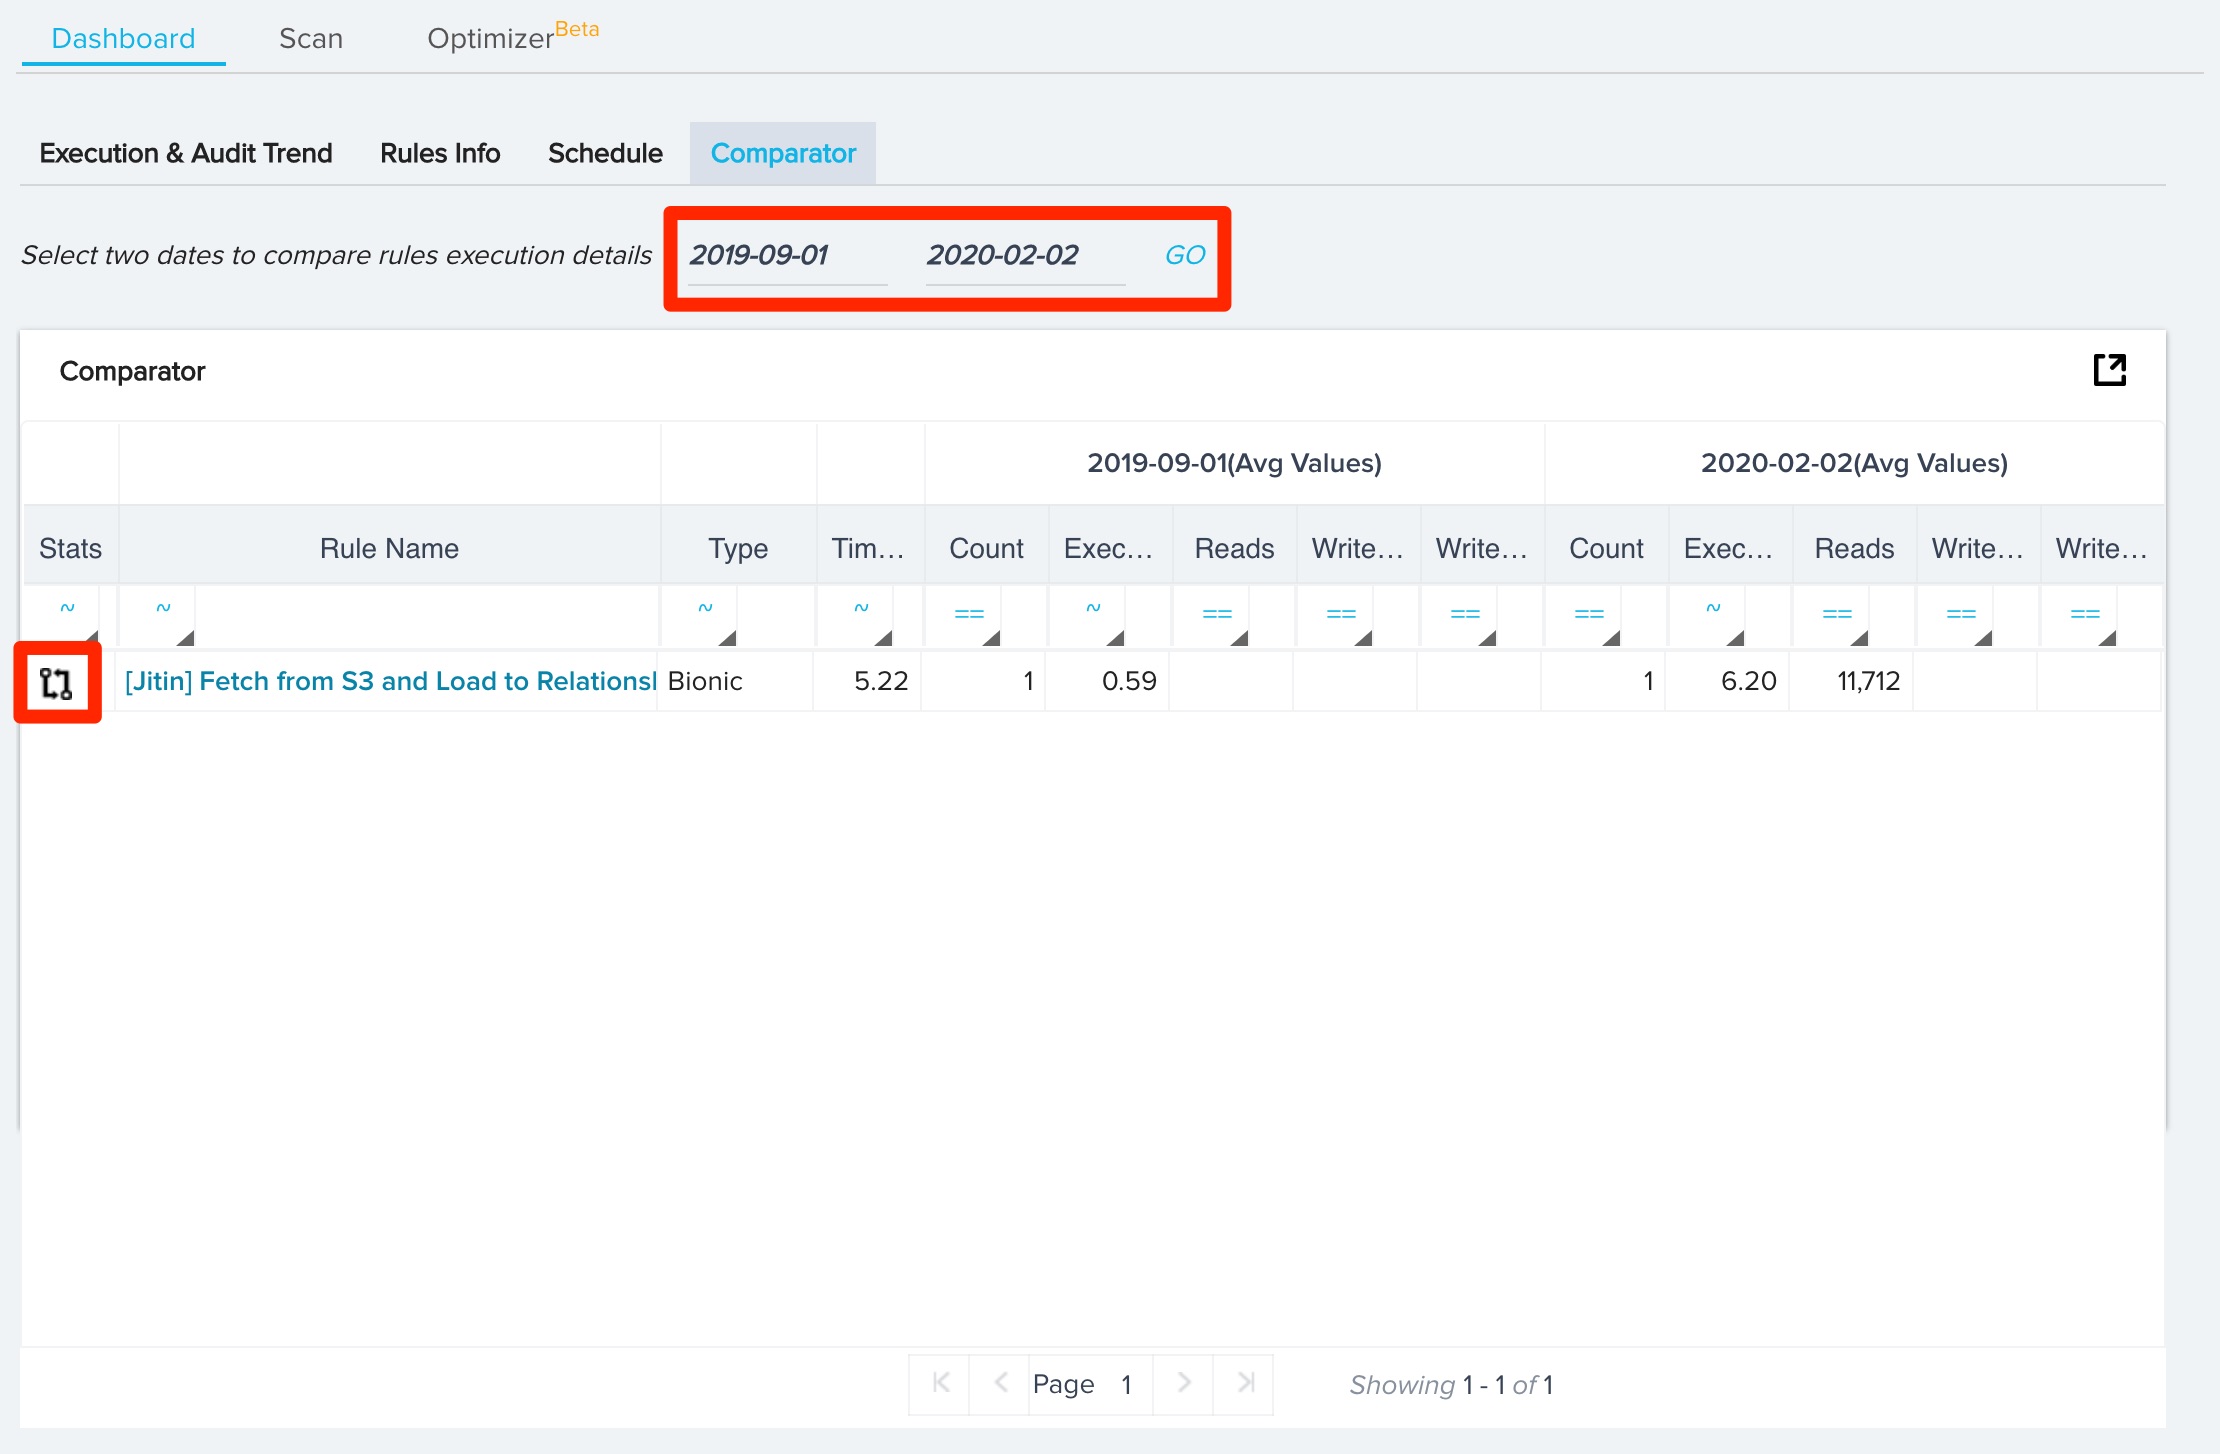
The Comparator feature provides a clear view of the difference between execution of rules on one day vs. another. This helps Gainsight Admins to analyze which Rules are broken and need debugging. Admins can compare how a rule is performing by selecting two dates and comparing the rule run statistics on the selected dates.
Perform the following steps to compare:
-
Navigate to Rules Analyzer > DASHBOARD tab > Comparator tab
-
Select the Start Date and End Date
Note: Ensure that Start Date is less than End Date. -
Click GO. The Comparator window displays a table containing all rule statistics within the date range. This helps admins to see what has changed and which rules are increasing the overall execution time.
-
Click on the Rule Stats icon to see more details about the particular rule on the Company Data page.
This Company Data page provides granular information about the rule, including the success and failure rates.
The Comparator feature also shows when a rule is running perfectly and does not require any changes. Below is an example of a rule that is running without any changes on the two dates which indicates no debugging is required for this rule.

Scan
The Scan tab contains tools to examine rules and describe how the rule can be improved. It helps Gainsight Admins identify where a rule is lacking efficiency. It contains the following subtabs:
Rule Scan
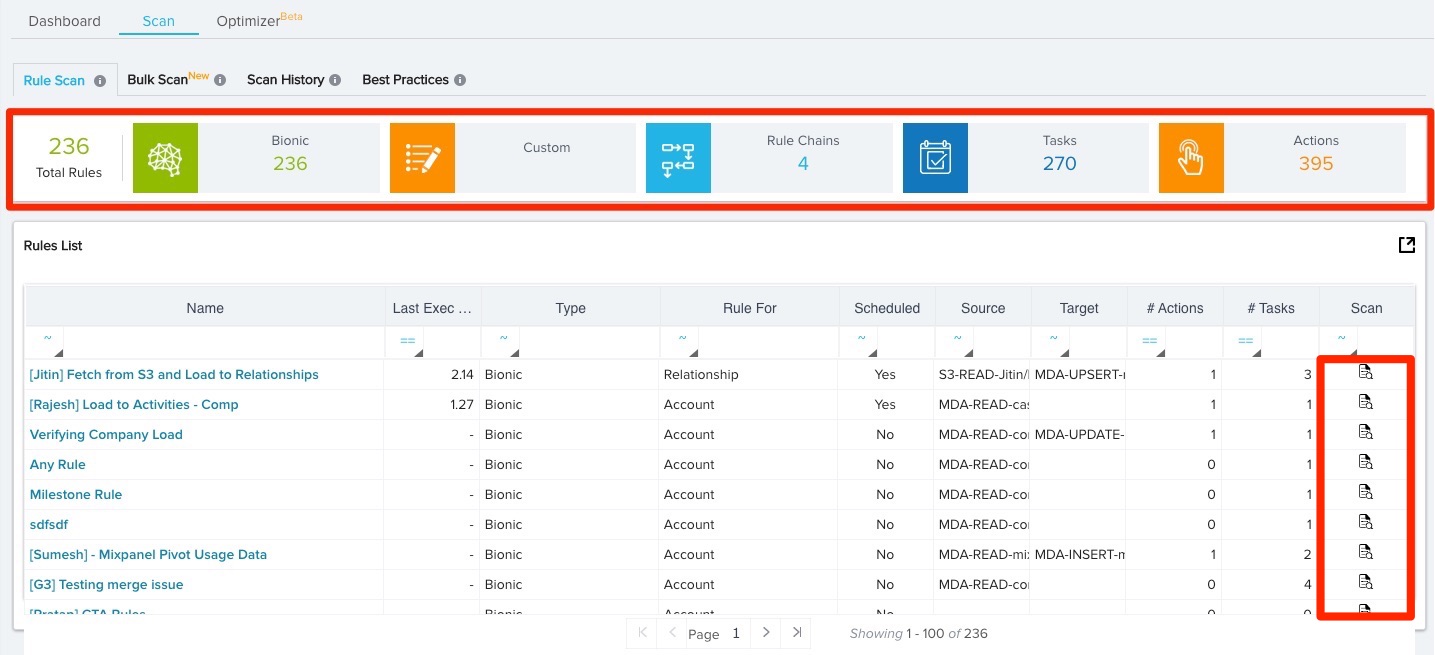
The Rule Scan page displays a Rule 360 screen with a quick view summary of all your rules arranged in tiles at the top of the screen. The summary includes the following:
-
Number of Total rules
-
Number of Bionic Rules
-
Number of Custom Rules
-
Number of Rule Chains
-
Number of Tasks
-
Number of Actions
Below the quick view summary is a list of all rules within the org. This list displays the following fields: Rule Name, Last Execution Time, Type, Rule For, Scheduled, Number of Actions, Number of Tasks, as well as a button to Scan the rule. You can click on the rule’s name to view it in the Rules Engine.
You can click on the Scan Rule icon to see a complete analysis of the particular rule as shown below. Clicking on the Scan Rule icon displays the Rule 360 screen, which includes the Scan Points for the rule, a 30 day trend analysis of how the rule has performed, and a detailed report on the rule.
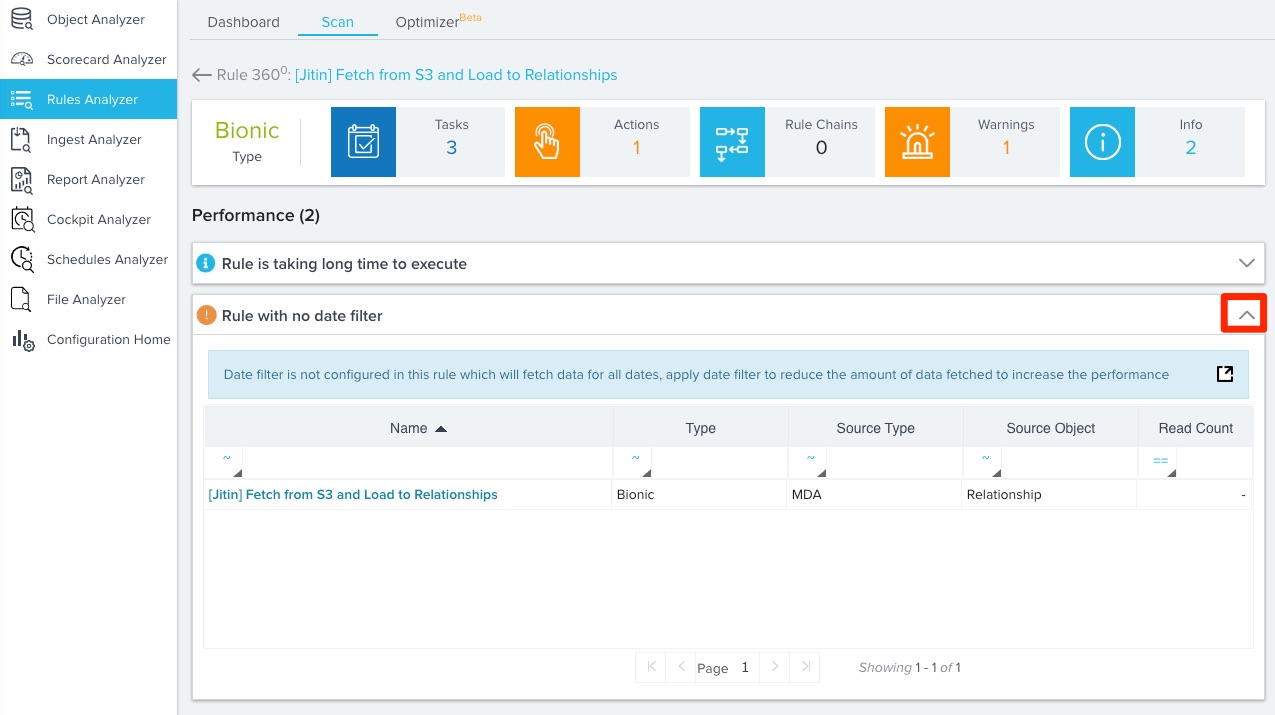
The top of the Rule 360 screen contains a quick view summary of the type of rule (Bionic /Custom) and the tasks and actions associated with the rule, as well as the rule’s Scan Points. Scan Points are possible causes of rule failure or under performance. You can click on the expand icon for a deep dive on the cause and how it can be corrected.
In the example below, clicking on the expand icon for Rule with no date filter, shows how the rule is fetching unnecessary data due to a lack of filters. The Admin can then add appropriate filters to improve performance. For more information on specific scan points, refer to Scan Points.
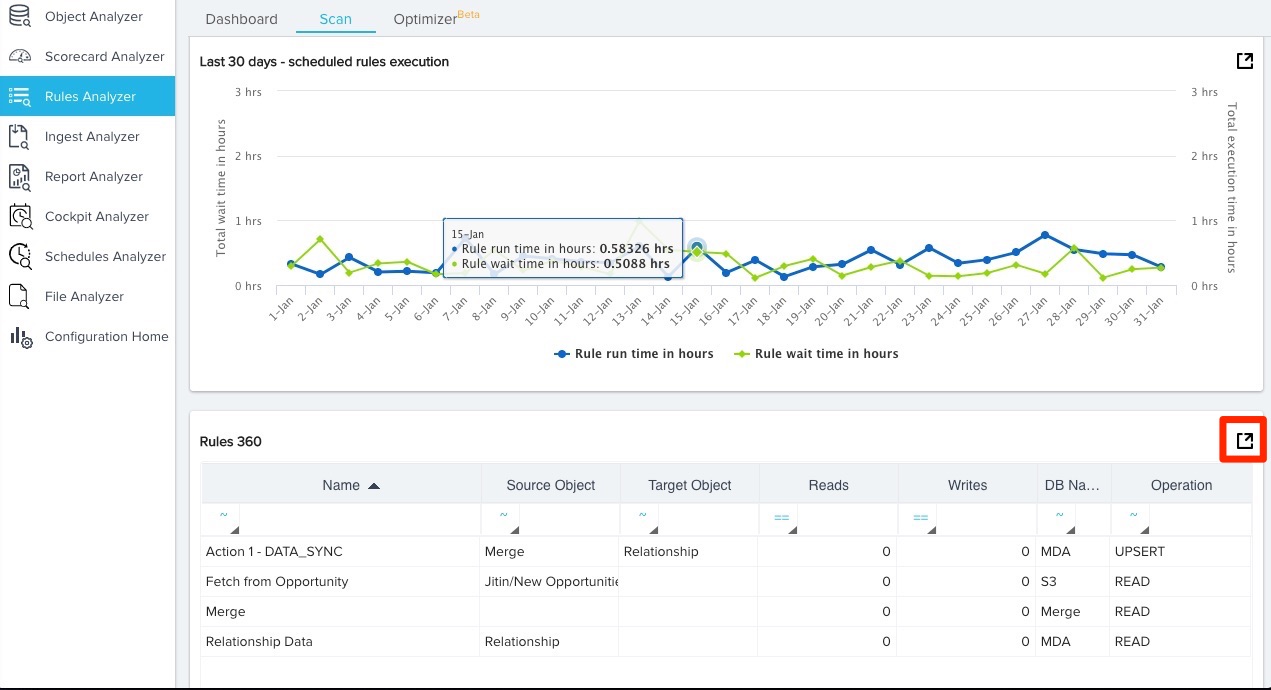
The 30 day trend analysis report displays the rule’s run time and wait time in hours. Hovering over any date provides a bird’s eye view of the execution time and waiting time on that date as shown below.
The Rules 360 report displays detailed information about the rule, including an entry for each Task and Action within the rule. Each entry displays the Task or Action’s Name, Source Object, Target Object, Reads, Writes, Database Name, and Operation Type. You can download this report as a .xlsx file by clicking the export button in the top right.
Bulk Scan
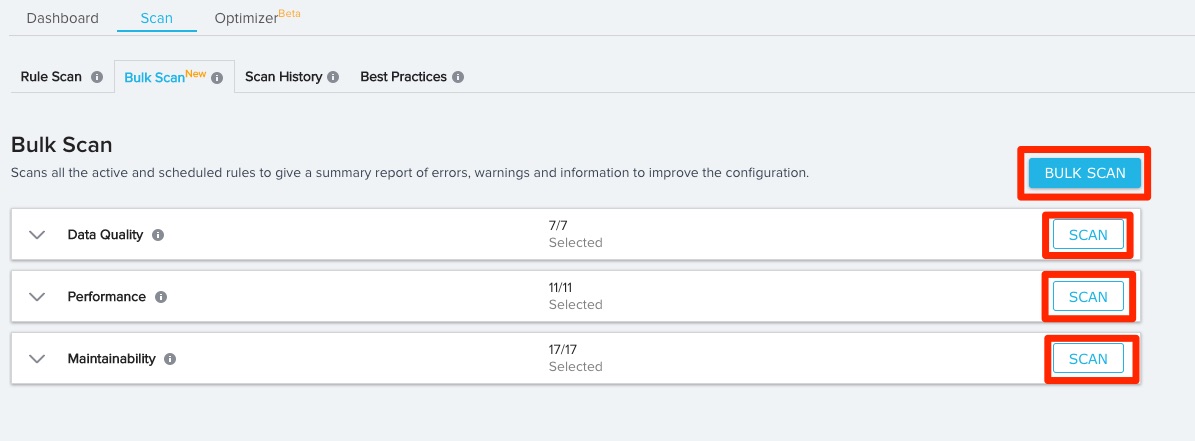
The Bulk Scan page displays options to scan all active and scheduled rules to give a summary report of errors, warnings and information to improve rule configuration. You can then send this report to one or multiple email addresses.
Admins can select from a list of Scan Points for the Bulk Scan to check for. By default, all Scan Points are selected. The list of Scan Points is divided into three segments that you can expand to select/unselect specific data points:
-
Data Quality: These scan points look for configuration errors that can cause data quality issues along with recommendations to improve data quality. This segment includes the following scan points:
-
Action is having permission issue
-
Identifiers Mismatch
-
More updates than reads
-
Partial Failures
-
Rule scheduled early
-
Rule using insert operation
-
Task is fetching 0 records
-
-
Performance: These scan points look for configuration errors that can cause performance issues along with recommendations to improve the performance. This segment includes the following scan points:
-
Apply to Gainsight customer filter not applied
-
Consolidate actions by using additional criteria
-
Dimension Id and Name are used
-
Duplicate Actions
-
Filter on ID/Name/GSID
-
Long Execution
-
No date filter
-
No fetch task
-
No Filter
-
Use Pivot to optimize
-
Using Account object
-
-
Maintainability: These scan points look for ways to improve manageability of rules. This segment includes the following scan points:
-
Duplicate rule name exists
-
No failure email is configured
-
Rule can be consolidated
-
Rule is scheduled to execute on missing days
-
Schedule is ending soon
-
Schedule start date is in future
-
Schedule with end time
-
Scheduled for multiple times a day
-
Scorecared 1.0 rule
-
The object not found
-
The rule is part of multiple rule chains
-
Unscheduled Rule
-
Unused tasks
-
Use Case Expression
-
Using Scorecard 1.0
-
No Action
-
For more information on specific Scan Points, refer to Scan Points.
After configuring the list of scan points, click either the BULK SCAN button to scan all rules for the selected scan points, or a specific segment’s SCAN button to scan all rules for the selected scan points in that segment.
When you click one of the scan buttons, the Trigger Bulk Scan screen displays.
The results of the scan will be sent as a .xlsx file to any valid email address entered in the text box. By default, the logged in user’s email address will be entered. Click CONFIRM to complete the scan or CANCEL to navigate back to the Bulk Scan configuration screen.
After a Bulk Scan is completed, the Scan History page is displayed.
Scan History
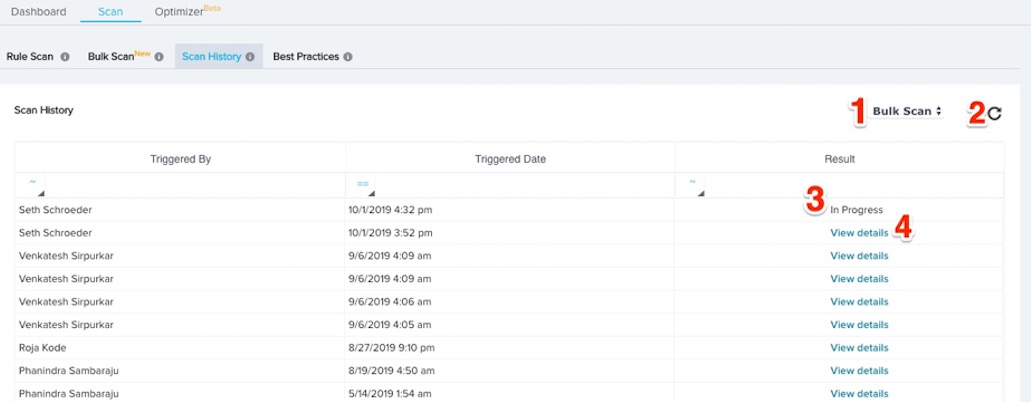
The Scan History page displays a report with an entry for each completed scan. Each entry includes the name of the user who triggered the scan, the date and time the scan was triggered, and the scan results. You can take the following actions on this page:
-
Scan Filter: Click this field to select the following filter options for the Scan History page:
-
Bulk Scan: Displays an entry for each Bulk Scan.
-
Rule Scan: Displays an entry for each individually scanned rule. The name of the rule is also displayed.
-
All: Displays an entry for each scan. The Scan Type and name of the rule are also displayed.
-
-
Refresh: Refresh the data displayed in the Scan History report.
-
In Progress: This will display if the scan results are not yet ready to view. You can click the Refresh button to update this.
-
View Details: Click this to display the scan results page. For Bulk Scans, this is a report with an entry of every rule scanned. For individual rules, this is the Rule 360 page. For more information, refer to Bulk Scan and Rule Scan.
Best Practices
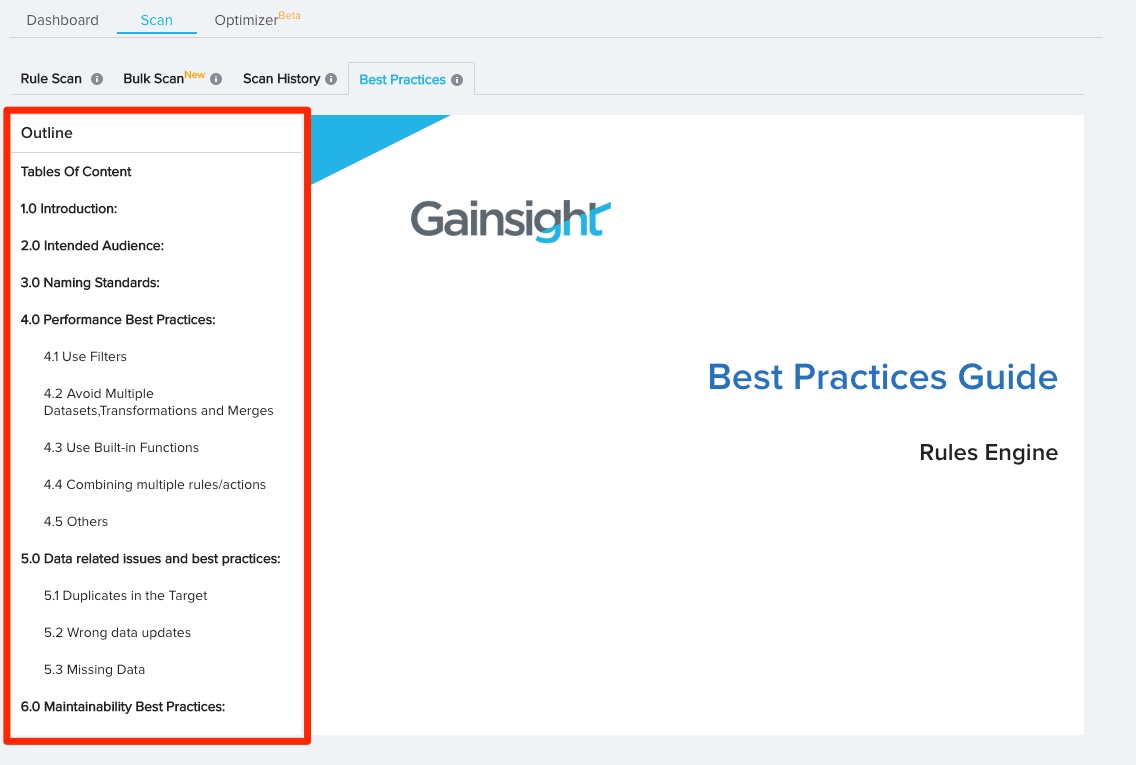
The Best Practices page displays guidelines to adhere to when creating rules. You can click options displayed in the Outline column on the left to navigate the documentation.
Scan Points
Currently, Scan checks the rules in your Org for the following 19 Scan points. Each of these has a similar message (similar to the example above) which you can expand to know more details.
Unscheduled Rule
A rule that is part of a scheduled Rule Chain, will have an active schedule and an end time in the future. If the rule does not have a schedule and the fields displayed include the last run on date, it implies the rule is not successful. The other fields displayed include Rulename, Ruletype, and Number of times the rule ran in last 7 days.
Rule Scheduled Early
Gainsight recommends admins to schedule the rules only after observing run times and execute the rule manually for at least a week. This Message appears when the rule has been created within 7 days and scheduled without any manual execution. The other fields displayed include Rulename, Ruletype, and Created On.
Rule with no Filter
Gainsight recommends that appropriate filters should be included while configuring a rule ("Apply to GS Customer" is not considered as a filter). If the rule has one or more fetch tasks without a filter, it starts fetching unnecessary data. Appropriate filters need to be added to fetch the necessary data and improve performance. The other fields displayed include Rule Name, Type, Source Type, Source Object, and Read Count.
Rule with no Date Filter (example above)
Gainsight recommends including a date filter to help narrow the data set that the rule has to process. If the rule has one or more fetch tasks without a Date filter, it fetches data for all dates. Apply a Date filter to reduce the amount of data fetched and improve the performance. The other fields displayed include Rule Name, Task Name, Source Object, and Read Count.
No Action Configured
Every rule fetches data in order to have certain actions performed using the data. This message appears if a rule is fetching data but not performing any meaningful business action. The other fields displayed include Rule Name, Task Name, and Object Name
Rule is taking a long time to Execute
This message appears when a rule has taken 5 minutes or more for at least 10% of total execution in the preceding 7 days (These numbers are configurable per tenant basis). The rule scan also provides a list of the 5 most time taking executions. The other fields displayed include Rule Name, Type, Source Type, Start At, End At time, and Execution (Exec) Time.
No Failure Email is Configured
Gainsight recommends configuring a failure email for every rule to ensure that you’re notified when a rule has failed. This message appears when a Scheduled Rule is not configured to receive a Failure Email. The other fields displayed will include Rule Name, Source Type, Exec Date, Process Status, and Number of failure records.
"Apply to Gainsight customer" Filter is Missing
If the "Apply to GS Customers" filter is not configured, the rule fetches data for all the accounts which are not part of Gainsight Objects. This message appears when this filter is missing from the rule. The other fields displayed will include Rule Name, Type, Source Type, Source Object, and Read Count.
Rule has Duplicate Actions
Sometimes, a user copies an action but forgets to delete the duplicate action. This message appears when a rule contains the exact same action multiple times. The other fields displayed include Set Number, Rule Name, Action Index, Action Name, and Target Object.
Rule has Frequent Partial Failures
This message appears when a rule has partially failed for at least 10% times in the preceding 7 days (The numbers are configurable at tenant level). The other fields displayed include Rule Name, Source Type, Exec Date, Status, and Number of failure records.
Consolidate Rules
Gainsight recommends consolidating rules with the same source object into a single rule with multiple actions. This message appears when multiple rules use the same object. If these rules are combined into a single rule with multiple actions, it results in greater efficiency. The other fields displayed include Rule Name, and Rule Type.
Use Pivot to Optimize
Gainsight recommends reducing the number of actions associated with a rule if possible. This message appears when the actions for a rule can be reduced using the Pivot feature. The other fields displayed include Rule Name, Rule Type and Action Name.
Use “Case expression” to Optimize Rule
Gainsight allows admins to reduce the number of actions associated with a rule by using a Mapping/Junction object. This message appears when it is possible to reduce actions of rule using a “Case expression”. The other fields displayed include Rule Name, Rule Type and Action Name.
Rule Duplicated in Rule Chains
This message appears when a single rule is part of multiple Rule Chains. Gainsight recommends against having the same rule run multiple times as part of multiple Rule Chains. The other fields displayed include Rule Name, and Rule Chain Name.
Identifiers Mismatch
Sometimes, admins use different identifiers during Upsert/Update actions performed on the same target object which may lead to data corruption. This message appears when the identifiers of a rule differ from those of another rule which is also writing to the same target object. The other fields displayed include Target Object, Rule Name 1, Identifiers 1, Operation 1, Rule Name 2, Identifies 2, and Operation 2.
No Fetch Task Configured in Rule
Every scheduled rule must have one or more fetch tasks defined to avoid parallel executions being blocked. This message appears when no fetch task is present in the scheduled Rule. The other fields displayed include Rule Name, Schedule Cron, Exec Date, and Exec Time.
Rule Writing to Scorecard 1.0
Gainsight Scorecard 1.0 is soon to be deprecated. This message appears when a rule uses Scorecard 1.0 for its associated actions. Gainsight recommends admins to shift the actions to Scorecard 2.0 to continue using Scorecards. The other fields displayed include Rule name, Action, and Target Object.
Load to SFDC
This message appears when a rule takes too long to load to SFDC. The other fields displayed include Rule name, and Target Object.
Rule using Insert Operation
Gainsight recommends using the upsert action instead of Insert to avoid duplicates as the insert operation will be deprecated soon. The other fields displayed include Rule name, Rule type, and Select field index.
Optimizer(BETA)
This feature helps Gainsight Admins to analyze the active rules in their Org and identify which rules can be optimized.
The Optimize tab has two subpages:
-
Consolidate: This page is designed to assist with converting custom rules to bionic, consolidating multiple rules to a single rule, and comparing rules side-by-side.
-
Other recommendations: This page lists rules where optimization is possible and recommends optimization strategies.
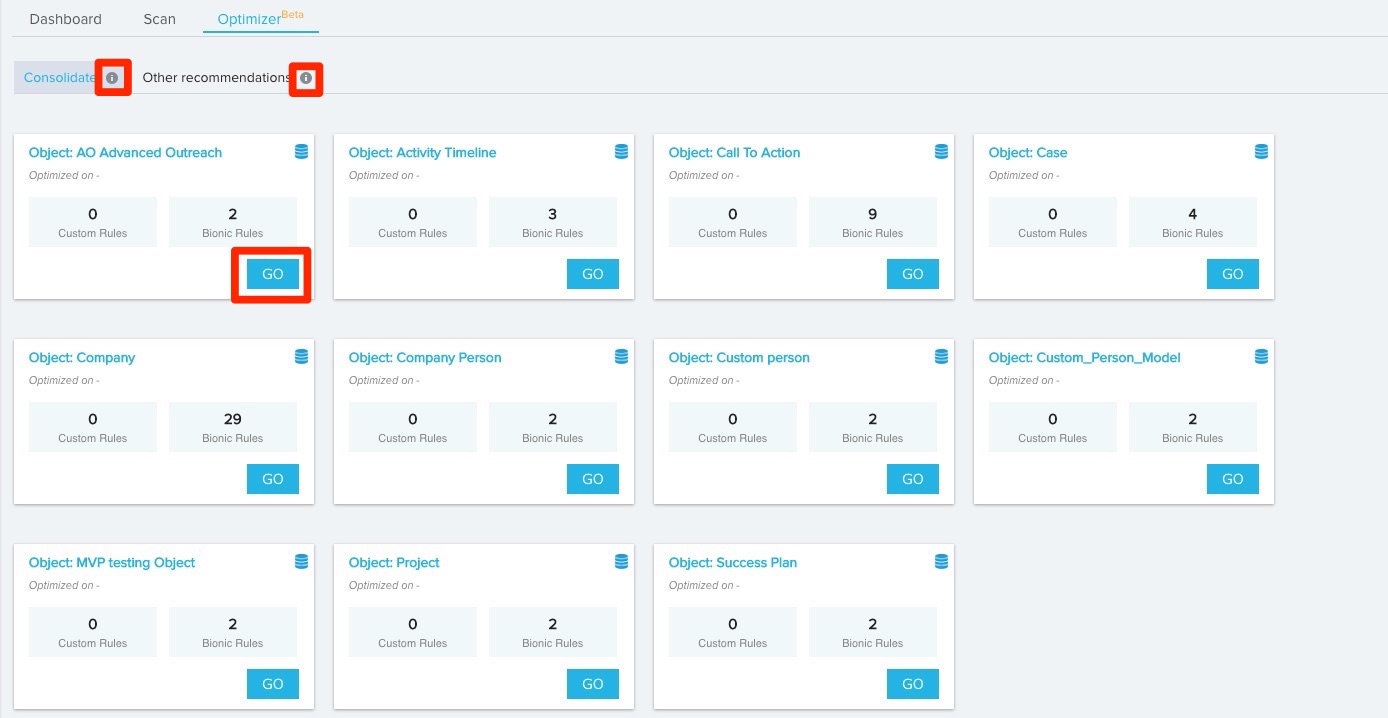
You can click the information icon next to the name of each subpage to see a summary of each page, recommendations on how to use the tools available, and any limitations the page might have.
Consolidate
The Consolidate page displays widgets for each source object with rules that can be optimized. Each widget displays the name of the source object as well as the number of custom and bionic rules built off of the object.
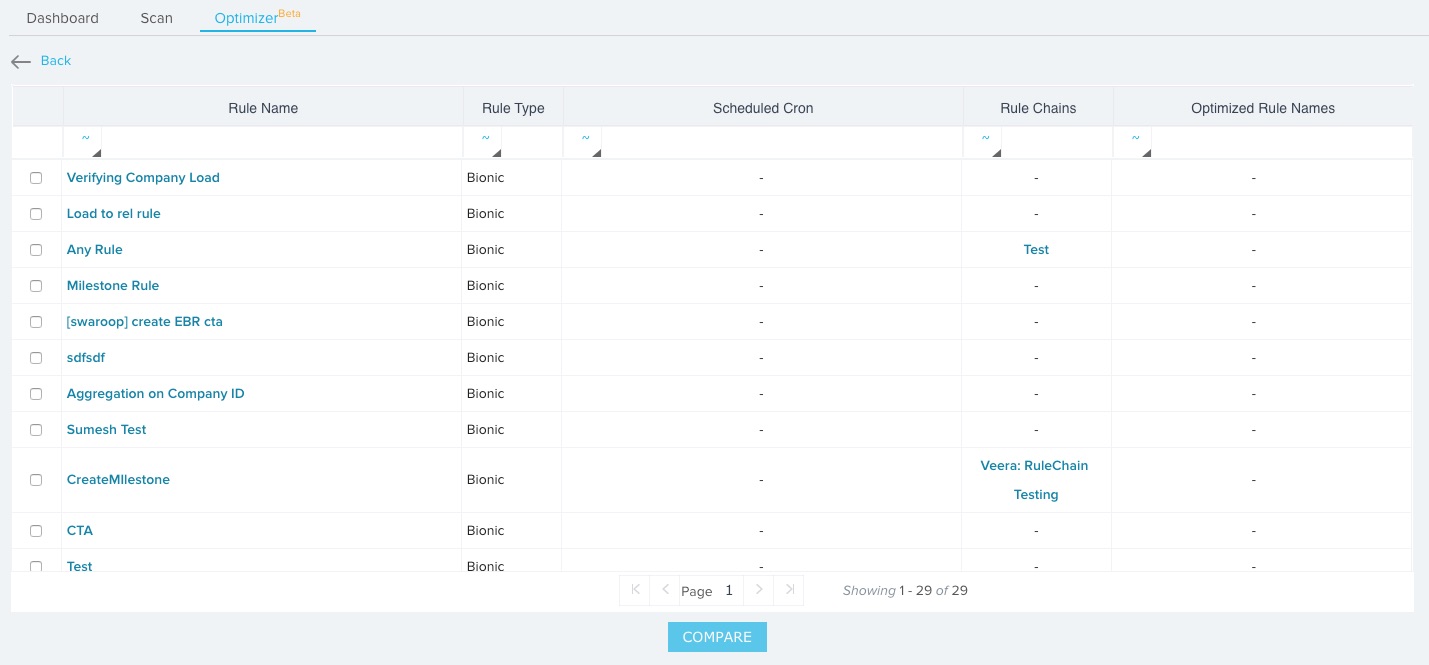
Click the GO button for any widget to view a report of each rule built off of the object that can be optimized.
Each entry in the report displays the rule’s name, type, scheduled cron, associated rule chain name, and optimized rule names.
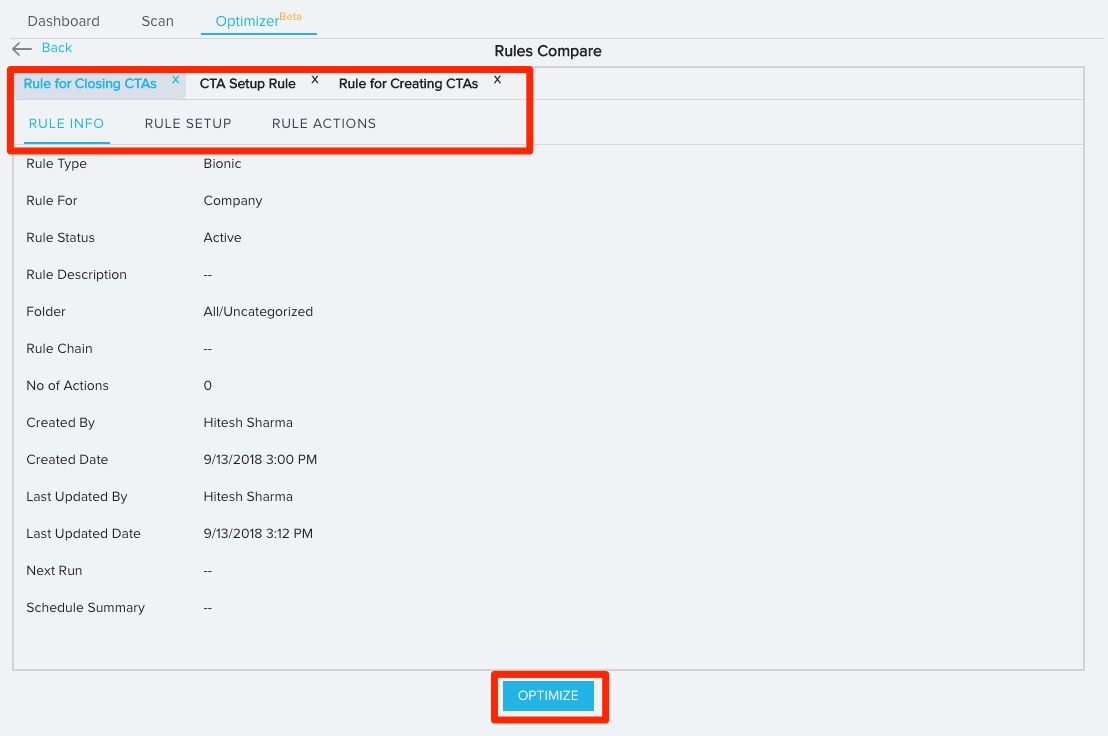
You can compare rules side-by-side by selecting the rules you wish to compare, and then clicking the COMPARE button. This opens the Rules Compare page where you can view the Rule Info, Rule Setup, and Rule Actions for each rule you’re comparing. After you compare the rules, you can select to merge them into a single rule by clicking the OPTIMIZE button.
The newly created rule will be inactive. Navigate to the Rules Engine to make it active. For more information on this process, refer to Schedule and Execute Rules under the Additional Resources section.
Other recommendations
This page displays optimization recommendations for individual rules based on their tasks or actions. You can filter the list of recommendations by scheduled rules, unscheduled rules, or all rules using the rule run type selector field.
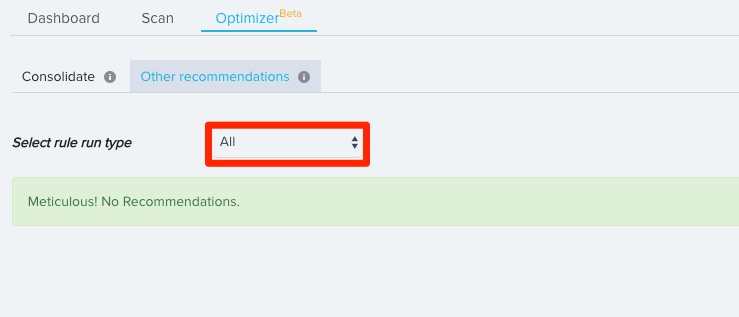
You can expand each recommendation to see a report of applicable rules. Each entry of the report displays the rule’s Name, Type, Created Date/Time, Modified Date/Time, Process Result, and Execution Time. Click the name of the rule to open it in the Rules Engine. You can download this report as a .xlsx file by clicking on the export button.
