Topics Report
This article explains the Topics report in Staircase AI, where topics are visualized in a table view for operational reporting and analysis.
Overview
Use the Topics report to analyze topic data, configure views, and save and schedule report delivery via email for operational workflows.
The Topics report is separate from the Topics feature accessible from the left navigation bar. While both use the same underlying data, the Topics feature is designed for live exploration with treemap, Ask Staircase, and AI summaries. The Topics report is designed for operations and product teams who need to save and schedule topic data for recurring workflows.
To access the Topics report, navigate to the Reports section in Staircase AI.

The Topics report displays both predefined out-of-the-box and custom topics configured in your organization. For information on how to configure topics, refer to the Configure Topics article.
Use the Topics Report
When you open the Topics report, you see a table view displaying your topics and their associated metrics. The most frequently discussed topic appears in the top, with volume decreasing toward the bottom.
The table view below displays each topic along with its related terms, associated accounts, total topic items, positive communication items, negative communication items, neutral communication items, topic-related emails, and topic-related meetings.

The Topics report displays the following views:
- Topic breakdown: Displays AI-generated subtopics under each parent topic.
- Accounts metrics: Displays accounts that mention each topic, along with associated subtopics and sentiment.

You can drill into specific subtopics, view corresponding conversations, and analyze topic-level account metrics.
For example, Under Advocacy and Value Realization, AI-generated subtopics such as Positive Feedback and ROI Achieved appear automatically based on customer conversations. Gainsight recommends using Advanced filter to refine the data and view specific topics based on account, tier, or other filter options.

You can also add or remove columns and apply filters, such as date range, communication type, and accounts, using the Select & reorder Columns option.

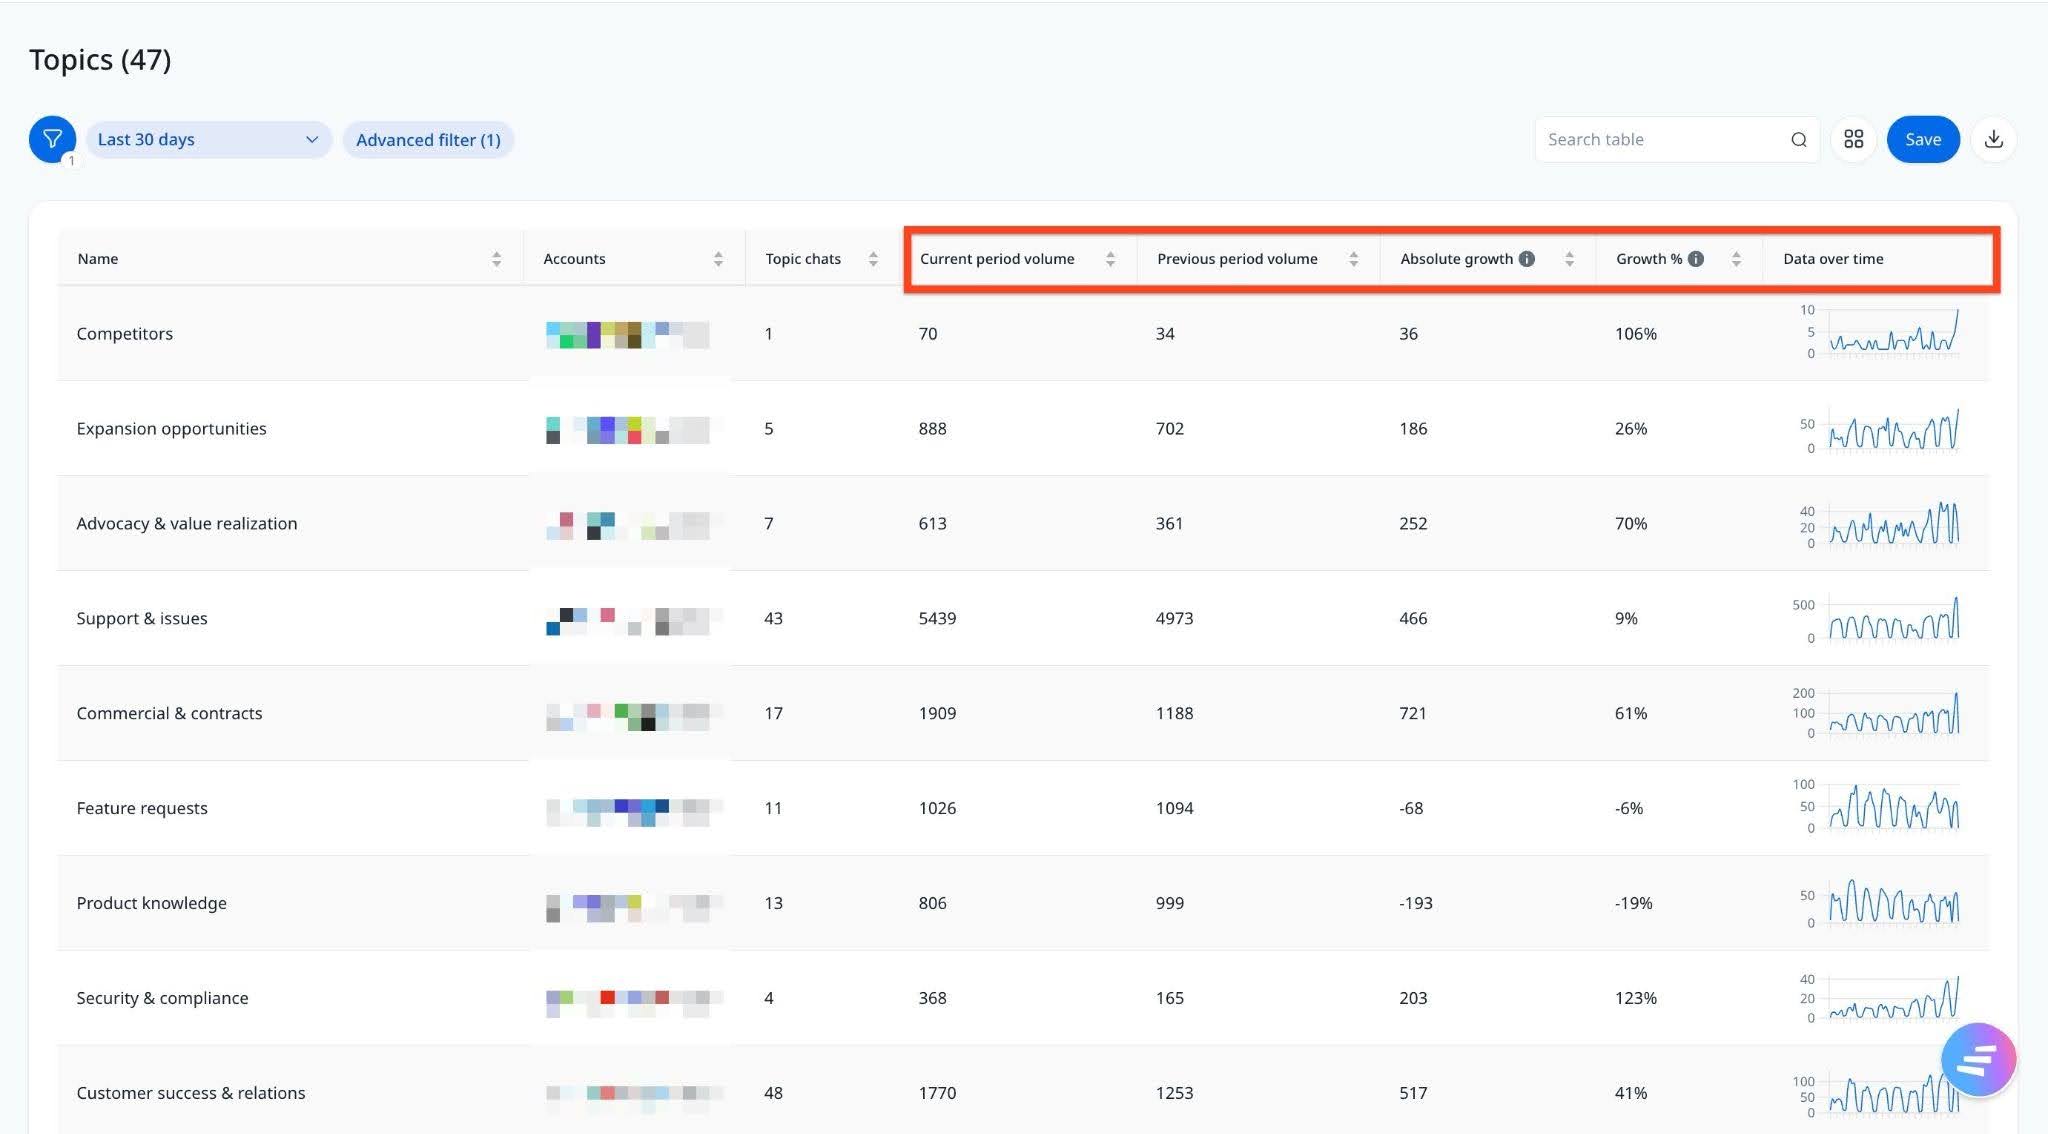
Analyze Topic Trends
Trending topics helps you identify which topics are gaining or losing traction across customer interactions over a selected time period, giving teams a clearer picture of emerging patterns and shifts in customer sentiment.
To analyze trending topics, add the following fields to the Select & reorder Columns:
- Current Period Volume: The number of times a topic was mentioned during the selected time period.
- Previous Period Volume: The number of times the same topic was mentioned in the equivalent prior period.
- Absolute Growth: The raw change in mention volume between the two periods.
- Growth %: The percentage change in volume between the current and previous periods.
- Data Over Time: A time-series graph view showing how topic volume has trended across the selected date range.

These metrics are time-bound and automatically recalculate when you change the date range filter, for example, switching to a 30-day window updates all metrics to reflect that period.
Best Practices
Here are some ways to get the most out of the Topics report:
- Add the trending topics columns in the report to monitor how topics evolve over time and identify emerging patterns or shifts in customer sentiment.
- Leverage the Treemap and tabular view to quickly visualize which topics are currently trending and their relative impact.
- Use Ask Staircase within Topics to analyze the drivers behind positive or negative sentiment, and take upstream actions that can improve experiences for a broader customer base.