PX Release Notes February 2024
Version 4.12.0, Feb 07 (EU) Feb 10 (US)
List of Features
| Features | Destination |
|---|---|
| Engagements | https://app.aptrinsic.com/engagement |
| Analytics | https://app.aptrinsic.com/analytics/ |
| Note: If you are an EU customer, add -eu to the above URLs. For example: https://app-eu.aptrinsic.com/dashboard | |
 : This symbol indicates that an enhancement originated as a customer suggestion on the Gainsight Community.
Enhancements
Engagements
Engagements are communications that are executed through product (in-app) or emails for a specific audience at a specific time. These communications can be interactive in nature which helps you to share information, receive feedback, and engage customers with your product. The overall goal of using engagements is to increase your customer's product usage.
Quick Action Toolbar for Simplified Editing Experience
Gainsight introduces Quick Action Toolbar in the New Editor, to streamline the editing experience of steps in guide engagements for an intuitive user experience.
Key Benefits:
- Improved Editing Experience
The Quick Action Toolbar simplifies the understanding of the engagement hierarchy, including steps, rows, and cells. It enhances user experience by opening only the relevant editor section for the highlighted element, ensuring efficient navigation. It helps you to visually check the changes in one section and its impact on the overall layout, enhancing the efficiency of the engagement design process. - Simplified Operational Actions
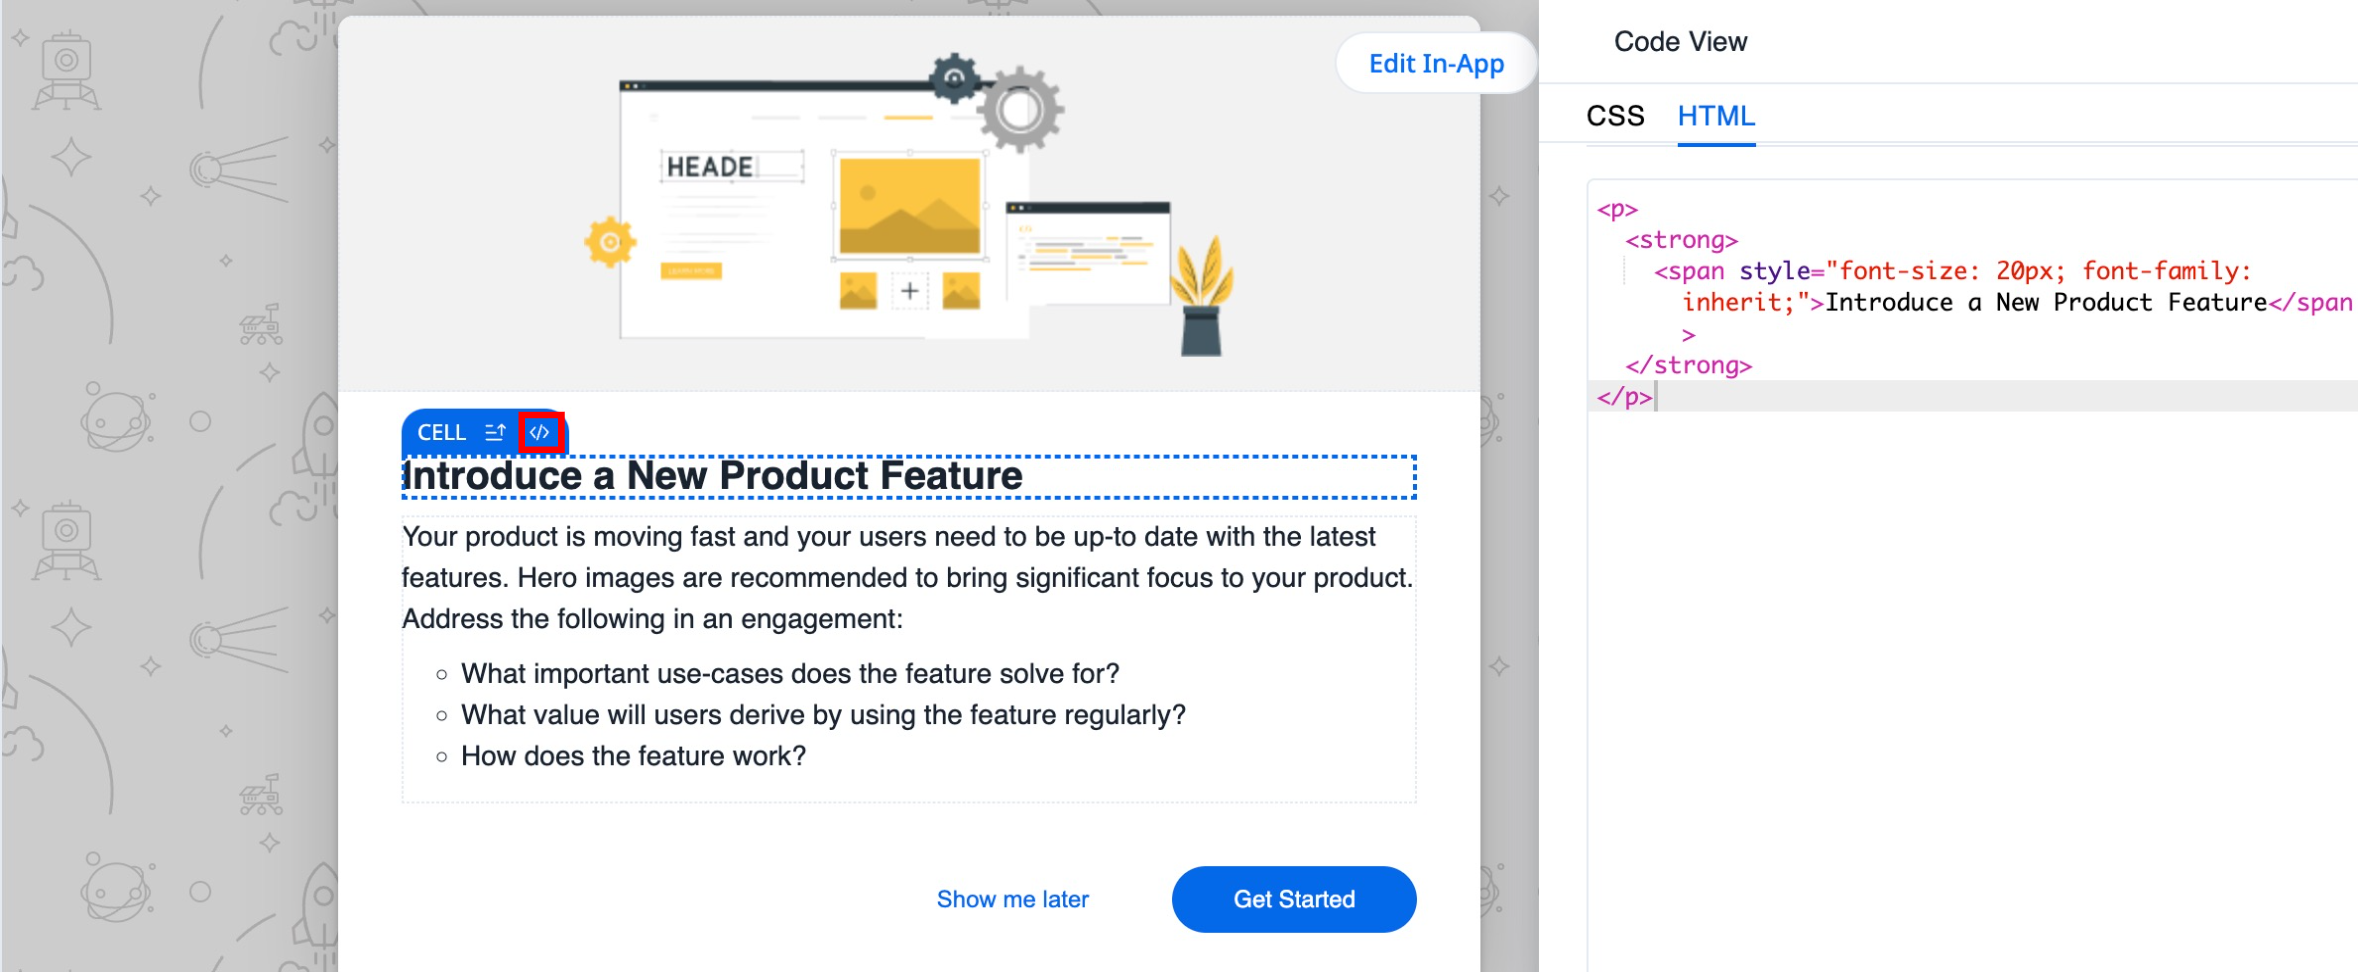
The Quick Action toolbar significantly simplifies key operational tasks, improving user productivity and reducing the necessity for extensive mouse movements.- Code View Access: You can now seamlessly transition to Code View directly from the toolbar. This streamlines layout modifications, making the process more efficient. This is only available for a step and cell.
- Clone and Delete Functions: The toolbar readily offers clone and delete options, enhancing ease of use and reducing the time needed to perform these common actions.
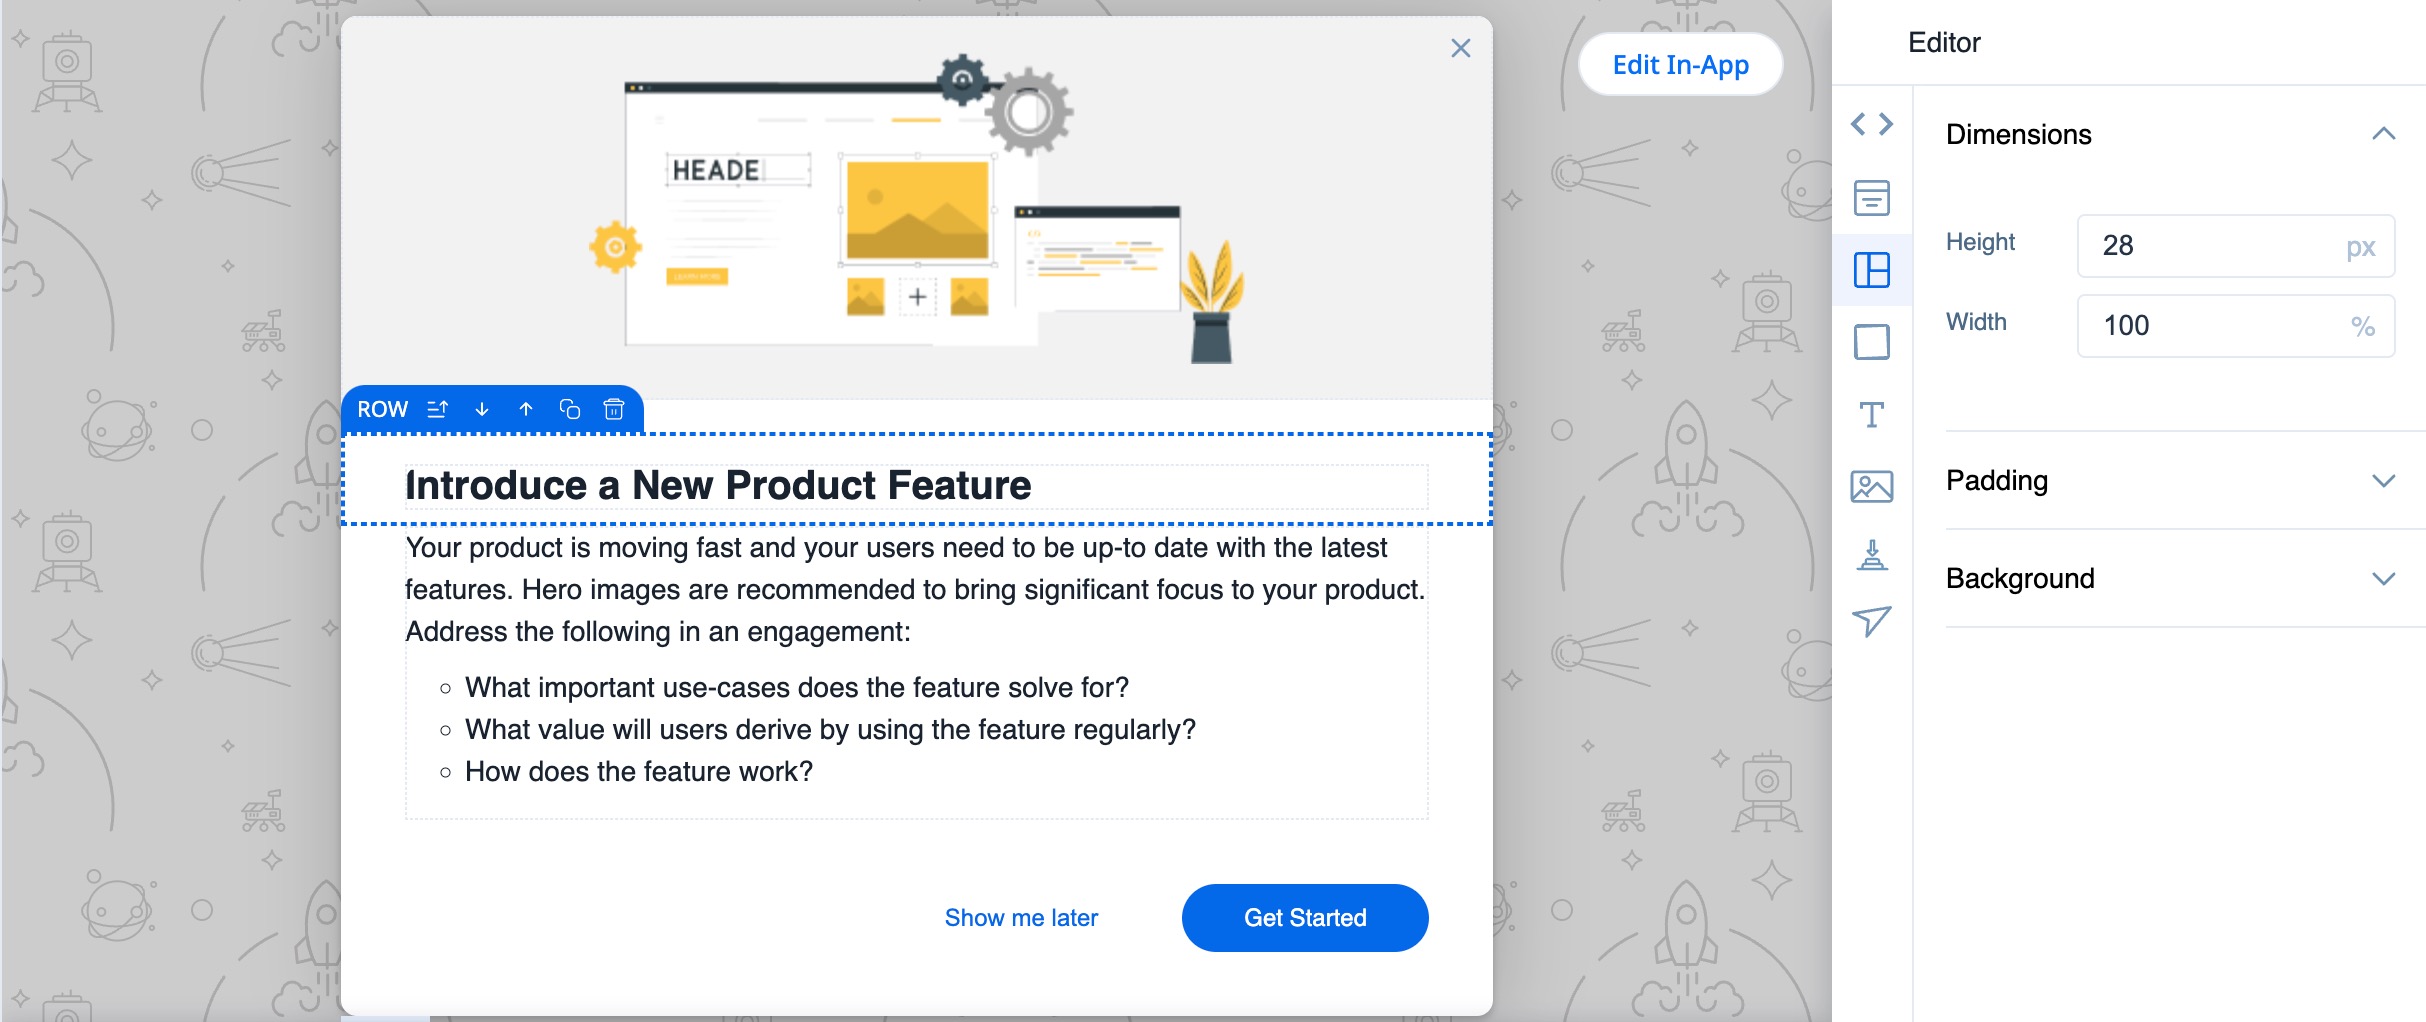
- Row Rearrangement: The toolbar introduces a straightforward method for rearranging rows. You can effortlessly reorder rows using the up and down arrow icons, eliminating the need for complex workarounds like copy-pasting content.
.jpg?revision=1)
- Code View Access: You can now seamlessly transition to Code View directly from the toolbar. This streamlines layout modifications, making the process more efficient. This is only available for a step and cell.
Note: Starting with this release, guides can now have a maximum of 50 steps. Existing guides with over 50 steps won't be affected, but you can't add back steps beyond this limit if any are removed. When cloning a guide that has more than 50 steps, only the first 50 steps will be copied.
For more information on changes related to Editor interface, refer to the Work with Quick Action Toolbar article.
Analytics
PX Analytics helps you to keep your finger on the pulse of product adoption and user satisfaction. You can monitor the metrics that matter to you with custom dashboards, discover which features drive retention within each customer segment and user cohort, map and track customer adoption goals, analyze trends by customer segment, and more.
Improved Segments
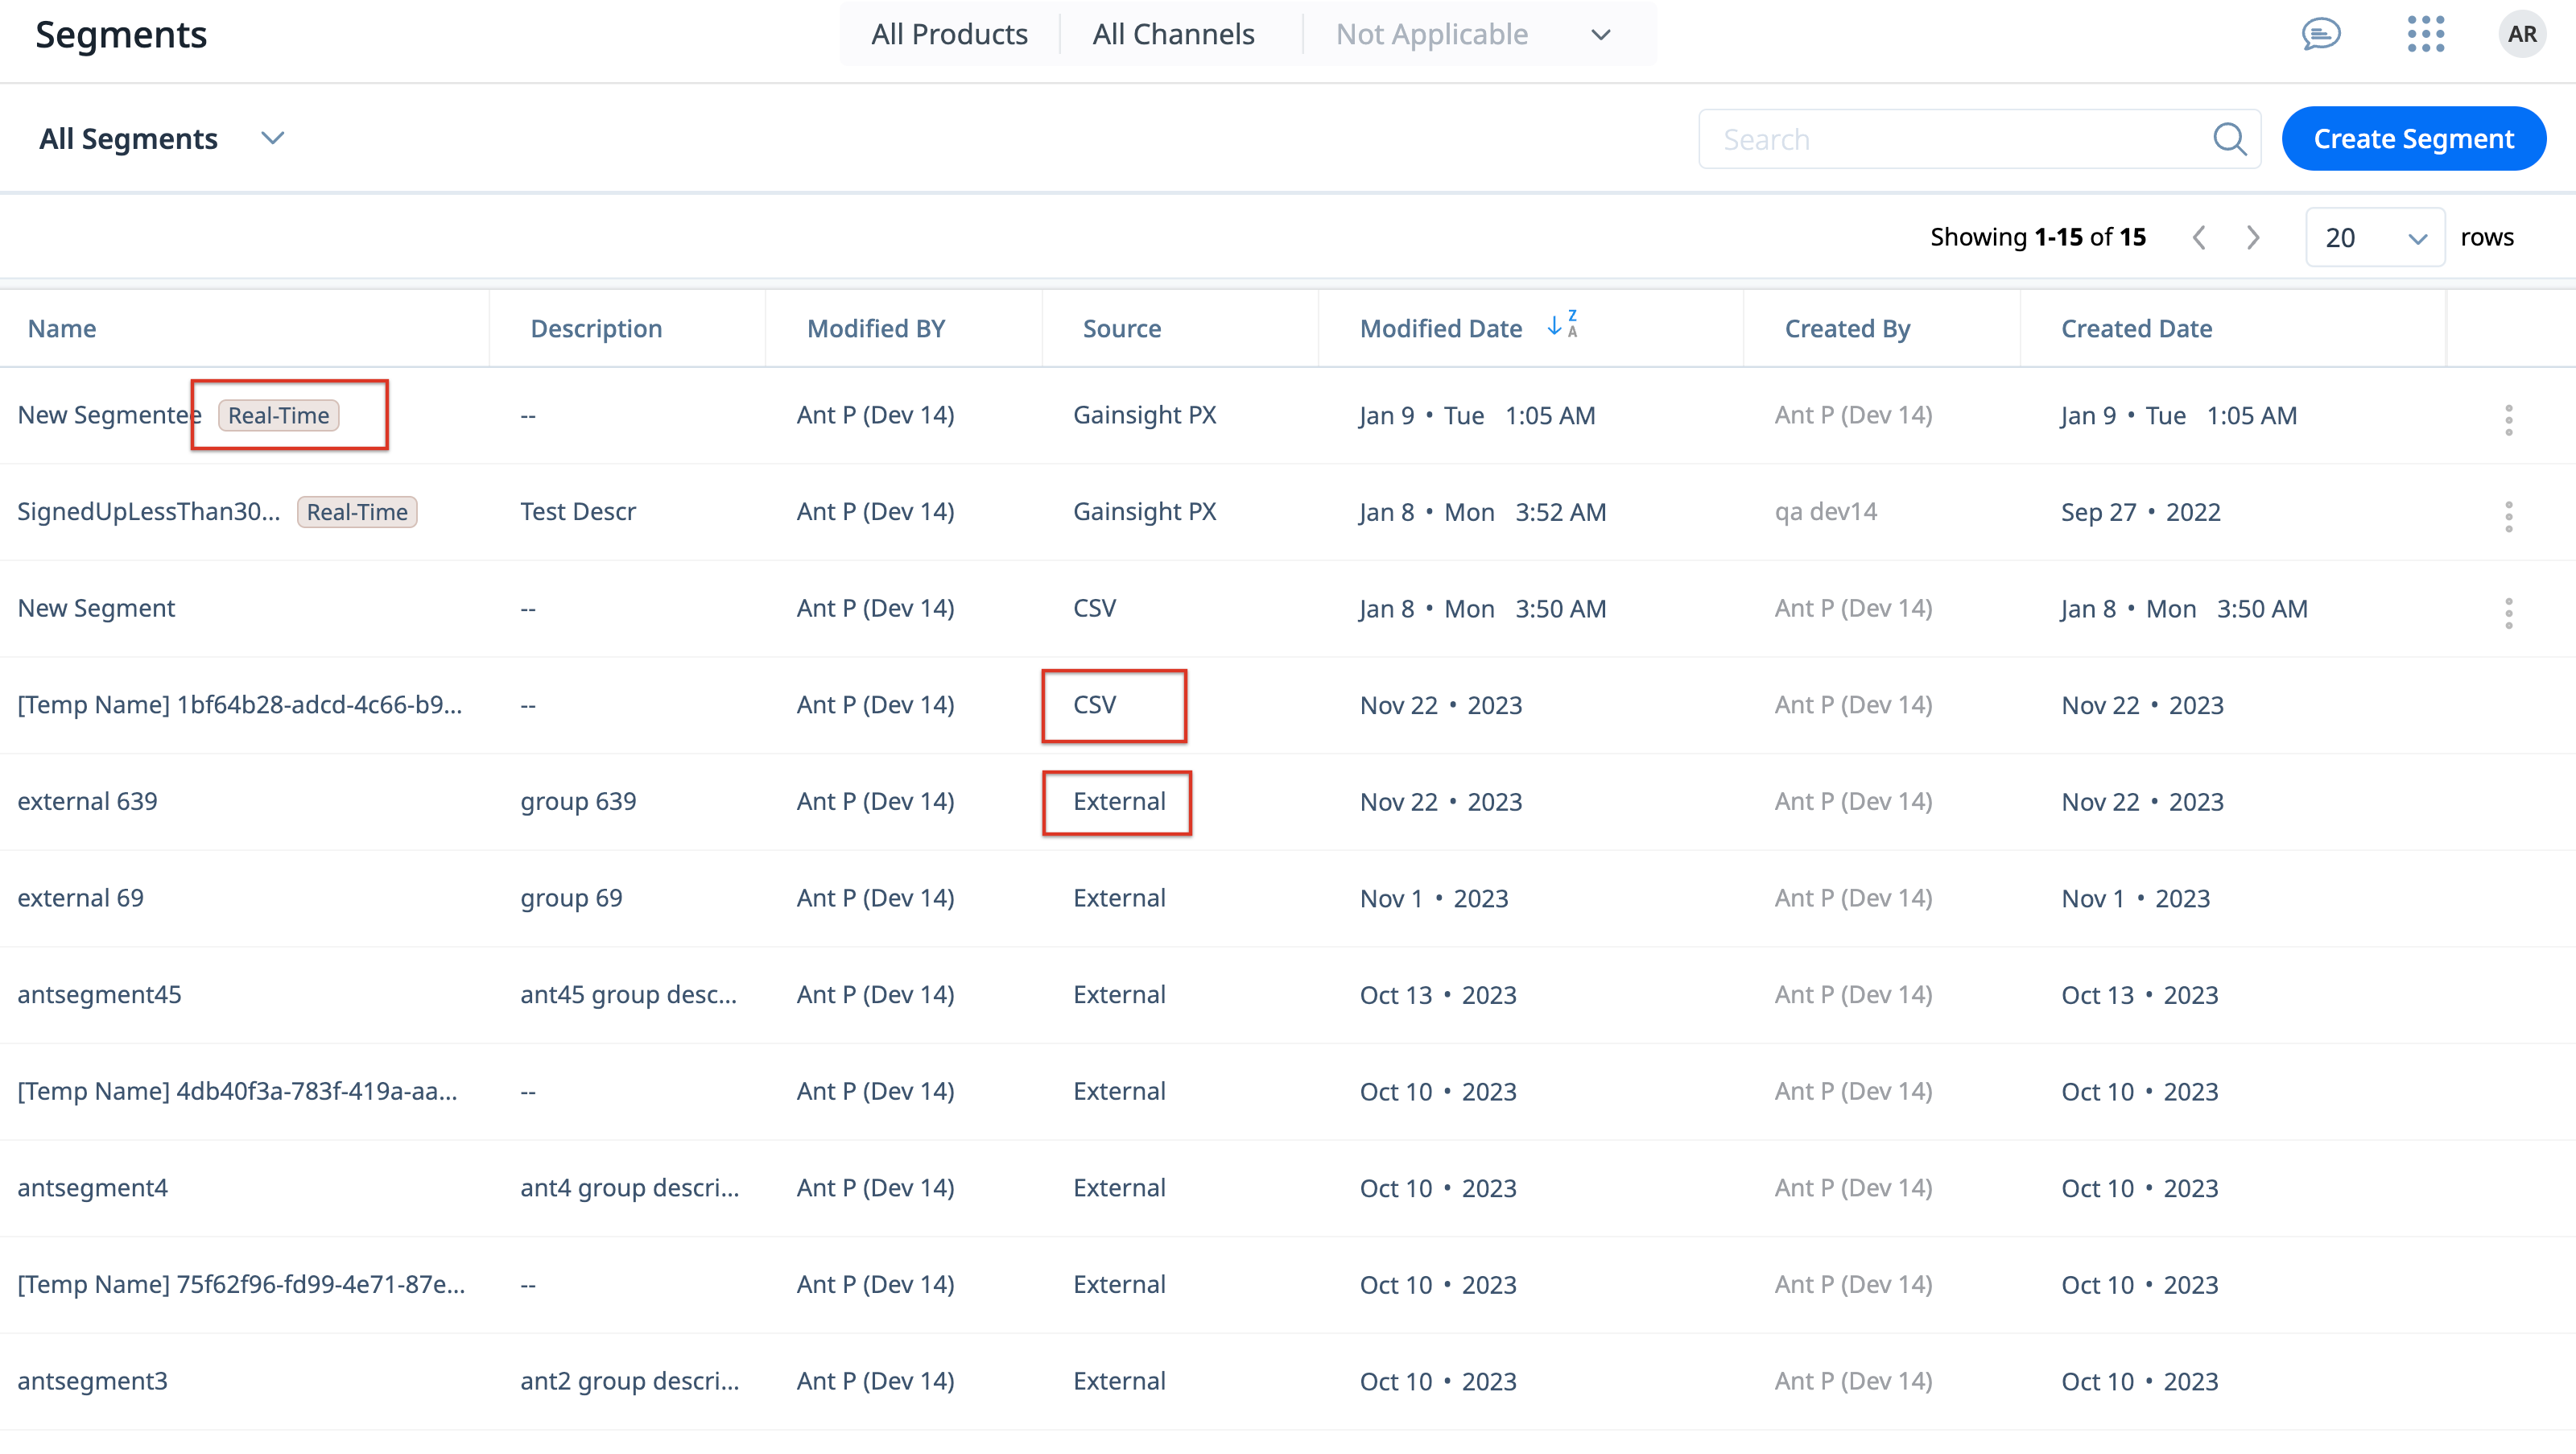
Building on the enhancements from the last quarter, Gainsight has further improved Segments with additional enhancements. This redesign includes a new Segments list screen and a clearer categorization of segment types, based on how they are created and evaluated. The enhancement introduces the following segment categorizations:
- Real-Time segments: Segments that are created using audience rules, and are evaluated in real time.
- Segments: Segments that are evaluated only when they are created, edited, or refreshed.
- CSV segments: Segments that are created by importing a CSV file containing a specific list of users that are to be engaged.
- External segments: Segments that are created in external systems (for instance, Adobe Experience Platform) and brought into PX using APIs.
For more information on the new categorization of segments, refer to the Segments article.
Create Segments using CSV
The new CSV upload feature in Segments makes it more convenient than ever to create segments in PX. This enhancement allows you to effortlessly upload a list of specific users as a segment. Such segments can then be used to target engagements, or filter data in Analytics and Dashboards.
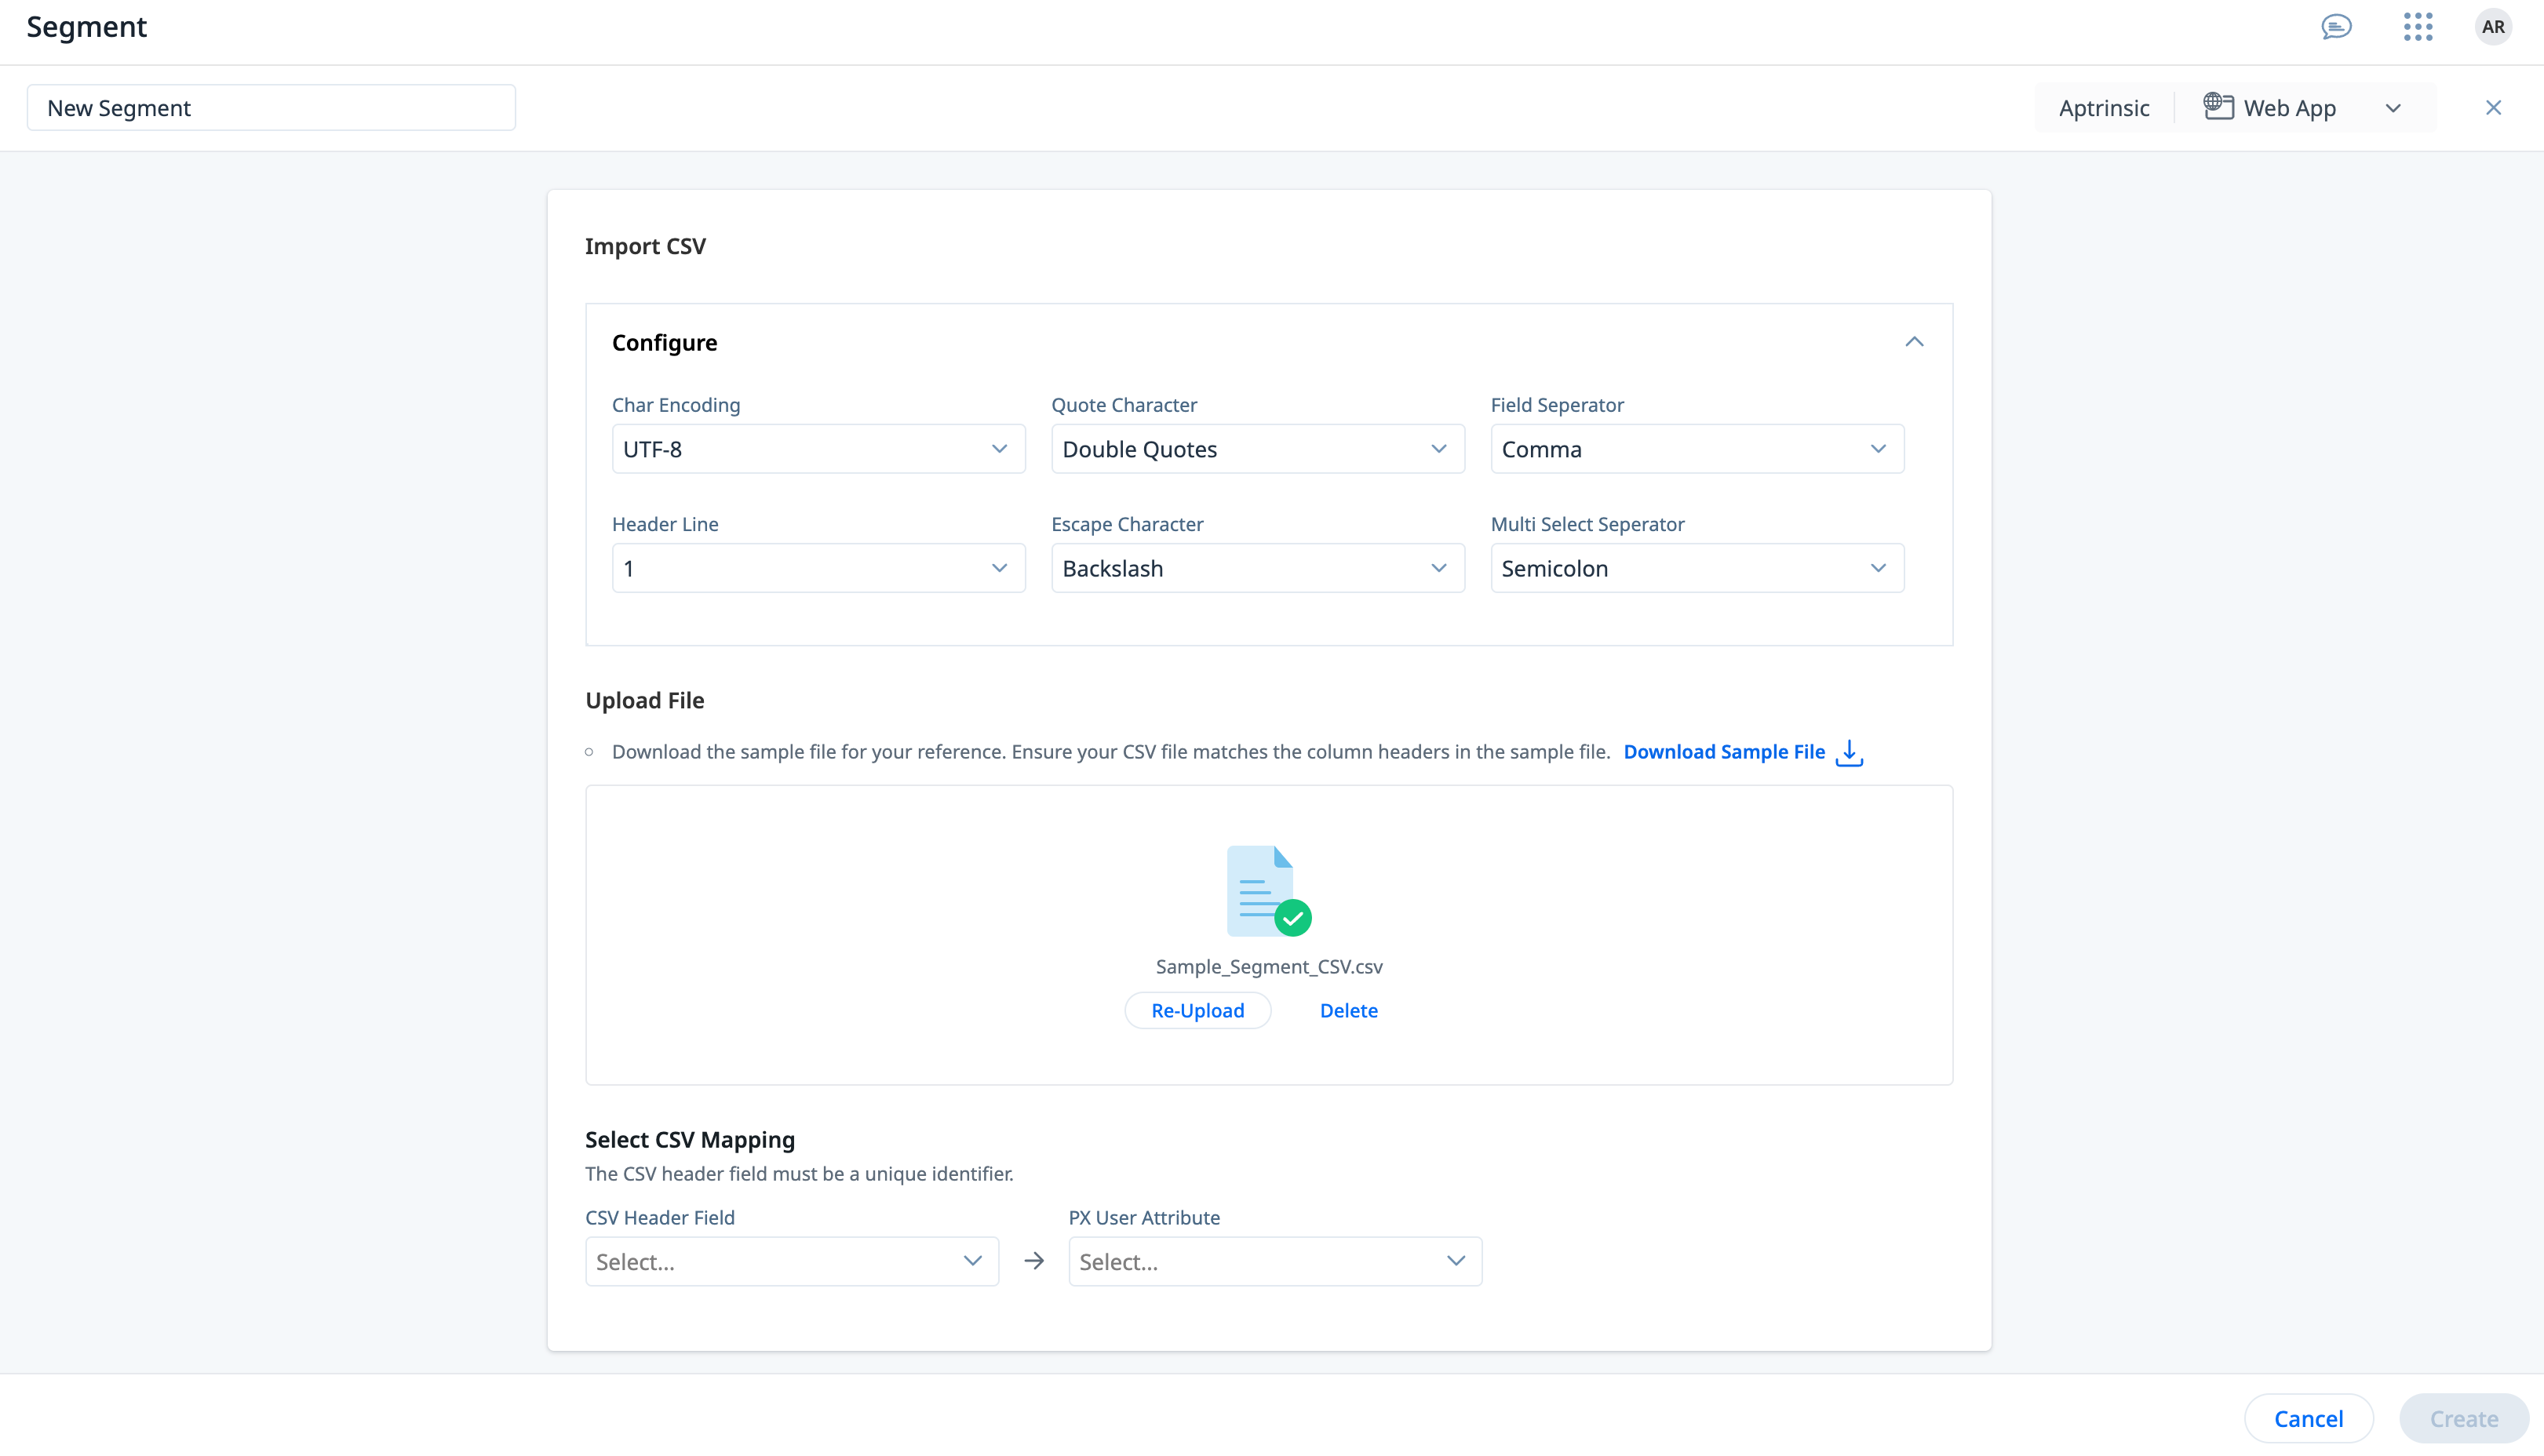
For more information on importing users to create segments, refer to the Segments article.
CTA Analytics for In-App Engagements
The new CTA Analytics tab in the In App Performance report is designed to provide deeper insights into user interaction, and help you make data-driven decisions to optimize the user experience for WebApp engagements.
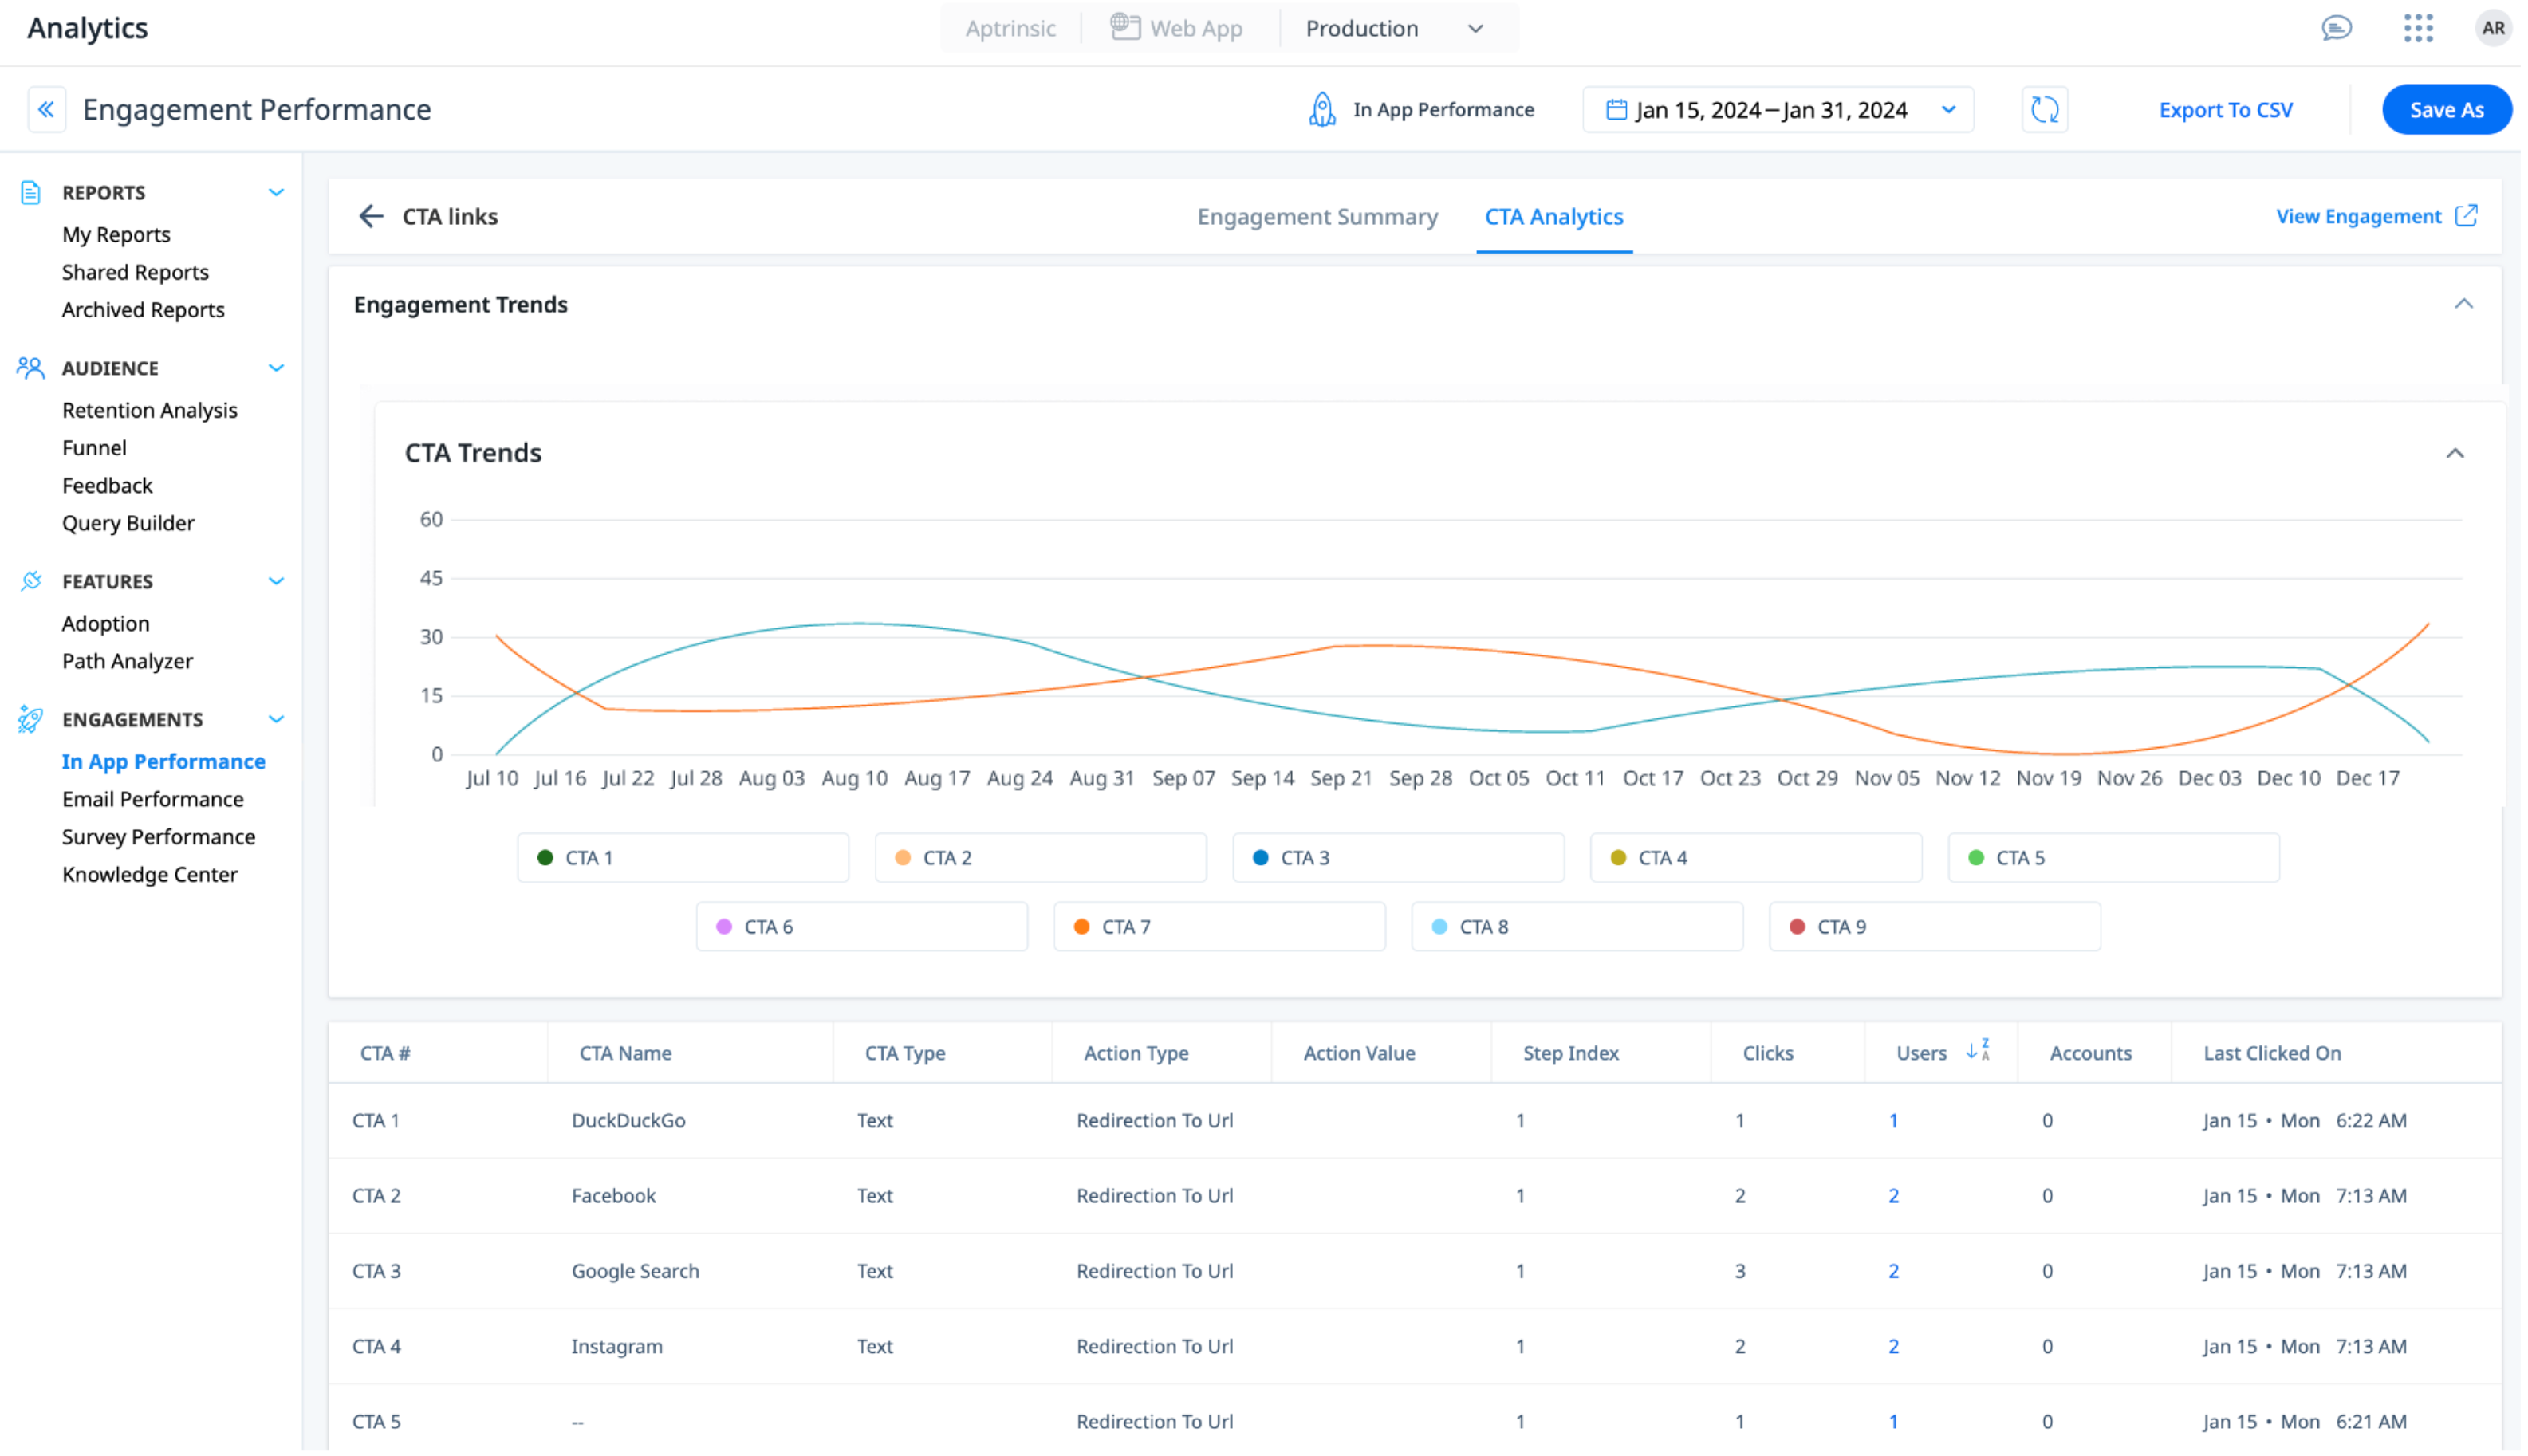
You can drill-down on the CTAs with which a user has interacted, allowing you to identify the CTAs that are resonating with your users. Additionally, a summary of user-interacted CTAs is available to provide a comprehensive overview of user engagement across all CTAs.
This enhancement is designed to provide you with valuable insights into the CTAs linked to engagements for a deeper understanding into how your CTAs are performing.
Note: In-App CTA Analytics is not available for Slider engagements on Desktop.
For more information on engagement CTA analysis, refer to the Understand Engagement Analytics article.
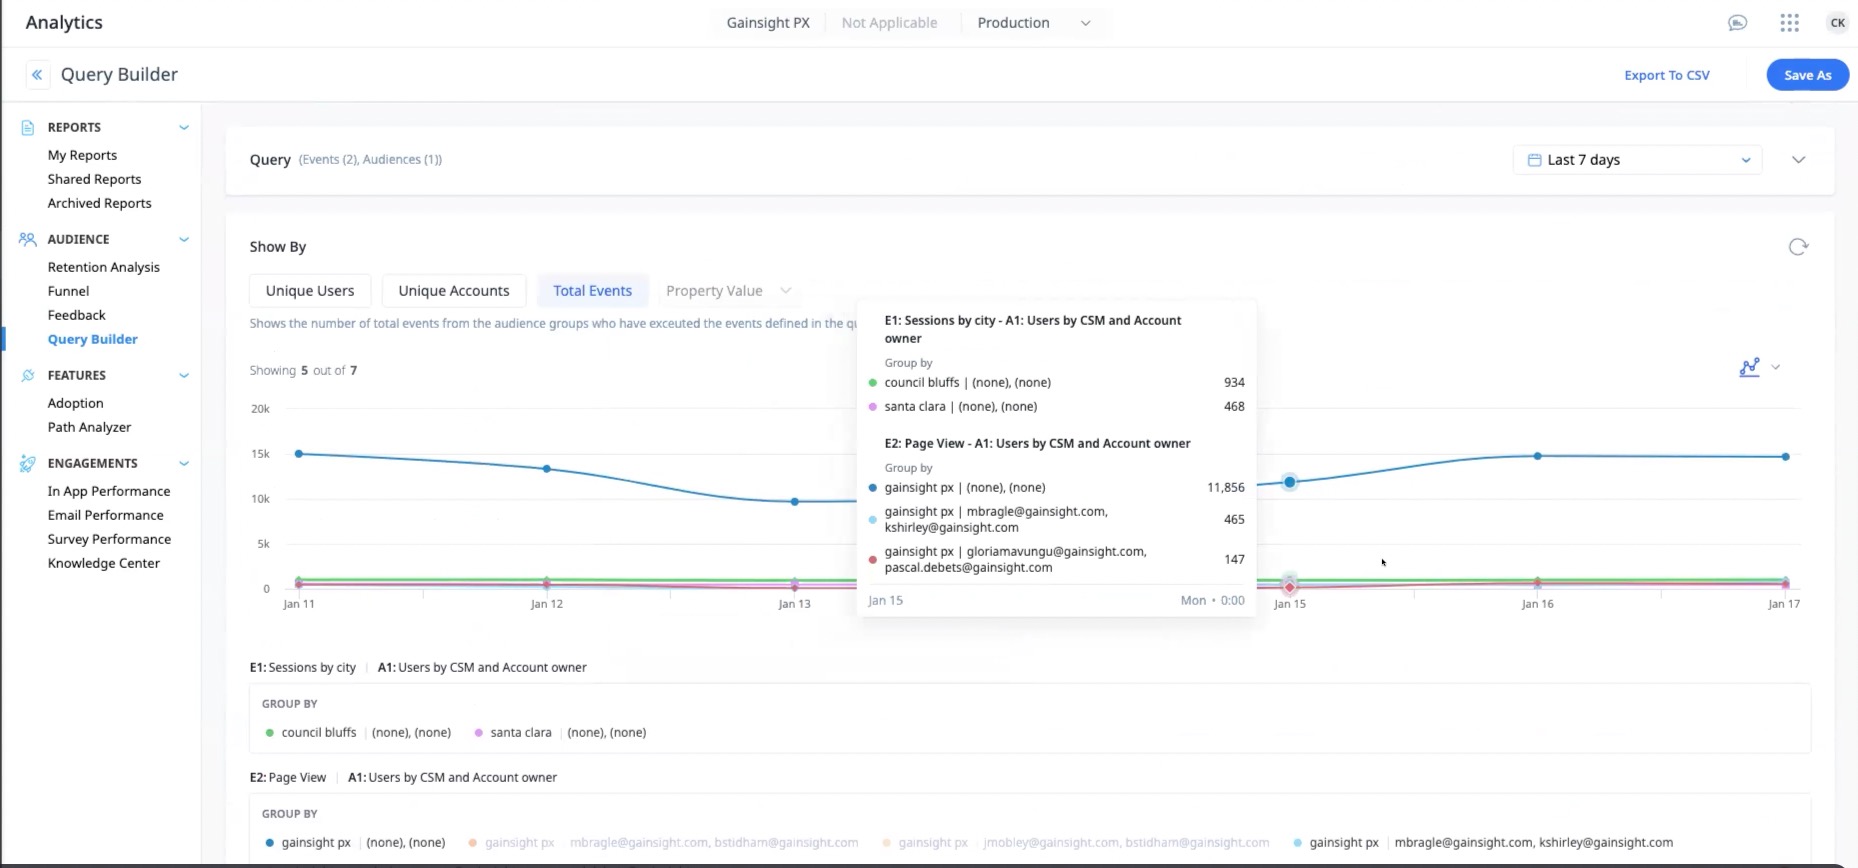
Redesigned Legends and Tooltips in Query Builder
The recent update to the Gainsight PX Query Builder (QB) has improved usability pertaining to how group-by values are displayed and interacted with in both the legend and tooltip sections of the Query Builder.
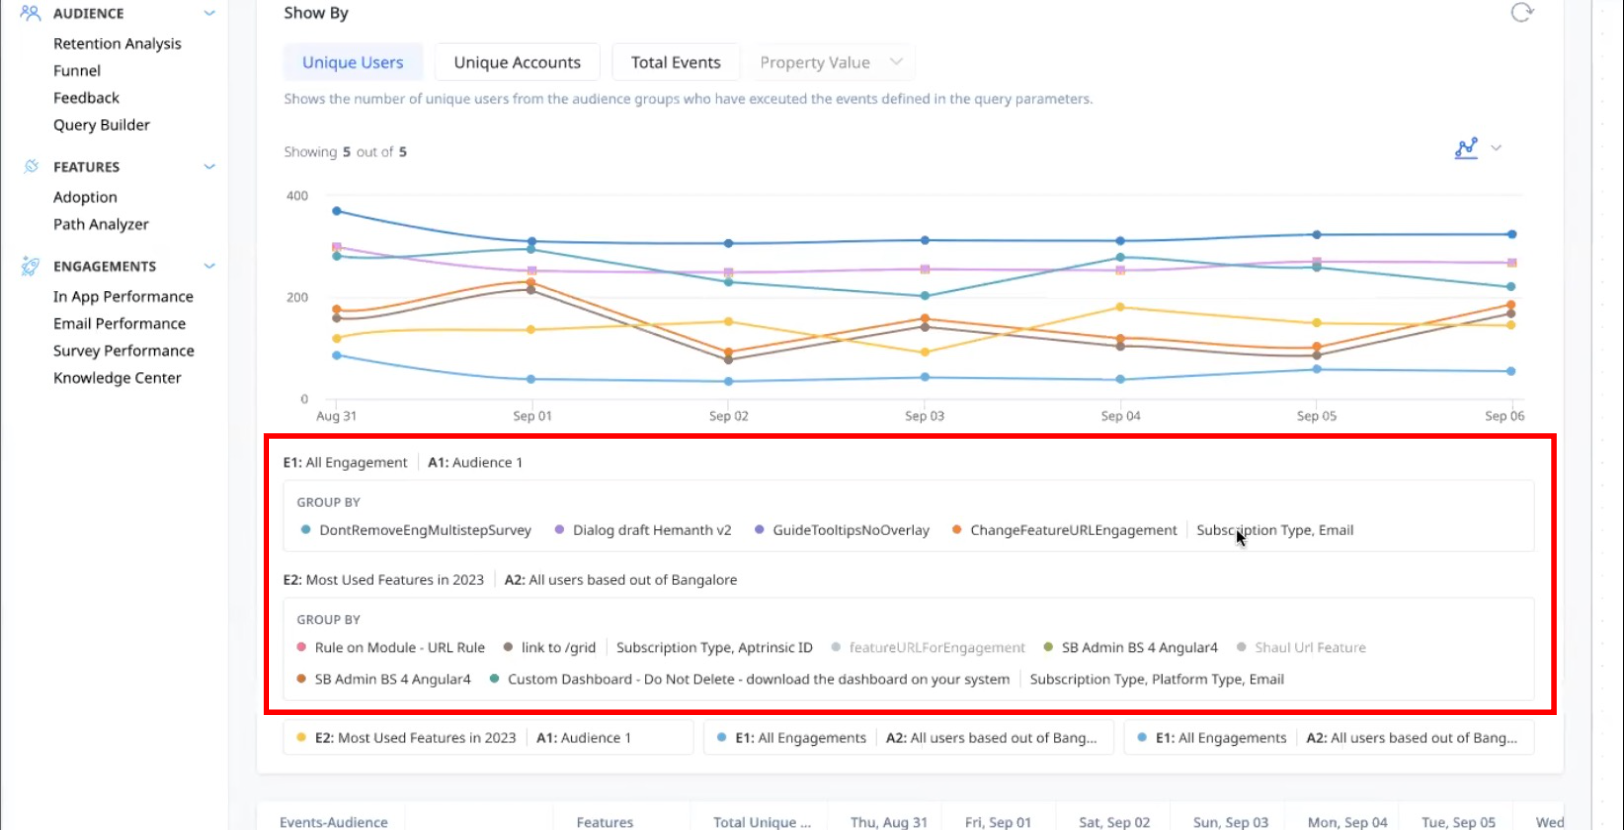
Redesigned Query Builder Legend
- Enhanced Cohort Name Visibility: The complete name of the cohort is displayed in one line, ensuring clarity and ease of reading.
- Unified Group By Section: All the group by values are now displayed in full, in a dedicated section under each cohort name. This unified approach makes it easier to identify the different cohorts, without having to hover on each legend item when the differentiating group by value is truncated.
- Toggle Feature: Each group by value can also be turned ON or OFF with a toggle, enabling you to pick and choose which Query Builder you would want in the visualization.
Redesigned Query Builder Tooltip
The tooltip neatly groups the cohort name with the group by values, designed to enhance readability. By simplifying the tooltip content, you can discover and understand the group by values more easily, improving the overall user interaction with Query Builder.