PX Release Notes February 2020
Version 2.40.0, February 25, 2020
List of Features
| Features | Destination |
|---|---|
| Administration Settings | https://app.gainsightpx.com/settings/subscription |
| Engagements | https://app.gainsightpx.com/engagement |
| Integrations | https://app.gainsightpx.com/settings/Integrations |
| Analytics | https://app.gainsightpx.com/analytics/ |
|
Audience Explorer |
Enhancements
Analytics
PX Analytics enables you to keep your finger on the pulse of product adoption and user satisfaction. You can monitor the metrics that matter to you with custom dashboards, discover which features drive retention within each customer segment and user cohort, map and track customer adoption goals, analyze trends by customer segment, and more.
Improvements to the Funnel Report
Introduction to Funnel Report: A Funnel Report allows you to create a report by choosing page-views, features, and custom events. For instance, you can create a Funnel report that starts from the Product Catalog page and ends up with the check out page to see at which page are the users dropping off.
This enhancement gives you a total picture of how users are using your application. You can now view the time difference between two steps, steps that are causing drop-offs, and so on. This data helps you identify potential issues in your application and improve it to reduce drop off traffic.
The Funnel Report now displays the Thru Traffic and Drop-offs at each step. Thru Traffic is the number of users that successfully visited the current step from the previous step. Drop-offs is the number of users who visited the previous step but dropped off and did not visit the current step of the funnel. The Thru Traffic and Drop-offs are displayed in both numerical and percentile values, on each step. The Thru Traffic is displayed as a color bar that varies at each step. Drop-offs are always displayed as a cross-line graph (this has a very light display).
In the above image, 62 users visited the first step of the funnel. Only 36 of those 62 users visited the second step of the funnel (represented by the green bar). The remaining 26 users dropped off from the first step and did not visit the second step (represented by a light cross line graph). Of the 36 users who visited the second page, only 14 users (represented by blue bar) visited the third step. The remaining 22 users (represented by a light cross line graph) did not visit the third step.
When you click a specific section of the graph, you can view the list of users who represent that section. For instance, in the above image, if you click the green bar, you can view the list of 36 users who constitute the section. Similarly, if you click any cross line graph, you can view the list of users who constitute that section.
Apart from the above enhancements, the Funnel Report now has two new columns; Time From First Step and Time From Prev Step. The Time Elapsed column displays the time taken by user/session to reach the current step from the previous step. The From First Step column displays the time taken by user/session to reach the current step from the first step.
Notes:
- These new columns are not applicable for users that are part of the first step. The users/sessions that are part of the second step will always have the same values in both the columns.
- When you export a Funnel report, the newly introduced Time From First Step is also included in the exported file.
- You can also find these new column’s data when you hover on the Thru Traffic and Drop-off traffic bars.
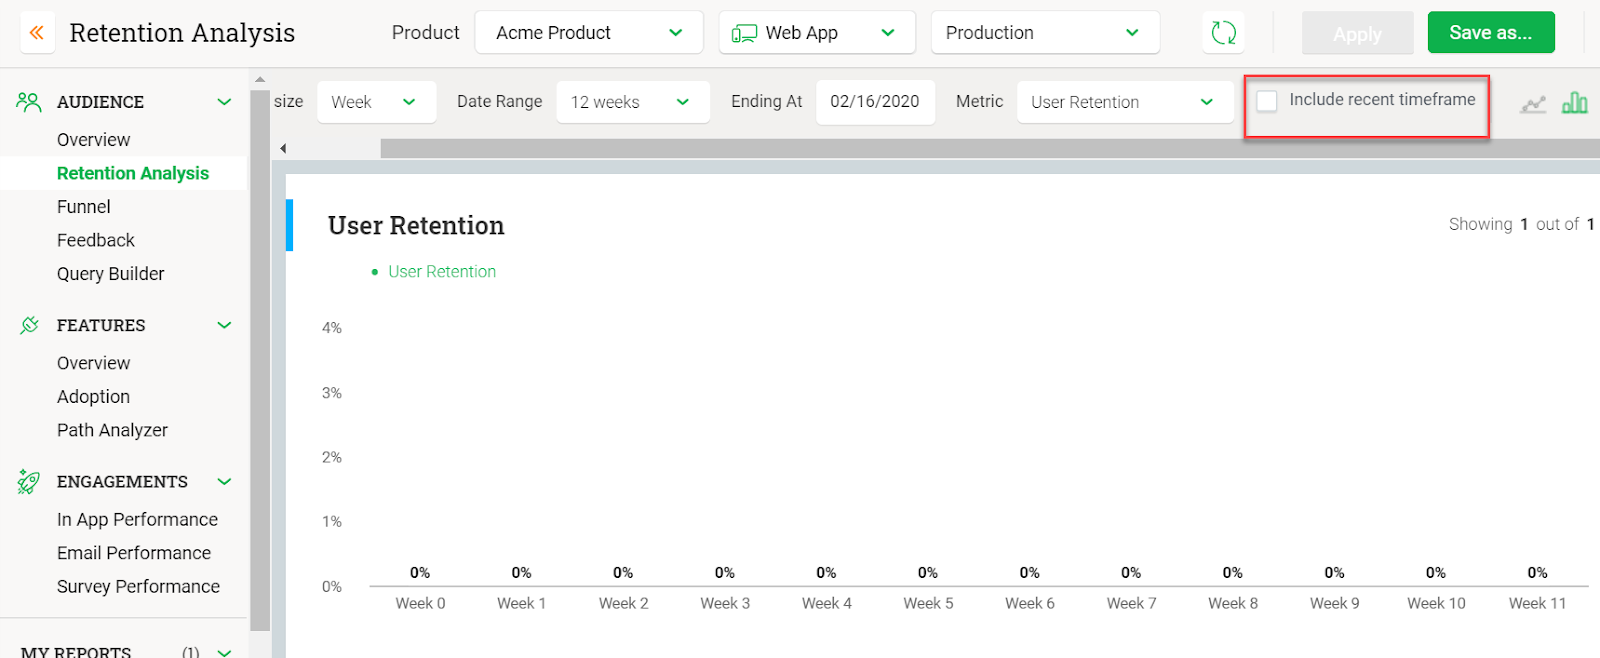
Include/Exclude Incomplete Time Frames in Retention Analysis Report
Retention Analysis report now allows you to choose whether or not to include incomplete cohorts in the calculation of Retention percentage.
The enhancement: Gainsight PX now provides you an option to include or exclude the incomplete time frame of the most recent week or month, in the calculation of the Overall Week’s Percentage. Previously, the incomplete time frames were included by default.
A new check box called Include recent timeframe introduced. The incomplete time frames are now included in calculation, only if this check box is selected. This enhancement provides you with more flexibility in the calculation of the Retention analysis report.
To understand this enhancement, it is essential to understand the Retention analysis report.
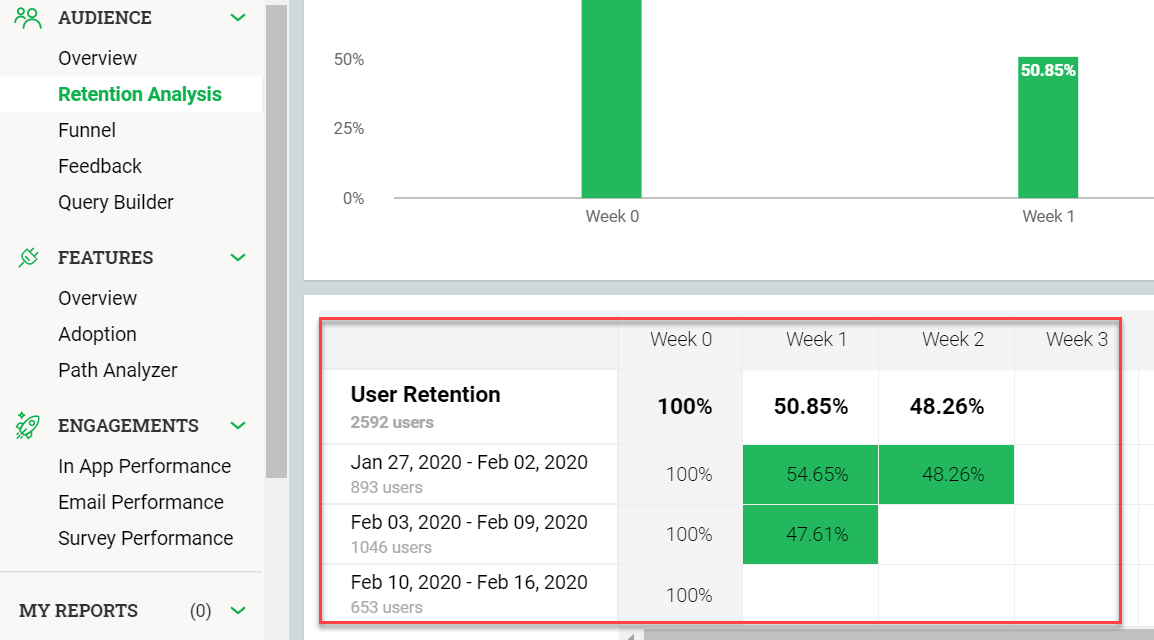
Assume that it’s 14 Feb 2020 today. In the above image, the Retention Analysis report started on 27 Jan 2020 and has Week as the Cohort distribution. So, for the first week of Jan 27 - Feb 2, 893 Users signed up to the application. You can see that Week 0 shows 100%. Next week (Week 1) Feb 3 - Feb 9, 54.65% of the 893 users who signed up in the previous week logged back into the application. In Week 3, Feb 10 - Feb 16 (ongoing week, since it’s Feb 14 today), 48.26% of the 893 users have logged in again. This is an incomplete cohort and the value may go up by the end of the week.
For the Week 1 column, the total percentile value (50.85%) is the average of all it’s retention values across different cohorts (in this case, an average of 54.65% and 47.81%). Similarly, Overall percentage is calculated for all the other Week columns. As few Weeks still have incomplete Cohorts, they are excluded from the calculation of overall percentage, until the end of the week. This skews the overall percentage and brings the value down.
View the Path Traversed by Users After Viewing/Completing an Engagement
Gainsight PX now allows you to view the path traversed by Users, before or after viewing an Engagement. The Path Analyzer report is now enhanced to accommodate this feature. You now have an option to select either an engagement or a feature from where the user or session’s journey began or ended.
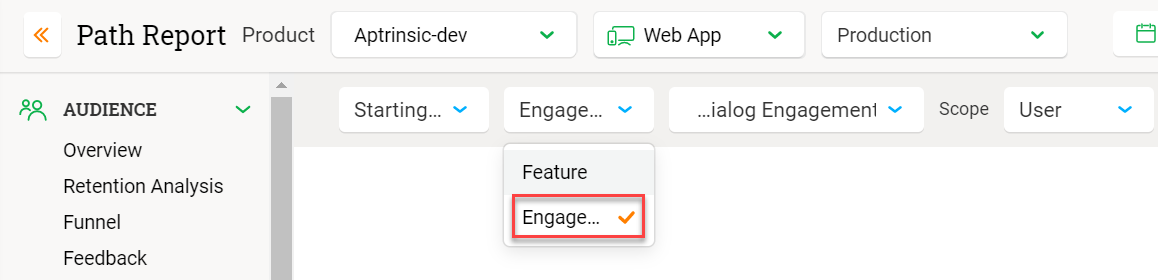
If you select the Engagement option from the newly introduced drop-down menu, you get a list of all the engagements whose Status is either Active, Paused, or Completed.
Business Use Case: Engagements (Dialog, Slider, Guide) are often created to increase the adoption of a certain feature. This enhancement allows you to track the journey of customers after viewing the engagement. You can now identify if customers are using a feature after viewing the related engagement.
To use this enhancement:
- Navigate to Path Analyzer.
- Select Engagement.
- Click Apply.
Analytics Usability Enhancements
Gainsight PX has made general improvements to some of the Analytics reports.
-
You can now use all of the Engagements (except Email) as filters in the Path Analyzer and Retention Analysis reports.
-
You now have the Any option for Engagement Filters in Analytics. Choosing the Any option as an Engagement filter selects all of the Engagements in that category.
Dashboard
Dashboards are a powerful tool to provide quick insight into different key metrics related to product QBR, growth, and adoption. Users can also create their own unique dashboard to access the metrics that matter to them, at a glance.
Add Funnel Widget to Dashboard
You can now create a Funnel report widget on your dashboard. Previously, you could view the Funnel only in the Analytics section.
On the dashboard, when you click Add Widget, you can find the Funnel option in the Audience section of the menu. When you select Funnel, you get a list of funnels that are created by you or shared with you. Select the required funnel to create the widget.
Note: Click Goto Report to navigate to Funnel details in the Analytics section.
Account and Audience Explorer
The Accounts Explorer page displays a list of all your customers. The Audience Explorer page displays a list of all the Users who use your application. You can slice and dice data on these pages by applying various filters.
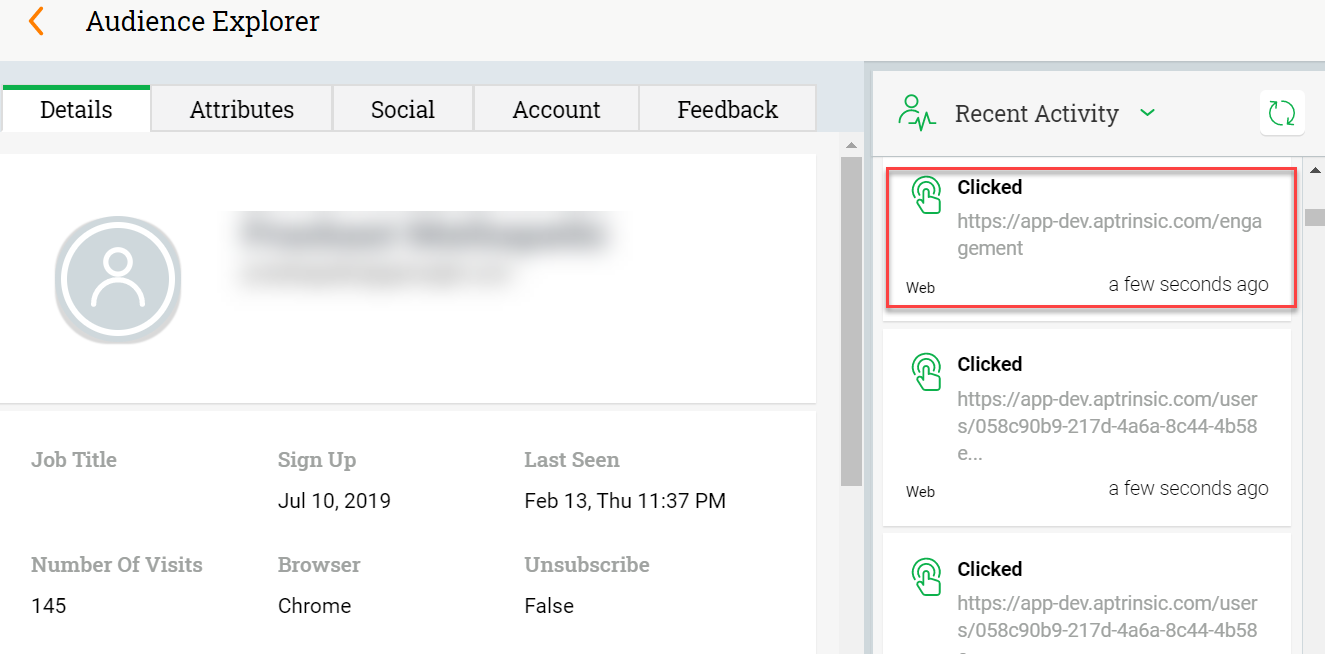
Improved Details on User’s Recent Activities
The Recent Activity section of the Audience Explorer page is now enhanced to display more details on User activities. This enhancement provides you more insights about a user instantly.
The new details available now:
-
New Clicked Section: You can now view a Clicked section in the Recent Activities. This section displays the click events of a user. Specifically, you can now view the URL of the page on which the clicked UI button is located. For instance, if a user clicked the Engagements button, this section displays the URL of the Engagements page.
IMPORTANT: If a button is mapped as a Tag UI Element rule in Product Mapper, then it will continue to be displayed as a Feature Used event and is not displayed as a Clicked event.
-
Detailed Identify Call: You can now view more details in the Identify Call section. The Identify Call is sent to PX when a user logs in to your application. Identify call helps PX to identify the user. Previously, you could only view the Identify ID and the Email of the logged-in user in the Identify Call. Now, you can view more details like the account to which the user belongs to, User’s Name, Custom attributes clicked by the user, and so on. You can view these new details when you hover on an Identify call.
IMPORTANT:
-
Identify Call shows an entry only when there is a change in any of the attribute(s). For instance, if a user logs in with a certain set of attributes and if none of those attributes change on the next login, then there is only one entry for Identify call; the first entry. The second entry for an Identify call is created only if there is a change in any of the attributes.
-
By default, the Clicked Event and the Identify Call events are hidden. You can view them only after selecting their respective filters from the Recent Activities drop-down menu.
To use this enhancement:
- Navigate to Audience Explorer.
- Select the required user.
- Click Full Profile.
- Select the Identify and Clicked checkboxes from the Recent Activity section.
- Click Apply.
Integrations
PX offers a variety of integration options, for the purposes of enhancing productivity (Slack or Zendesk), as well as for data integration (S3, Segment, Gainsight CS, etc.), and to connect your documentation sources with the PX knowledge center bot (Mindtouch, Zendesk, HelpDocs, Salesforce).
Changes to AWS/S3 Extract
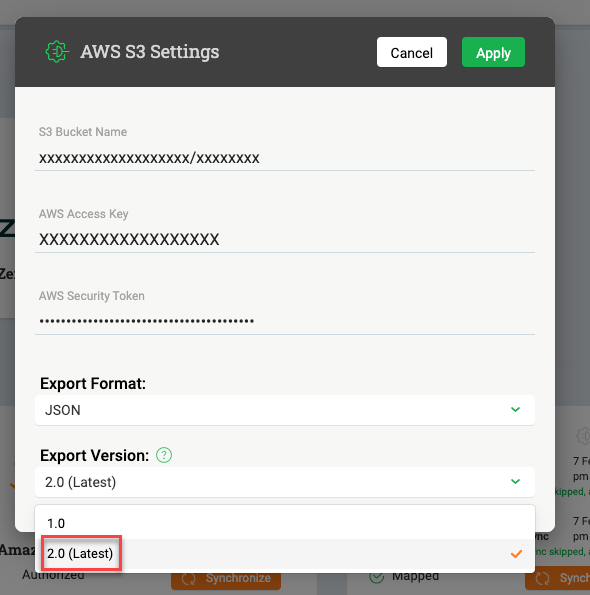
Gainsight has introduced a new version of the AWS/S3 exports. When you select this new version, new fields will be added to the account level and user level rollup files. In the Account level rollup files, two new fields called Product Key and Environment are added. In the User level rollup files, the Environment field is newly added.
To use the new version of S3 export, you must select the 2.0 (Latest) option from the newly introduced Export Version field in the S3 widget.
The list of new fields and New Group by options available in Version 2.0 are as follows:
Note: Values for environment field are: "Production", "Stage", "QA", "Integration"
|
Filename |
New Fields |
Additions to Rollup GroupBy |
|---|---|---|
|
GainsightPX_Account_Custom_Event_Rollups |
productKey, environment |
productKey, environment |
|
GainsightPX_Account_Email_Engagement_Rollups |
productKey, environment |
productKey, environment |
|
GainsightPX_Account_Event_Rollups |
productKey, environment |
productKey, environment |
|
GainsightPX_Account_Feature_Match_Rollups |
productKey, environment |
productKey, environment |
|
GainsightPX_Account_InApp_Event_Rollups |
productKey, environment |
productKey, environment |
|
GainsightPX_Feedback_Responses |
environment |
environment |
|
GainsightPX_Survey_Responses |
environment, contactMeAllowed |
environment |
|
GainsightPX_User_Custom_Event_Rollups |
environment |
environment |
|
GainsightPX_User_Engagement_Rollups |
environment |
environment |
|
GainsightPX_User_Event_Rollups |
environment |
environment |
|
GainsightPX_User_Feature_Rollups |
environment |
environment |
Bloomfire Integration
Gainsight PX now offers an integration with Bloomfire to provide access to knowledge base content in the knowledge center bot. When PX is configured with Bloomfire, you can view and search all of the articles available in Bloomfire through the PX Knowledge Center Bot.
To configure the integration between PX and Bloomfire:
- Navigate to Settings > Integrations. Bloomfire integration appears in the list of Knowledge Center Integrations.
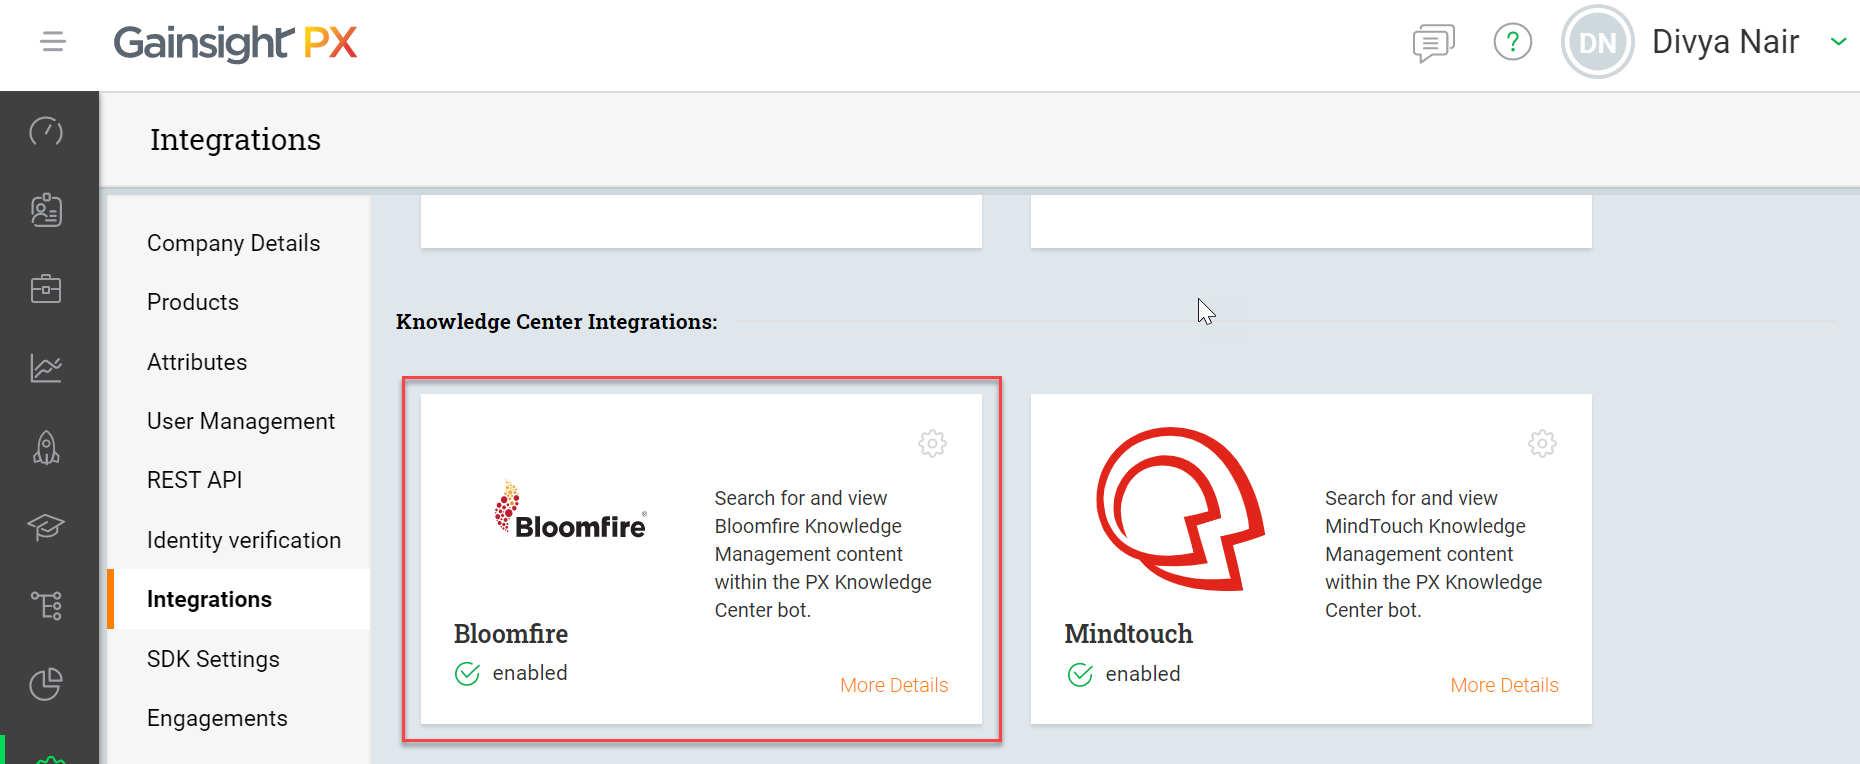
- Click the Settings icon. Bloomfire Knowledge Management window displays.
- In the Token field, enter the API key that you have already generated in Bloomfire.
- Provide the sub domain of your Bloomfire account and your email address and click Apply.
- You can now verify the integration by navigating to Knowledge Center Bot.
To verify if the integration is successful:
- Navigate to Knowledge Center Bot.
- Click Editor and then click Articles Search tab.
- From the list of Doc search Enabled integrations, select Bloomfire. Knowledge Base window displays.
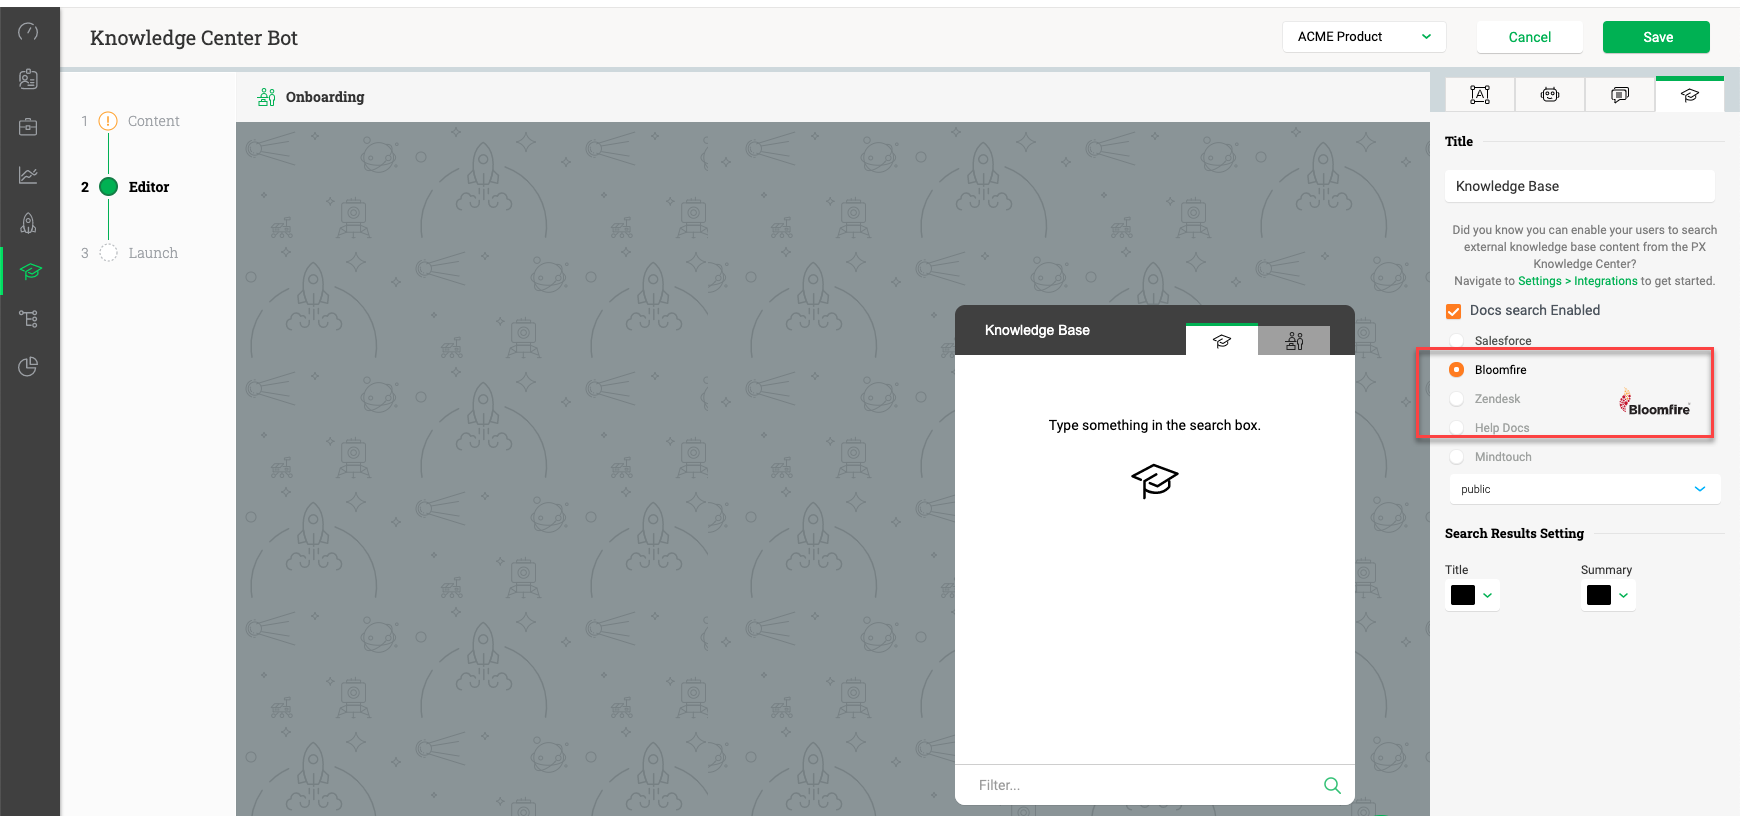
You can now view or search content from Bloomfire in the Knowledge Base tab of the bot.
Engagements
Engagements are the communications that are executed through product (in-app) or emails for a specific audience at a specific time. These communications can be interactive in nature which helps you to share information, receive feedback, and engage customers with your product. The overall goal of using engagements is to increase your customer's product usage.
New CSS Classes for Guide Engagement
Gainsight has now introduced new CSS Classes for the Guide engagement. You can use these Classes to customize the Guide engagement.
The new Classes and their description are as follows:
|
Class Name |
Description |
|---|---|
|
px-dialog-container |
Use this Class to define how the dialog must be displayed. |
|
px-tooltip-container |
Use this Class to define how the tooltip must be displayed. |
|
px-start-guide-dialog |
Use this Class to customize the dialog that is used as the first step of the Guide. This class is not applicable to any other Dialog, used as subsequent step of the Guide engagement. |
|
px-end-guide-dialog |
Use this Class to customize the dialog that is used as the last step of the Guide. This class is not applicable to any other Dialog, used as a step of the Guide engagement. |
|
px-first-step |
Use this Class to customize the first step of the Guide engagement. |
|
px-last-step |
Use this Class to customize the last step of the Guide engagement. |
These Classes are not present by default. You must add the Class and associated CSS content, as required.
To use this enhancement:
- Create a Guide engagement.
- Click the CSS Editor tab.
- Use the classes, as required.
Display Step Numbers in Guide Engagement
You can now display the Step number for each step of a Guide engagement, so that Users can see how many steps there are in total, where they are in the engagement currently, and how much further they have to complete it. When you select the Show Counter check box, all of the steps in the Guide engagement (except hotspot) display the step number.
To use this enhancement:
- Create a Guide engagement.
- Select the Show Counter check box.
IMPORTANT: If you are triggering the Guide engagement with a Badge icon, the badge is not counted as a step.
Customize Text in the Get Started Button
You can now customize the text in the Get Started button of a Guide engagement. Use the Get Started Text section to modify the default text, background color, Label color, and other settings.
New Skip Tour Button in Guide Engagement
Gainsight has now introduced a Skip Tour button in the Guide engagement. This button is present only in the first step of the Guide and works the same as the close icon in the top right corner. You can use the Skip Button Settings section to include/exclude the Skip tour button, modify the text, background color and so on.