Release Notes August 2019
Version 2.24.0, August 21, 2019
List of Features
| Features | Destination |
|---|---|
|
Product Mapper
|
Announcement
The features under the Product Mapper section are currently released with a feature flag only to a select group of customers and are expected to be available to all our customers from 10-Sep-2019. To use the Product Mapper features immediately, please contact your Client Outcomes Manager.
Enhancements
Product Mapper
- Introduction of Instant Mapper in Product Mapper: Product Mapper’s newest feature, Instant Mapper, suggests URL rule features to be included in your product tree based on pages visited by your users.. The suggested features will automatically map to the feature hierarchy in your product while giving you the ability to accept the suggestion, modify its place by dragging and dropping, or choose to ignore the suggested features.
To view feature suggestions, turn on the Suggested features toggle button. When you turn the toggle switch, a list of features along with the modules are suggested.
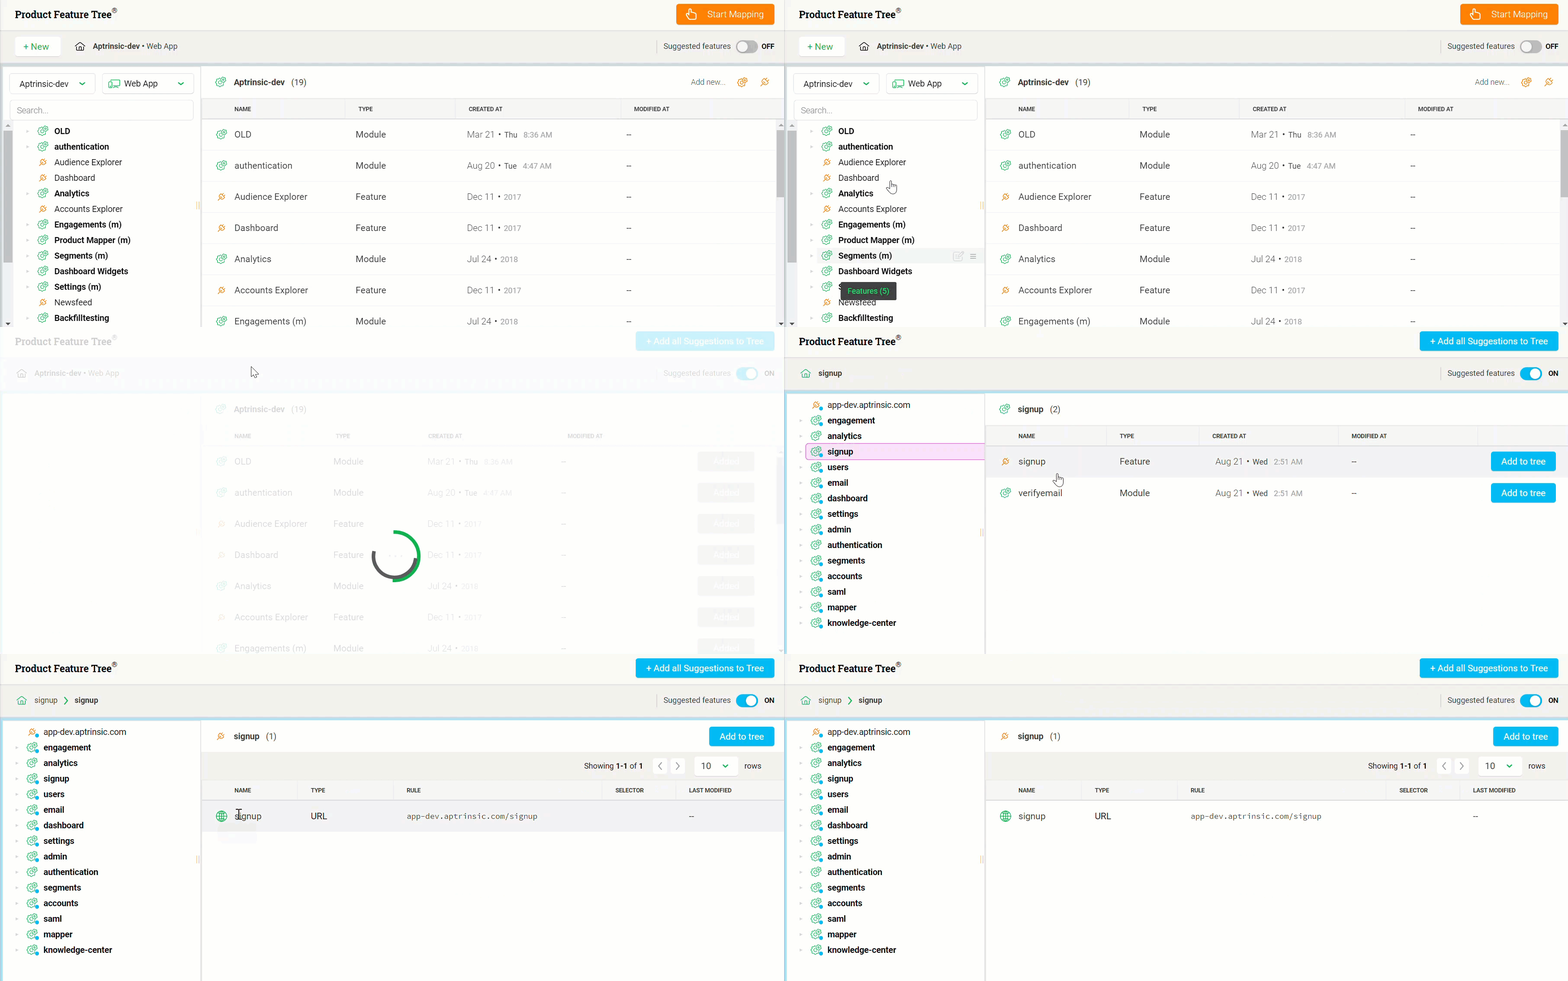
To add a feature or module to the product tree:
- Switch on the Suggested features toggle button
- Click Add to tree.
In the following image, the analytics module has eight features. When you click Add to tree for the Analytics feature, this feature is added to the Analytics module, since it was suggested to be under the Analytics module.
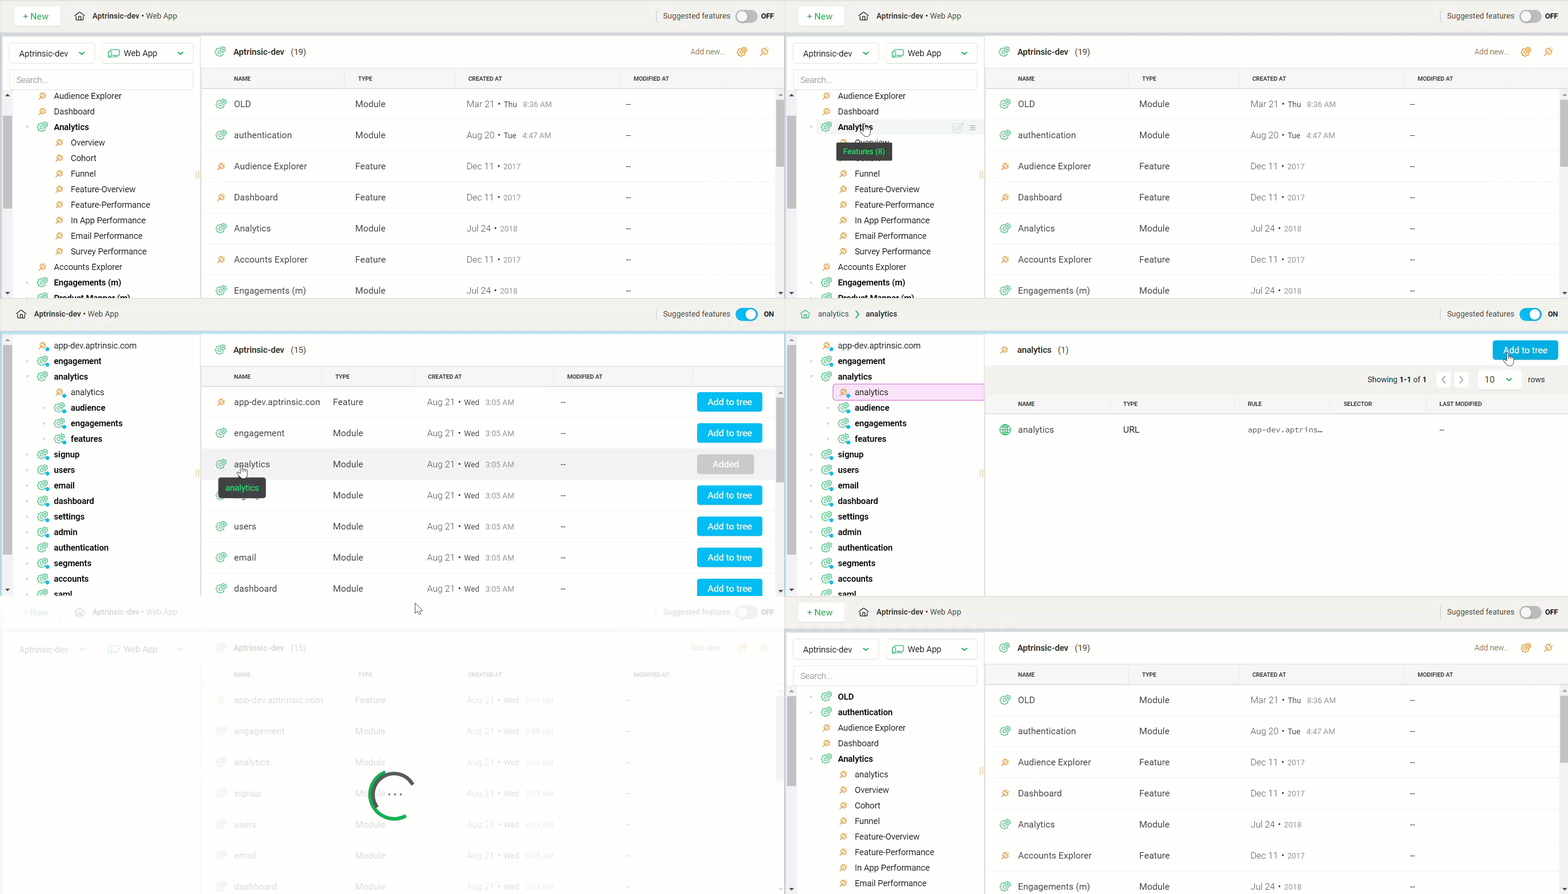 Scenarios
- When you choose to add a suggested module to the product tree, all the features suggested under the selected module are also added to the product tree.
- When you choose to add only a single feature from a module, the other components of the module are not added to the product tree; only the selected feature and the module to which it belongs to, are added to the product tree.
Example:
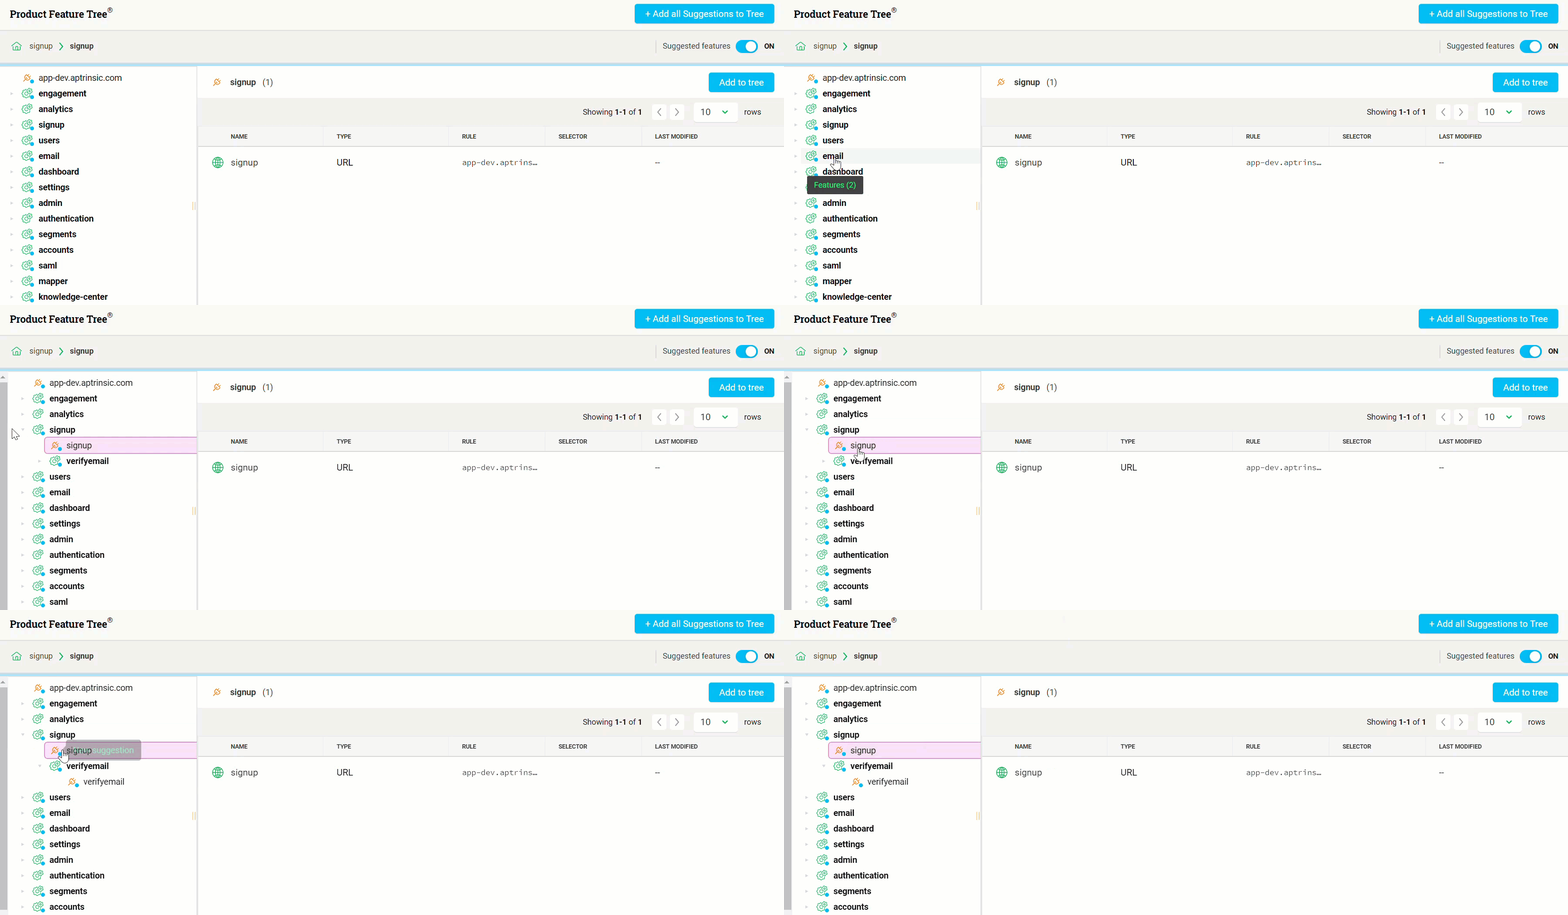
In the following image shows a sample suggested-signup module that has the following two components:
- signup feature
- verifyemail module
Scenarios
- When you click Add to tree for the signup module, the signup module, and both its components are added to the tree.
- When you click Add to tree only for the signup feature, the signup feature and the signup module are added to the tree.
- When you click Add to tree for the verifyemail module, the verifyemail module, verifyemail feature, and the signup module, are added to the product tree.
- New Product Mapper Reorder Button: Previously, the features in the Product Mapper screens were very sensitive and it was possible to rearrange features accidentally. Now, you can rearrange the features only by clicking the new Reorder button for the respective feature and then dragging it.
To use this enhancement:- Click the Product Mapper icon in the left pane.
- Click the Reorder button for the required feature, drag, and drop it, as required.
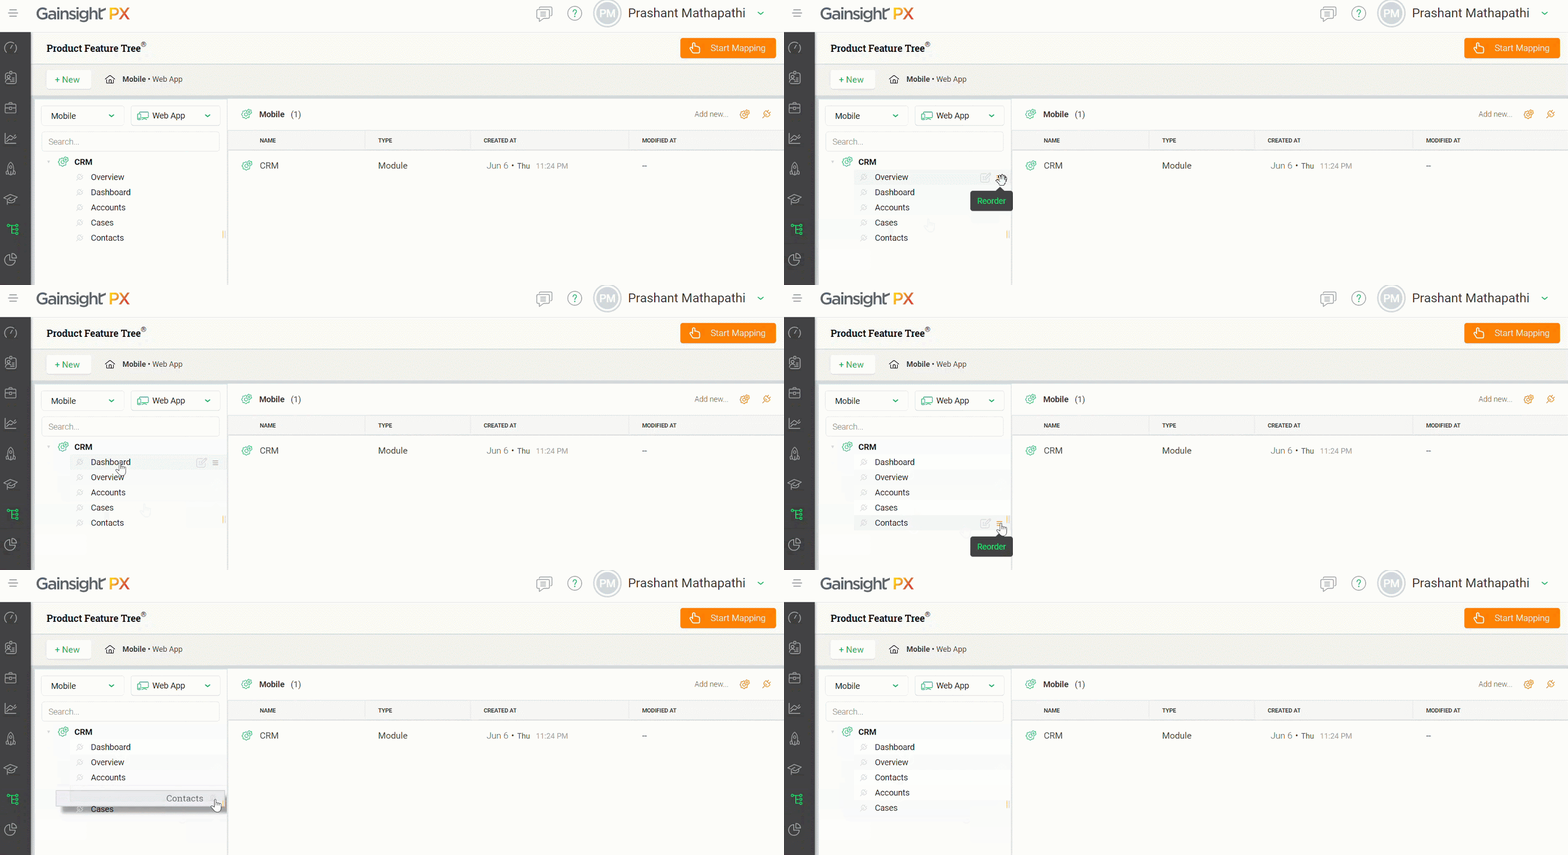
Note: You will continue to receive a warning message when you try to move a feature from one module to another.
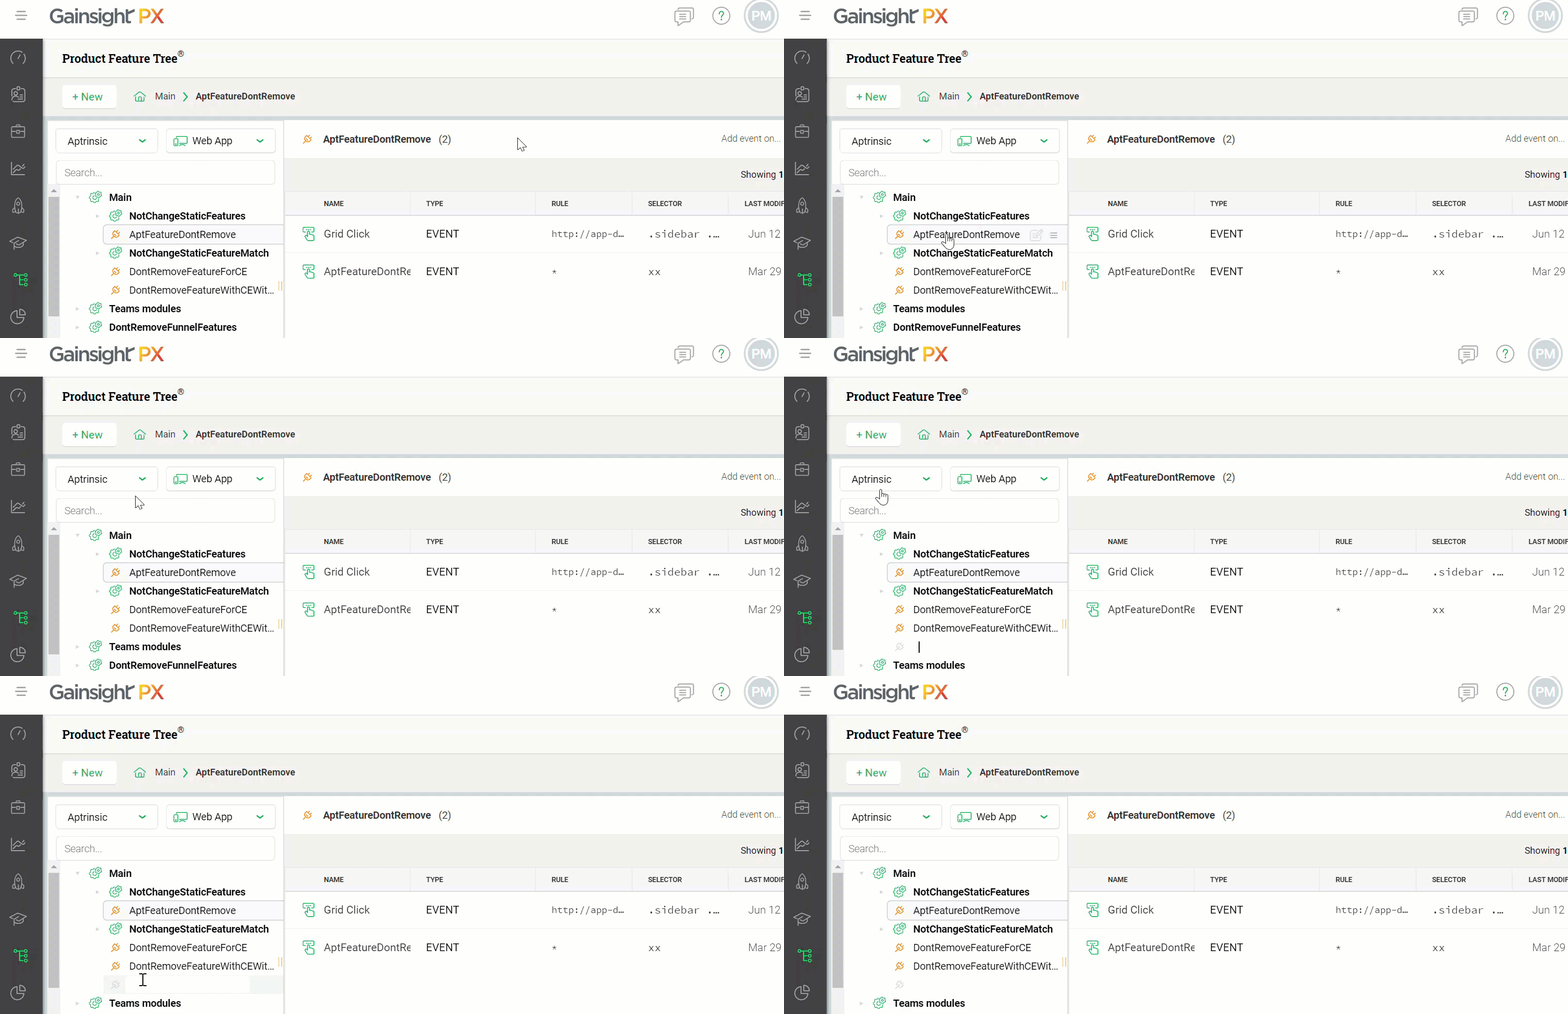
- Search Bar in Product Mapper: Gainsight PX has introduced a search bar in the Product Mapper. This allows you to easily search for a feature or a module, by typing the name in the search bar. This feature is very useful when you have configured lots of modules and features.
- Click the Product Mapper icon in the left pane.
- Enter the name of the module or feature and select the required option from the suggested list of modules and features.
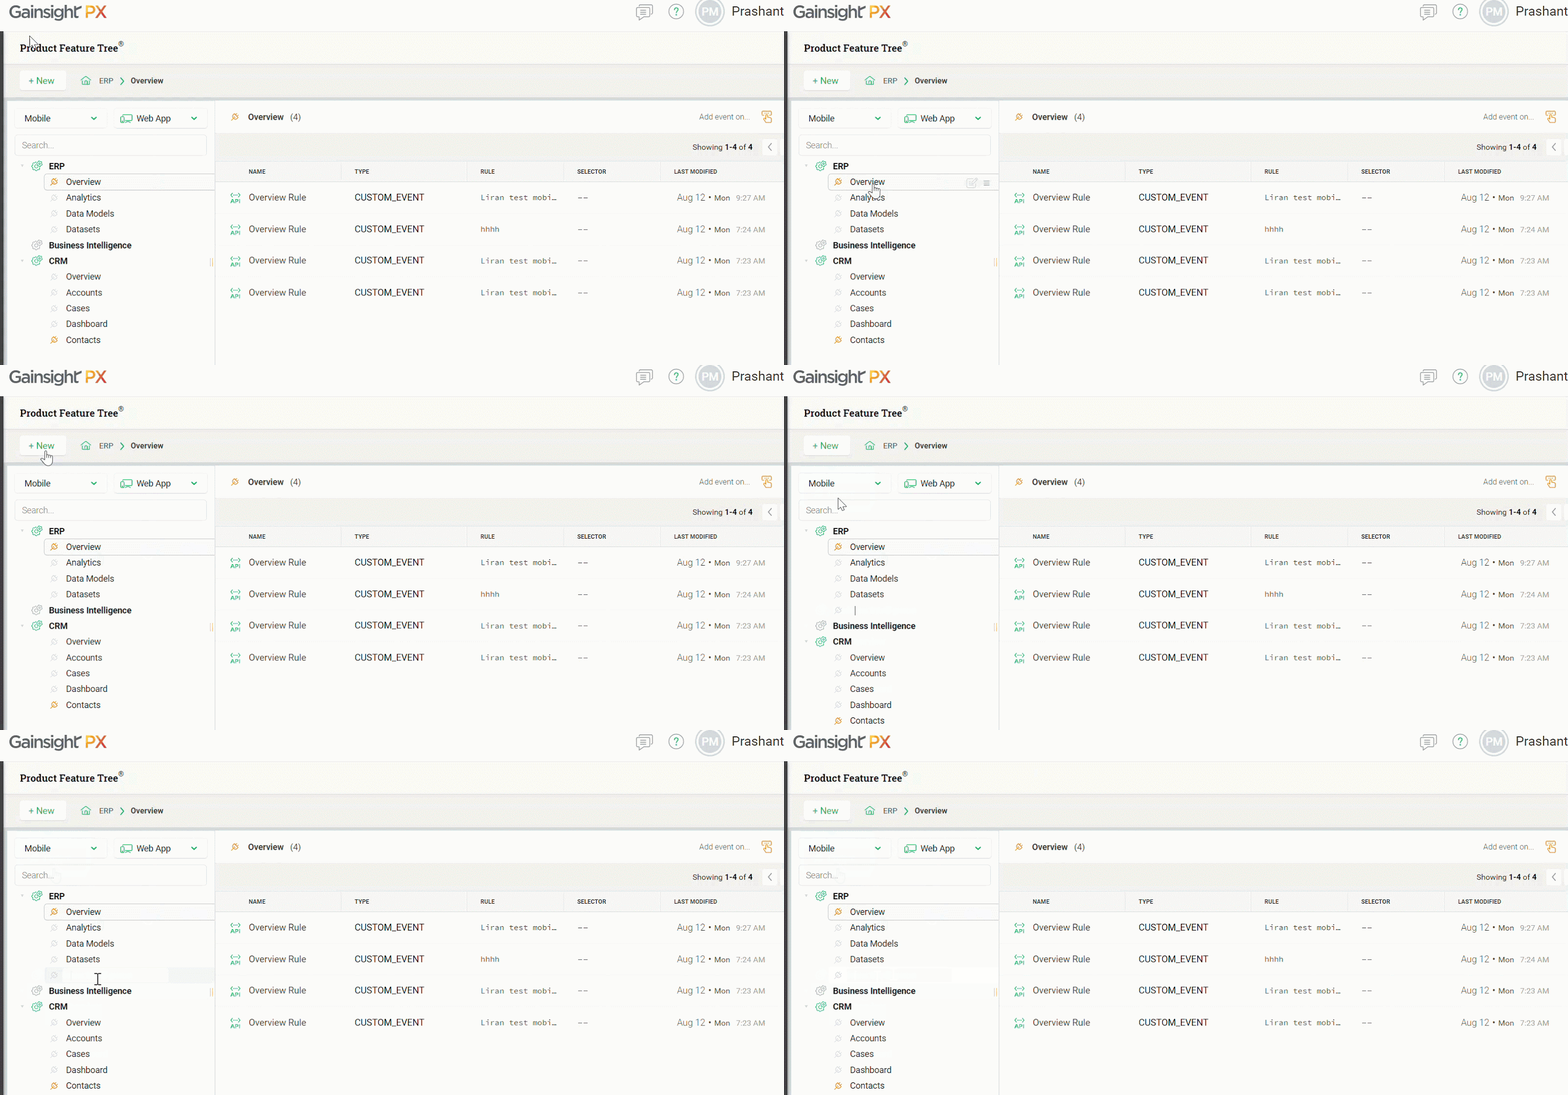
- Add Modules or Features in the Selected Product Tree Location: Previously, when you clicked + New to create a new module or feature, the module or feature was created at the end of the product tree. It required you to manually drag and drop your feature or module under the desired hierarchy. Now, when you select a feature or module and then click the New button, the new feature or module is created in the same hierarchy which was selected, before clicking the New button.
To use this enhancement:- Click the Product Mapper icon in the left pane.
- Select the required Module or Feature under which you want to add a new component.
- From the + New option drop-down menu, select either Module or Feature. You can now see that the module or feature is created in the selected hierarchy.
Version 2.23.0, August 13, 2019
List of Features
| Features | Destination |
|---|---|
|
Engagements
|
https://app.gainsightpx.com/engagement |
|
Analytics
|
https://app.gainsightpx.com/analytics/audience/cohort |
|
Dashboards
|
https://app.gainsightpx.com/dashboard |
Announcement
Gainsight PX has now launched the Mobile SDK to capture data from mobile applications. Consequently, you will see the Mobile Channel filters across various parts of your PX application. Please note that Mobile channel is available to PX customers in early access. For more information on how to enable it, please contact your Client Outcomes Manager.
Enhancements
Engagements
- URL column in Engagements List View: Gainsight PX has introduced a new URL column on the Engagements list view. This column displays the URL rules used in an engagement. If you have configured multiple URL rules in your engagement, the URL column displays only the first rule. However, when you hover your mouse on the rule, you can see all of the URL rules used. If there are no URL rules in your engagement, this column does not display a value.
Analytics
- Ability to Compare events in Retention Analysis report: Gainsight PX now allows you to compare two events, in a Retention Analysis report. The two events to be compared are known as the First Event and Return Event and these drop-down menus are located under the new Advanced section. These drop-down menus contain event types which can be used as filters.
- First Event: When you select an event type in this field, the report filters the number of Users or Accounts who have clicked the event type during a given time frame. The event types supported are features, custom events, page view events, session events, user attributes (sign up, custom attributes of multiple data types), account attributes ( create date, custom attributes of multiple date types).
- Return Event: When you select an event type in this field, the report filters the number of Users or Accounts who have performed the action selected in the First Event field. The event types supported in the First Event field are supported in this field also. Apart from those event types, User and Account attributes are also supported in this field.
The report is generated in Cohort size selected (day, Week, Month).
Business Use case: You can calculate the number of users who signed up in your application (first event) and then compare this value (number of users who signed up) with the number of Users who accessed the purchase page (or any other page), during a specific time period.
To use this enhancement:
- Click the Analytics menu from the left pane.
- Click the Retention Analysis report from the Audience section.
- Click the Advanced option.
- Select the required event types in the First Event (here Sign-up date) and Return Event (here Dashboard page) fields.
- Click Apply.
- Scroll down to view the report.
Understanding the Report
The column highlighted in red represents the First Event field. The columns highlighted in yellow represent the Return Event field. From the above report, you can see that a total of 293 users clicked the First Event (here Sign-up Date). The Cohort size is weekly and 12 weeks are selected. The Cohort size displays the number of users who clicked the first event and the Return event (here Dashboard page). Of the 293 Users, only few viewed the Dashboard page and you can also see the week in which they viewed the Dashboard page.
You can easily switch between Users and Accounts reports. Select the Account Sign up date field from the First Event field. The Return Events are displayed for the Accounts, instead of Users.
Dashboards
- New Session count and Average session duration widgets: Gainsight PX has introduced two new widgets, which you can add to your Dashboards. The Session count widget displays the number of sessions recorded in a given time frame. The Average session duration widget calculates the average duration of all the sessions, recorded in a given time period.
These widgets can simultaneously display data from both channels; Mobile and Web app. You can also choose to view data only from the Mobile or Web app channel. (To learn more about Mobile channel, refer to the Announcements section above).
To use these widgets:
- Click the Dashboard icon from the left menu.
- Select the required channel and product
- Select the required product, from the Product drop-down menu.
- Click New dashboard.
- Click Create.
- Click Add widget.
- Select the Session count and Average session duration widgets.
- Click the All Channels drop-down menu and select the required channel. (To learn more about Mobile channel, refer to the Announcements section above).