Overview of Survey Engagements
This article outlines the different types of Survey Engagements.
Overview
Surveys help you gain insights about customer opinions and enhance your product or services. Surveys help to assess product usage patterns, derive insights, and identify risks. Using surveys, you can measure customer satisfaction at a granular level.
Survey Engagements are a great means to drive communication between you and your customers. Using Survey Engagements, you can launch in-app surveys.
Gainsight PX offers five types of Survey Engagements to suit your business requirements:
- NPS®
- CES
- Rating
- Boolean
- Multi Question
Types of Survey Engagements
NPS®
Net Promoter Score® (NPS®) Survey helps you get the data that you need to analyze customer satisfaction and to predict business growth. The Net Promoter Score® is calculated based on asking customers a single question that predicts the probability of both retention and advocacy: “How likely is it that you would recommend this product/company to a friend or colleague?” Respondents rate their answers on a scale from 0 to 10.
To learn how to create an NPS® survey, refer to the article Create NPS® Survey Engagements from the Additional Resources section.
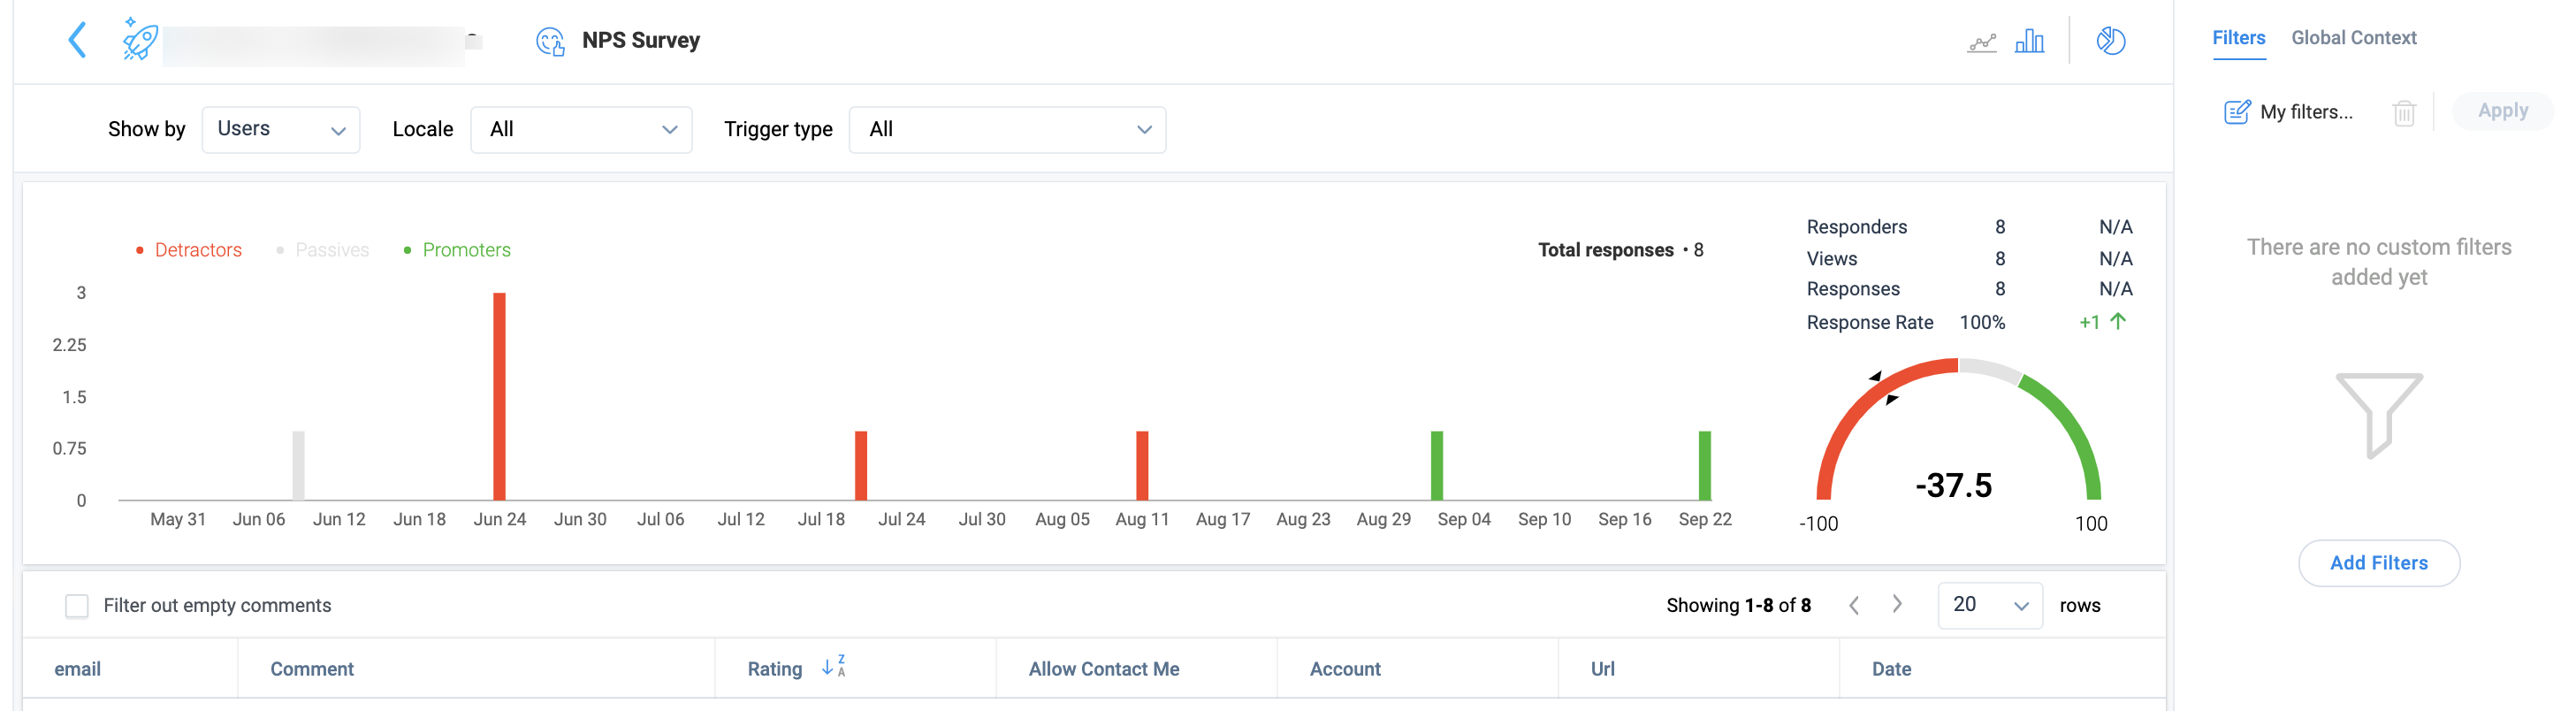
Analyze NPS® Results
Based on the rating of the survey, respondents are classified as follows:
- Promoters (rating 9-10): Happy and loyal customers who will keep buying and referring others
- Passives (rating 7-8): Satisfied but indifferent customers are not enthusiastic enough about your products or services to actually promote them
- Detractors (rating 0-6): Unhappy customers who may recommend against your company, product, or service
NPS® scores are calculated by taking the percentage of respondents who are promoters and subtracting the percentage of respondents that are detractors. This will generate a score ranging from -100 to 100, which is your Net Promoter Score®. For more information, refer to the Analyze NPS® Results article from the Additional Resources section.
Business Use Cases
NPS® is a signal and should be measured over-time for any of the following:
- To segment users and priorities
- To identify room for improvements
CES
Customer Effort Score (CES) Survey helps you measure the ease with which customers use your product or services. A CES survey has a Likert Scale rating of 1-7. A score between 1-3 implies that the user had to put forth High effort while working with your product or service. A score between 4-7 implies that the user had to put forth Low effort while working with your product.
Analyze CES Survey Results
To view the results of a CES survey, click any CES survey from the Survey Performance section or click the eye icon of the respective engagement.
In the following image, four users have responded to the CES survey. All four users have given a score of 7. All the responses were recorded on the same date. You can also view the average of the scores in the semi-circle (7.0).
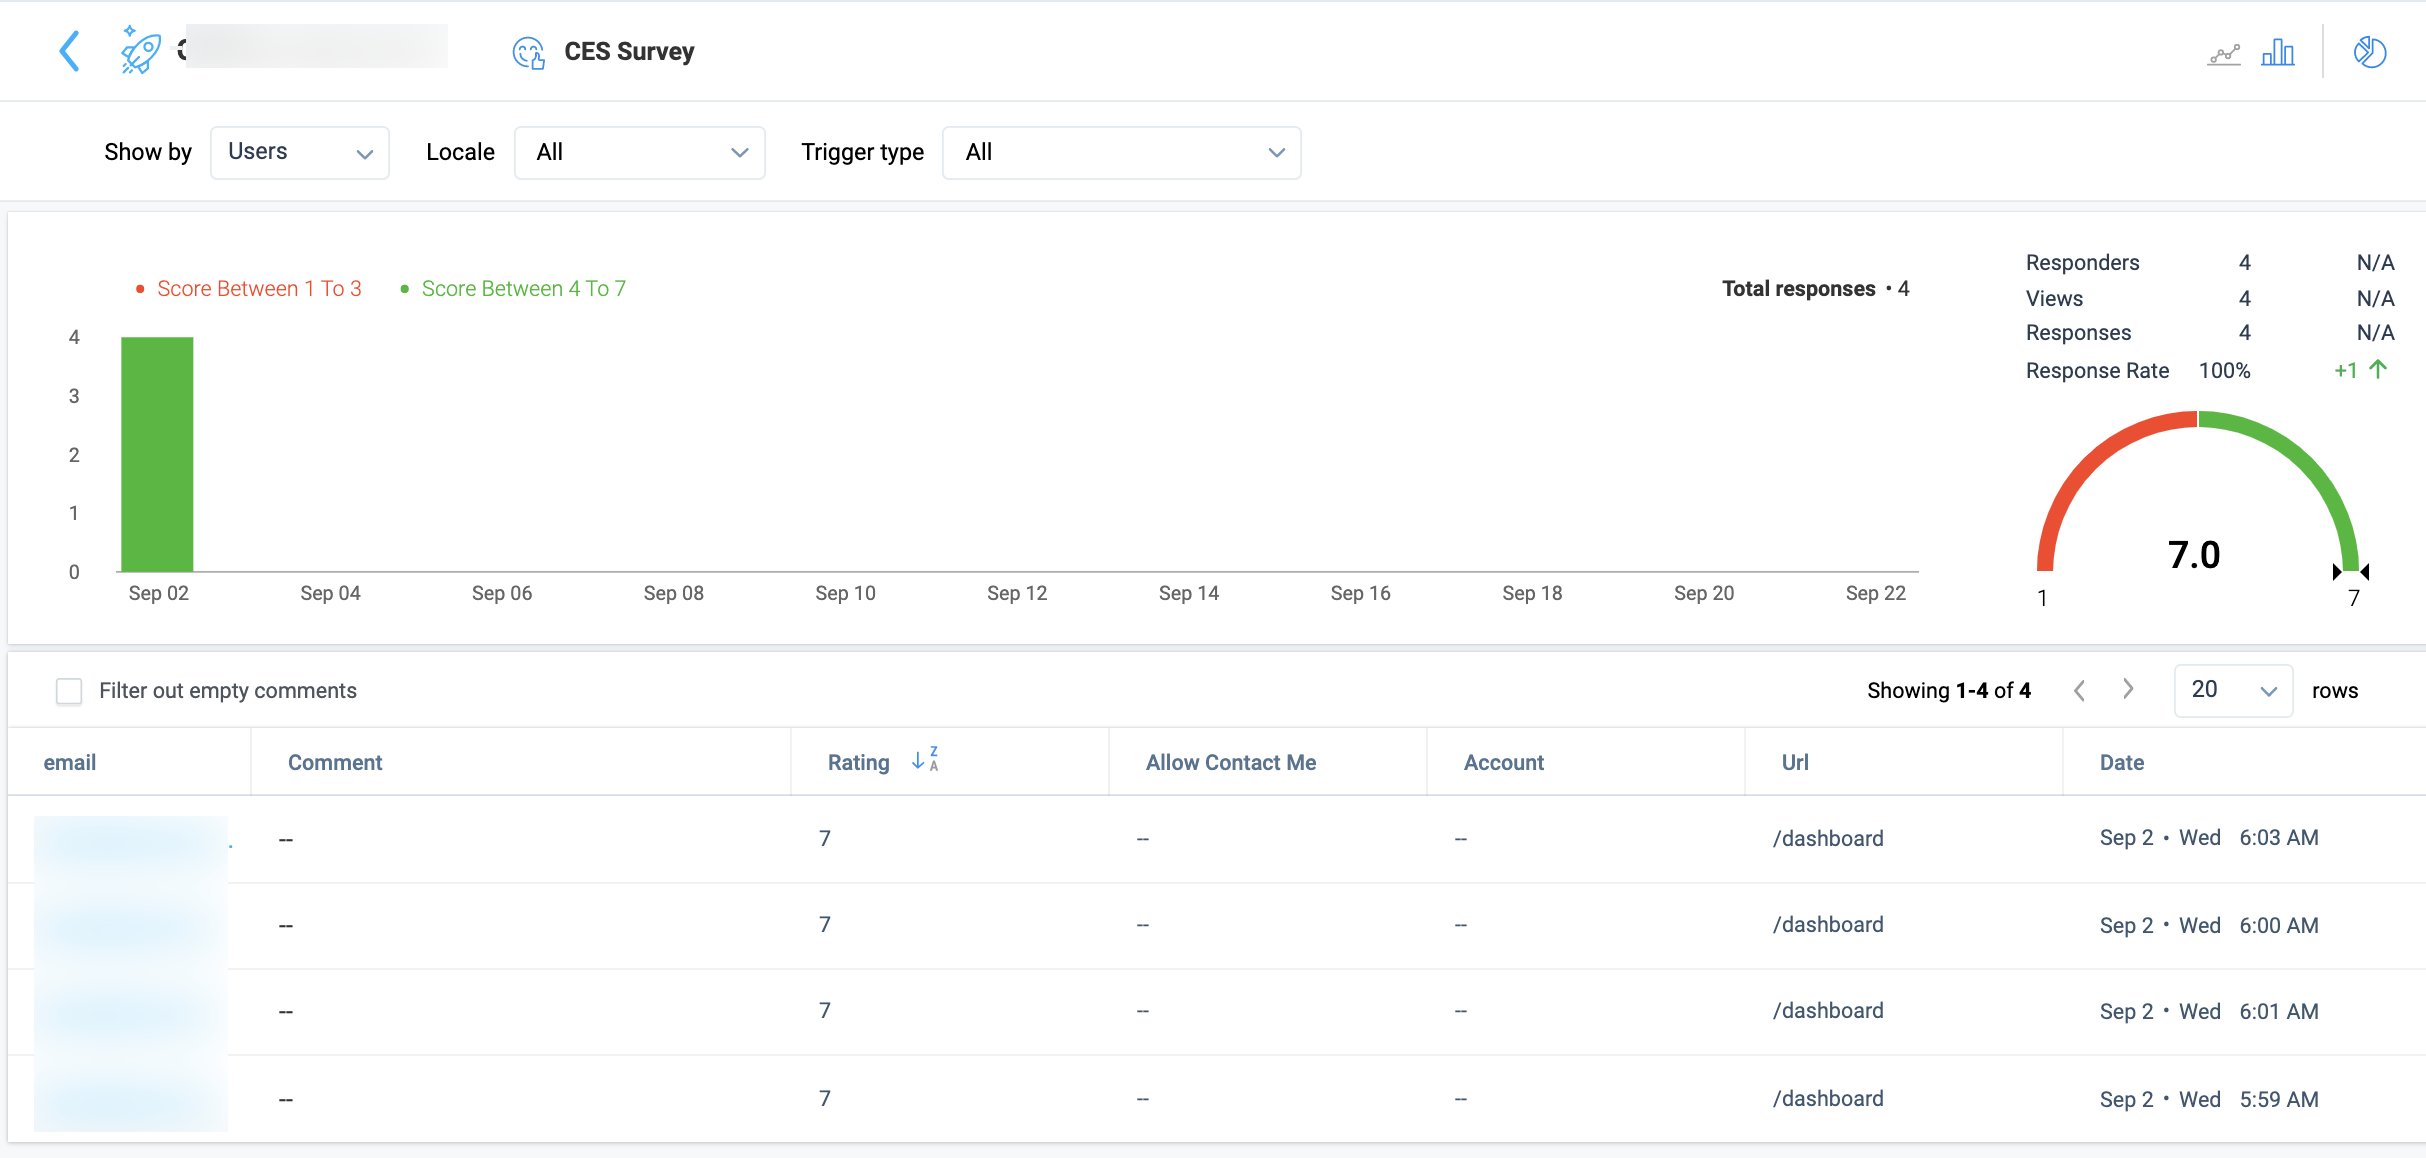
You can also switch from a bar chart to a line chart, apply filters, view results by accounts, or overview.
Business Use Cases
CES survey can be used to measure the customer experience:
- After a user completes a key action/on-boarding (contact with a core or secondary feature)
- After using a newly-released feature/reaching a milestone
- After customer support or educational sessions
Rating
With a Rating Survey Engagement, you can create a survey where you ask people to indicate how satisfied they are with your product or service. You can create single or multiple questions and provide the option to choose the answer from a rating scale. The rating scale helps you to measure the responses in a quantitative manner.
Note: The scale should be created in such a way that respondents can clearly differentiate each option. For example, you could provide a 5-point scale with two positive answers, two negative answers, and one neutral answer:
- Strongly disagree
- Disagree
- Neutral
- Agree
- Strongly Agree
This scale helps the respondent to choose the relevant answer and each respondent can interpret the answers similarly.
For more information on Rating Survey Engagement, refer to the article Use Rating Survey from the Additional Resources section.
Analyze Rating Survey Results
To view the results of a Rating survey, click any Rating survey from the Survey Performance section, or click the eye icon of the respective engagement.
Consider a rating survey where two users have viewed and responded to the survey by giving a rating.
In the following image, you can see the two respondents who have taken the survey and also the individual rating given by each user. The first user has given a 5-star rating and the second user 4 stars. The first user has also given comments. You can select the Filter out empty comments checkbox to view only those responses that have a comment. The bar chart shows that both the responses were recorded on the same date and are divided into two colors to represent the two scores from both users. When you hover on the bar graph, you can view the legends for the two scores (pale green for 4 and bright green for 5).
You can also switch to Line Chart view, apply filters, and view results by company or overview.
Business Use Cases
Rating survey is a great way to measure interaction satisfaction for:
-
Newly released feature
-
How much better (or worse) each customer’s experience with your company has been during the past 6 months
Boolean
Boolean Survey Engagement asks the most basic question of your customers but also allows you to focus on the most important feedback question about your product or service. The survey format consists of one question and two predetermined answers, typically Yes/No.
Example of a Boolean survey question: Did you like our new feature? Yes/No
For more information on Boolean Survey Engagement, refer to the article Use Boolean Survey from the Additional Resources section.
Analyze Boolean Survey Results
To view the results in detail, click the survey or click the eye icon on the Engagement list view to go to Engagement Analytics.
Consider that you created a Boolean survey with three viewers and three respondents.
In the following image, you can see the three respondents who responded to the survey. One respondent has given positive responses and hence the rating is shown as 1 (yes = 1, no = 0). The average of these responses is shown as 1.0 in the semicircle graph.
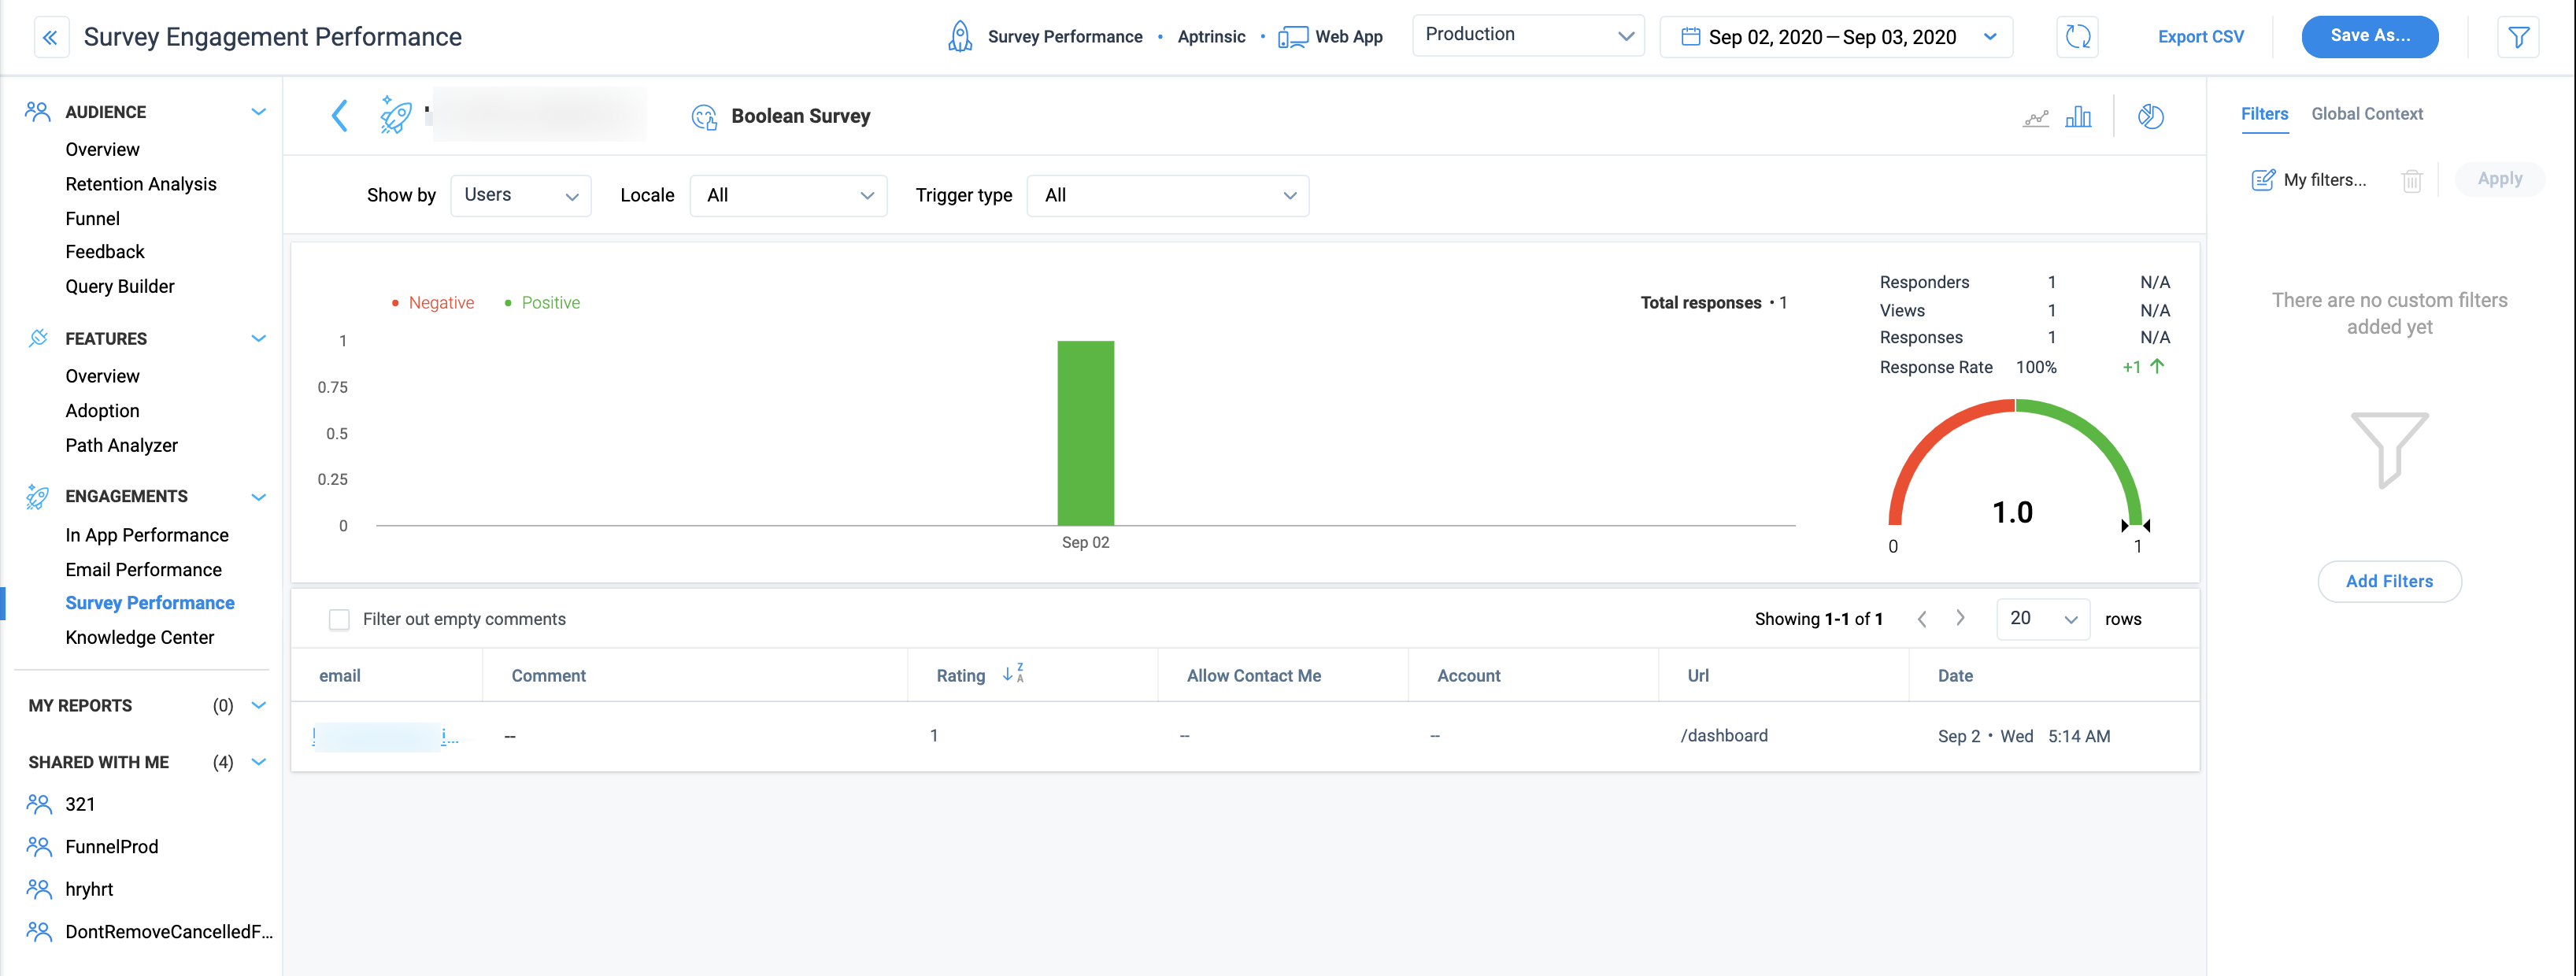
Just like in the case of the above surveys, you can change the view type, apply filters, and switch to a line chart.
Business Use Cases
Great way to measure basic satisfaction for:
- Newly released feature
- One of your core features
- Assess customer support interaction
Multi Question
With Multi Question Survey Engagements, you can create a survey with questions where the respondent can choose one or more answers from the options you define. A Multi Question survey is one of the most structured surveys and the fixed answer options make it easier for your customers to complete the survey.
In Gainsight PX, multi-question surveys can have two types of questions; Multi choice questions, Open Text questions, and Rating questions. Multichoice questions allow you to ask a question and also provide a set of answers. Users can select one or multiple answers. An Open question does not provide any options. Users must enter their answers.
For more information on Multi Question Survey Engagement, refer to the article Use Multi Question Survey from the Additional Resources section.
Analyze Multi Question Survey Results
To view the results of a Multi Question survey, click any Multi Question survey from the Survey Performance section, or click the eye icon of the respective engagement.
Consider that in a Multi Question Survey, two users have viewed and responded to the multi-question survey.
In the following image, you can see the two questions that constitute the survey. The first one is a multi-choice question survey. You can view the options selected by users for this type of question. The second one is an open question. Click a question, to view the list of users who responded to it and to view the answers to the open question.
Business Use Cases
A great way to capture user intent/experience for:
- User on-boarding
- Collecting targeted feedback on specific product features
- Post-NPS® response to get more detailed feedback
Best Practices for Creating Surveys
Few best practices are:
-
Schedule Survey Engagements in such a way that customers are prompted to take the survey in a subtle manner. For example, schedule the Qualification Scope to show the survey once every week until the customer attempts it. Refer to the article on In-App Engagement Qualification Scope from the Additional Resources section.
for better scheduling of engagements. The survey should not appear for customers who have attempted it already.
-
Choose the right wording for the survey questions. Few important parameters to consider are:
- Use simple sentences with no redundant words
- Ensure that there is no ambiguity
- Ask neutral questions that do not favor an answer direction
-
Pick an ideal time to launch your Survey Engagements. For example, you may want to avoid Monday mornings or Fridays, holidays, the end of the quarter, etc. Additionally, if you launch a survey right after the user experiences a new feature, you will get an unbiased response.
-
Use the right scale. The highest score usually maps to a positive experience.
Additional Resources
| Create NPS® Survey Engagements |
| Analyze NPS® Results |
| Use Rating Survey |
| Use Boolean Survey |
| Use Multi Question Survey |
| In-App Engagement Qualification Scope |
| Net Promoter®, NPS®, NPS Prism®, and the NPS-related emoticons are registered trademarks of Bain & Company, Inc., NICE Systems, Inc., and Fred Reichheld. Net Promoter ScoreSM and Net Promoter SystemSM are service marks of Bain & Company, Inc., NICE Systems, Inc., and Fred Reichheld. |