How to Build Basic Reports
Gainsight NXT
Overview
This article explains how to create a basic report, for your business needs, using the Report Builder. The report builder allows you to create reports on Gainsight Objects. You can visualize the data in a variety of table and chart formats, and add them to the 360 page or Dashboards.
Training Resources
If you're new to Gainsight administration, we strongly encourage you to complete our free self-paced elearning courses. Most of the courses are 5 - 15 mins. long, and help you get up to speed on key features and their business uses.
Create New Report
To create a new report:
- Navigate to Administration > Analytics > Report Builder to view the Report Repository or the Report List View page. Click Report Repository to learn more about Report Builder Repository.
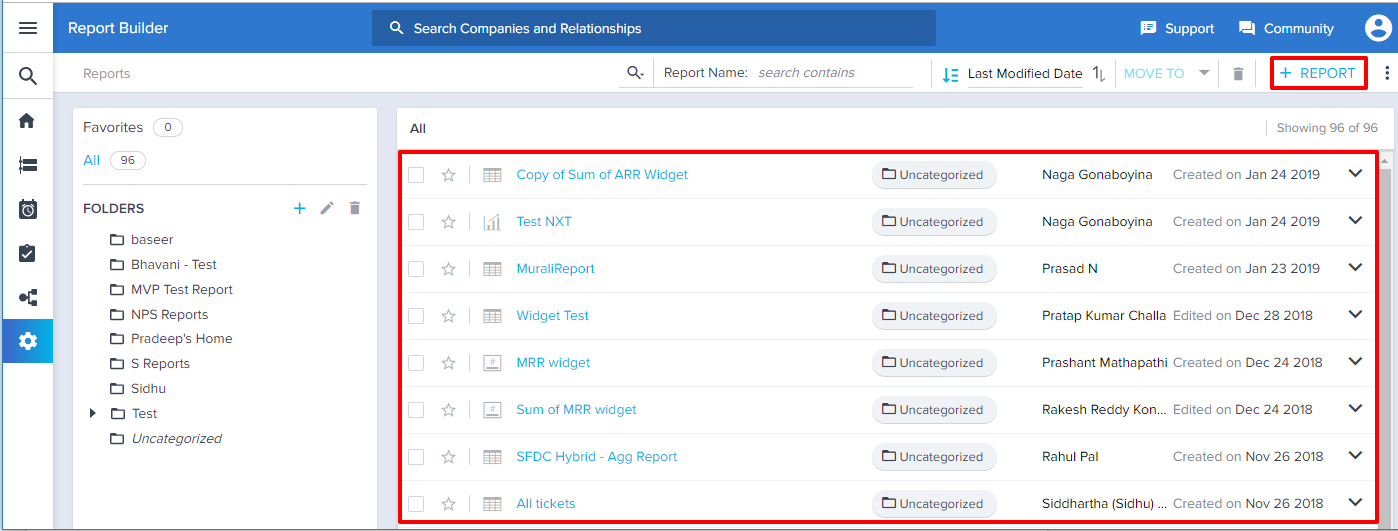
- Click the existing report name to edit a report (or) click +REPORT to create a new report.
- Select the required object from the MDA Data source dropdown list (or) you can enter the object name in the Search bar.
Most commonly used objects:
- Company: general customer information, including onboarding stage, number of employees, ARR, Current Score, Industry, Company Type, Renewal Date, Original Contract Date, etc.
- Activity Timeline: Subject, Activity Type Name, Activity ID, Activity Date, etc.
- Company Person: general attributes of the person in association, including the status of a person, GSID, Role, etc.
- NPS® Survey Response: Responded Date, Score Type, NPS® Score, etc.
- Calls to Action: for customized CTA reason/status/type reporting (Call to Action ID is a unique identifier for each CTA)
Create New Report on Salesforce Objects
Gainsight NXT in Salesforce CRMContent in this section supports Gainsight NXT accessing through Salesforce Login. To learn more about Gainsight NXT in Salesforce, click here.
- Click here to expand for more information on how to create a New Report on Salesforce Objects
-
If a Salesforce connection is established in your org, using Salesforce Connector, you can see the Salesforce objects under Select data source dropdown list, based on your login method.
- When you login to Gainsight NXT via Salesforce, you can see the Salesforce objects under Select data source dropdown list, and can create reports on those objects.
- When you login to Gainsight NXT directly, you cannot see the Salesforce objects under Select data source dropdown list.
Most commonly used Salesforce objects:
- Account: general customer information, including number of employees, Current Score, Industry, Account Type, Renewal Date, Original Contract Date, etc.
- Contact: Account ID, Account ID Name, Email, etc.
- Case: Case Type, Case Origin, Case Reason, etc.
- When you login to Gainsight NXT via Salesforce, you can see the Salesforce objects under Select data source dropdown list, and can create reports on those objects.
Show me
Once you select an Object from the data sources, you can add the fields in the object to Show me, to include in the report.
To add fields to Show me:
- Click the + button.
- Enter the field name in the Search bar or you may scroll down and select the required field.
Notes:
- Based on your object selection, you will see all of the fields and lookup fields associated with that object.
- Fields added to Show Me can be reordered by dragging and dropping if required.
- You can add a maximum of 10 fields to 'Show Me', if there is a 'By' field.
Lookup Fields: A lookup relationship is used to combine the fields from multiple objects based on a common field. For instance, if you want to build a report on the Activity Timeline object to contain the ARR of the company, click + on GS Company Id and select the ARR.
Here, the objects Activity Timeline and Company are joined via the GS Company Id field which looks up to Company.
![Lookup new [2].png](https://support.gainsight.com/@api/deki/files/9045/Lookup_new_%255B2%255D.png?revision=1&size=bestfit&width=850&height=454)
Details of Self-look up fields: You can also add the details of the Self-look up fields, while building reports. For instance, when you build a report on the User object, you will be able to add the Manager details by using the expandable fields (by clicking +). Similarly, when you build a report on Company object, you will be able to add the Parent Company details to the report.
Company and User objects have the standard self-lookup to Parent Company and Manager respectively. But, you can also create custom self-look up fields. Refer to Gainsight Data Management article for information on how to create lookup fields.
.gif?revision=1)
Note: Under expanded Self-look up, you cannot see additional lookups. Currently, only 1 level of self lookup is supported.
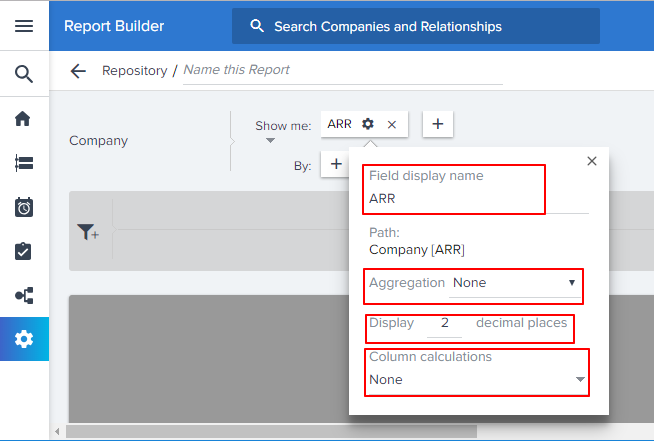
Click the Settings/Gear icon next to the field label to update Field Display Name, Aggregation, Decimal places and Column calculations. For more information on Aggregation and Column calculations, refer to Report Settings and Advanced Options article.
For the dimension type fields added to Show Me, you will see an additional option called Enable Row Grouping. Row Grouping in Reporting allows you to visually group the rows/records in a report by a dimension type field without aggregating all of the other fields. For more information, refer Row Grouping.
You can view the description of the Gainsight Custom Objects and Custom Fields when hovered.
Note: To view the descriptions, ensure that you have already described the Objects and Fields in the Data Management page.
Formula Fields
Using Formula Fields in reporting, you can instantly create a formula field on Gainsight objects, based on your business needs. The Formula Fields created in a report can be consumed in other functionalities of Gainsight, including, Dashboards, C360/R360, Success Snapshots, etc.
Currently, in Gainsight, you can also create Formula Fields from Rules Engine and Data Management, and can use them in reports.
Note: You can create a Formula Field from Show me and By. You can also apply Filters using the newly created Formula Fields.
For more information on how to create a formula field, refer Formula Fields in Reporting.
By
To slice and dice or segment the data in a report, a field is added to By. A maximum of 5 fields can be added to By. A field will have to be considered Groupable by MDA in order to use it in the By section. If you do not add a field to the By section, you can only view the data in a table.
To add fields to By:
- Click the + button.
- Enter the field name in the Search bar or you may scroll down and select the required field.
Notes:
- Once you add a field to the By section, all the fields in Show Me are aggregated as shown in the above image.
- You cannot add the following data types to the By section:
- Rich Text Area
- Multipicklist
- Measures (Number, Currency, and Percentage, etc.)
- Address
- URL
Once you add a field to the By section, click the Settings/Gear icon next to the field label, you will see the below options:
- Field display name: The Field Display Name is the label that appears on your report. You can change the display name as per your choice.
- Apply Pivot
- Summarized by
- Aliases
Apply Pivot
You can see the pivot option only when you have a minimum of two fields in the By section. And you can apply pivot only on one field at a time. For more information, refer Apply Pivot.
Summarize by
In the By section, when you group by time, you can summarize by Day, Week, Month, Quarter, Year and Fiscal Year/Fiscal Quarter. Summarize By is applicable only to the date-related fields.
Apart from the below listed objects, you can summarize the date fields by Day, Week, Month, Quarter, Year and Fiscal Year/Fiscal Quarter across all of the Gainsight application areas.
- Email Logs
- Email Raw Events
- Unsubscribed Emails
Fiscal Year: You can Filter the date field/time series data by Fiscal Year/Fiscal Quarter and summarize this data by Fiscal Year/Fiscal Quarter. The Fiscal Year label on the report displays either the Starting Year or Ending Year, based on the settings defined by your admin in the Application Settings page. For more information on Fiscal Year settings, refer to Application Settings.
Important:
- While building reports on Gainsight objects, Gainsight honors the Standard Fiscal Year Settings defined in Application Settings.
- While building reports on Salesforce objects when you login to Gainsight NXT via Salesforce, Gainsight honors both the Standard and Custom Fiscal Year Settings defined in Salesforce.
Aliases
Aliases allow you to rename or customize your labels in the chart visualizations, to make them more contextual to the target audience. For example, when you are sharing a report to your director, and your director may not be aware of the jargon used in the report, to make charts/reports more contextual, you can rename labels in the reports. For more information on how to Configure Aliases in Reports, refer Configure Aliases in Reports.
RUN
Click RUN to see a visualization of the data. By default, your data will be displayed in a table.
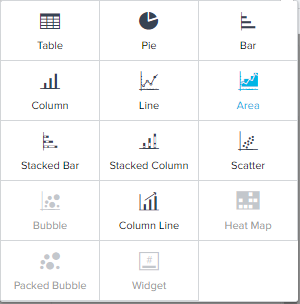
Visualization Types
Click the Visualization Type icon and select the visualization type from the following options (visualization types are dependent on fields selected in Show Me and By):
- Table
- Pie
- Bar
- Column
- Line
- Area
- Stacked Bar
- Stacked Column
- Scatter
- Bubble
- Column Line
- Heat Map
- Packed Bubble
- Widget
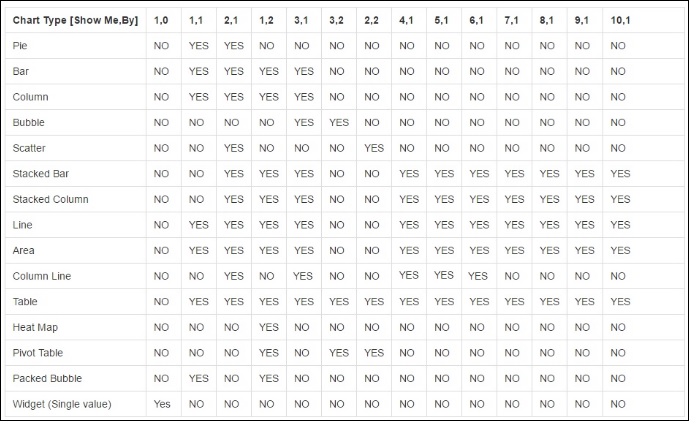
The following image describes the combination of Show Me and By fields required to generate each of the above-mentioned visualizations.
Note: Graphical reports created will honor scorecard colors as well as colors configured on Gainsight picklist items.
Filters
To filter the data that is being displayed on the graph, click the Filter icon. Two types of filters are allowed:
- Locked Filters: Filter value remains fixed and cannot be changed in the consumption area such as Gainsight Home. Click the lock icon to lock this filter.
- Unlocked Filter: The value can be changed in the consumption area such as Gainsight Home. Leave filter unlocked to allow end users to change the value.
To apply filters:
- Select the field you want to filter on.
- Choose the operator and then input the data and click APPLY.
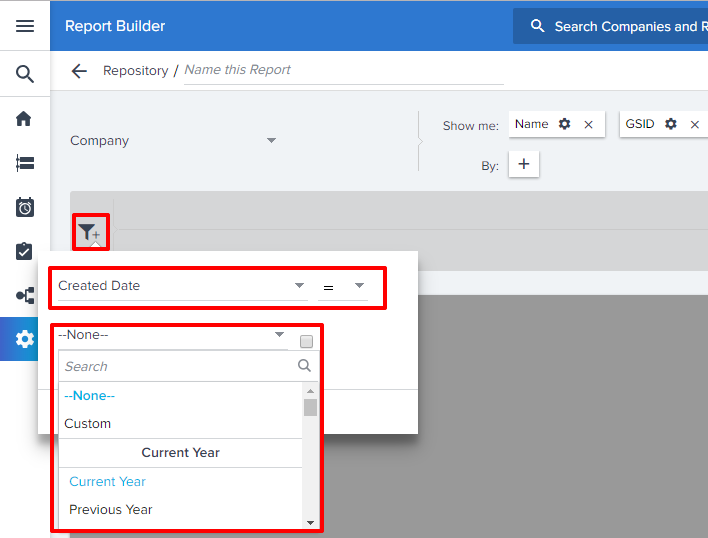
- Filter by Custom or Current Year: In the Report Builder, when you filter on date fields, you can set a custom date or you can select year, month or week from the dropdown list of your choice. You will be able to see these options in objects related to company. For example, Created Date, Modified Date, Renewal Date, etc.
In reports created using MDA Data objects, the ‘not equals (!=)’ filter used to exclude a CSM will not only exclude CSM, but will also exclude the null values, so you will need to apply an additional filter (CSM Name = null) to include null values. For example, if you want to exclude Kelli (CSM Name), apply the filters as, Filter A: Name != Kelli and Filter B: Name = null.
![14. csm null [2].png](https://support.gainsight.com/@api/deki/files/8933/14._csm_null_%255B2%255D.png?revision=1)
Notes:
- By default all filters are unlocked.
- If you are using dates in the filters, place them first to optimize the query.
- If you are using the operators 'contains' or 'equals,' place them last in the filters.
- "Includes" Operator can be applied only on the following data types: String, Email and GSID.
- If you want to apply Includes operator on a String data type, type/add the required value, and then press Tab to add next value to the filter. You can add a maximum of 10 values per filter.
- ll filters added on normal fields will be automatically added to the upper section of the filter bar in the report builder.
- All filters added on aggregated fields will be automatically added to the lower section of the filter bar in the report builder.
- By default, the operator between multiple filters is AND. You can change it to an OR statement by typing in the text field in the top right.
- Normal fields are numbered from A, B…. Z and aggregated fields are numbered from 1, 2, 3…… If you want to apply an OR between the filter conditions, or if you want to add advanced filters such as (A OR B) AND C, type in your desired expression in the text box adjacent to the settings and visualization icon.
Save options and other settings
In Report Builder, you have multiple Save options and other settings. The below image describes all of the options.
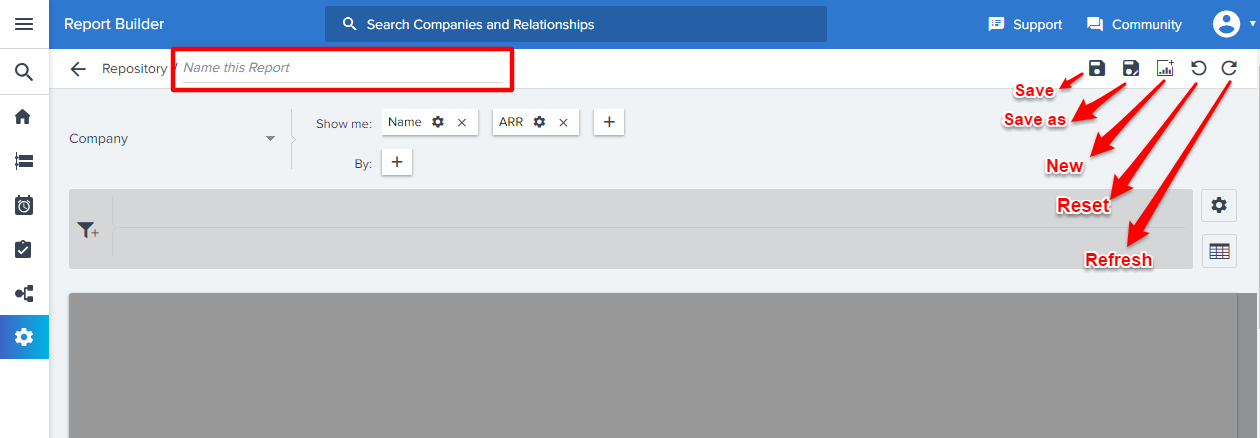
Save: You can save a newly created report. If you wish to. Clicking the Save button will save the report to the report repository.
To save a new report:
- Click Save.
- Enter the Name of the report. This will be the name that appears in the Repository, as well as in any menus or screens where the report is displayed.
Limitation: For Gainsight objects, you cannot create multiple reports with the same report name, even if you try saving the report, it will not be saved to the report repository. Alternatively, you can prefix or suffix some additional text and then save the report. - Enter the Description of the report, if required.
Save as: will create a copy of the current report. You may change the Name and Description of the report, if required.
New: Click New to create a new report.
Reset: Click Reset to restore the settings. For instance, you made some changes to the existing report, and you wish to restore the report to its original contents, click Reset and then click No in the confirm dialog.
Refresh: will refresh or reload the page.
Add Reports to Home Page Layouts and Customer 360
At this point, your report is only visible here in the report builder. However, reports can be added to Gainsight Home Dashboards and to the Customer 360 page. For information on how to create and edit Dashboards, refer Configure Gainsight Home Dashboards.
Reports from the Report Builder will have the following options at run time:
- Add a new Filter or Modify unlocked Filter
- Modify visualization
- Change chart options
- Exports
You can only change the operator and value of Unlocked filters while accessing these reports on Gainsight Home page or C360. All the above changes made in Gainsight Home are saved for individual user. For more information on User Stste Preservation, refer How User State Preservation works with Dashboards.
Reports Gainsight Data in Tableau
Gainsight NXT in Salesforce CRMContent in this section supports Gainsight NXT accessing through Salesforce Login. To learn more about Gainsight NXT in Salesforce, click here.
- Click here to expand for more information on how to Report Gainsight Data in Tableau
-
Quite a lot of the Gainsight customers use Tableau as their company-wide BI tool. With Gainsight’s Tableau integration customers can quickly connect Tableau to their Gainsight instance and build reports on their customer success data in Tableau for fast discovery and analysis. This integration not only provides the customers an opportunity to leverage Tableau’s functionalities such as Advanced Visualizations, Collaboration and Ask Data but also allows you to join Gainsight data with other data sources in Tableau.
Once the connection between Gainsight and Tableau is established, users can access all of the Gainsight objects and some important Salesforce objects like Account, User, Case, etc. in Tableau.
Important- Gainsight integration with Tableau is built based on Salesforce authentication. If you are a Salesforce user, using Gainsight NXT in Salesforce, you can leverage this integration and pull your customer success data from Gainsight to Tableau, provided you have logged-in via Salesforce. You can access all of the Gainsight objects and some important Salesforce objects like Account, User, Case, etc. in Tableau.
- You would additionally see some empty Gainsight objects such as CTA Group (Old Success Plan object).
For detailed information on how to integrate Gainsight with Tableau, refer to Gainsight Integration with Tableau article. For information on how to explore data, build basic Visualizations and Dashboards in Tableau, refer Tableau article.
- Additional Resources:
- For information on Advanced options in reporting, refer to Report Settings & Advanced Options article.
- For information on Report and Dashboards Exports, refer to Report and Dashboards Exports article.
- For information on Reports and Dashboards Limits, refer to Reports and Dashboards Limitations article.
- For information on Color Settings in reports, refer to Color Settings in Reports article.
| NPS, Net Promoter, and Net Promoter Score are registered trademarks of Satmetrix Systems, Inc., Bain & Company and Fred Reichheld. |