Impact Analyzer for End Users
Gainsight NXT
This article provides Text Analytics users an overview of the Impact Analyzer feature in the Text Analytics and explains all the available options and settings of this feature.
Overview
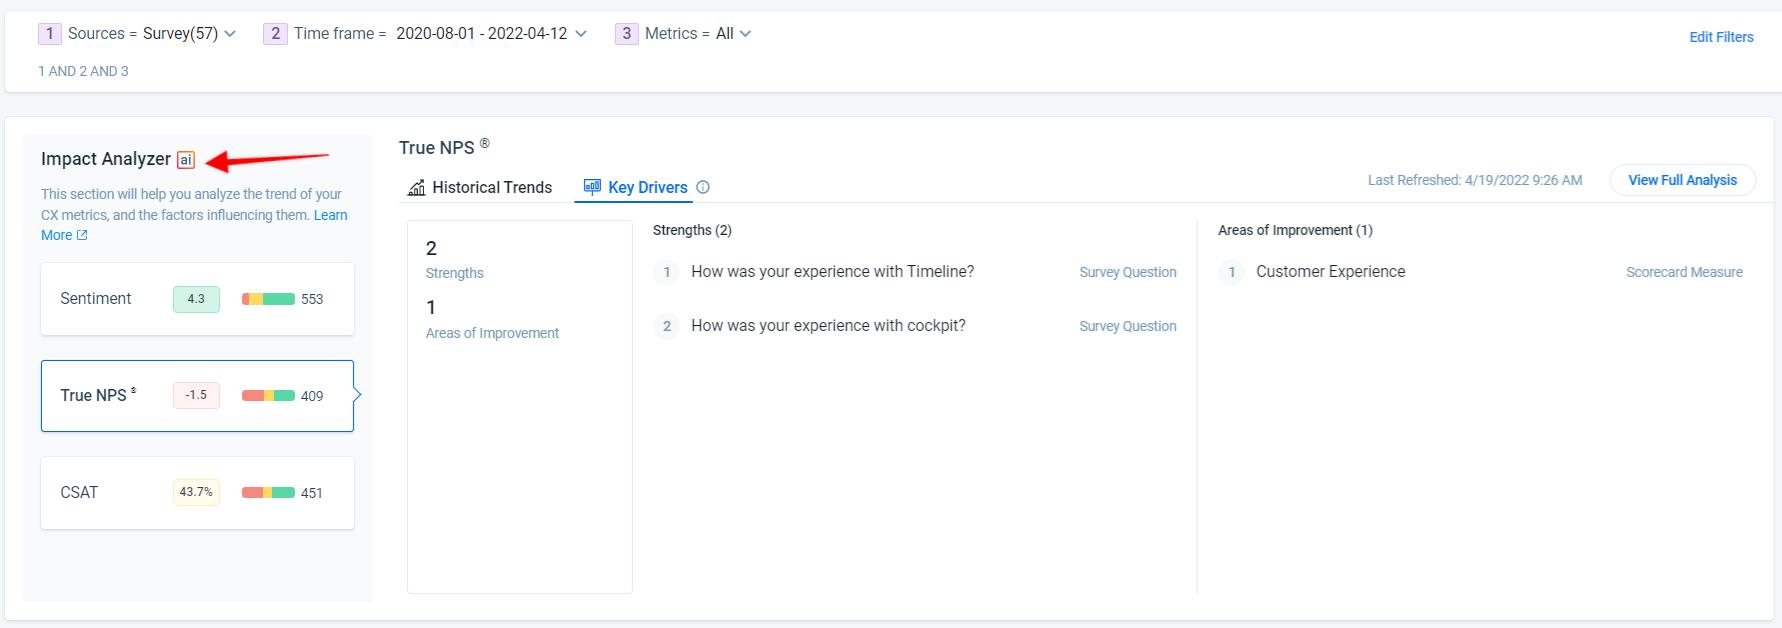
In the Text Analytics Home page, Impact Analyzer provides advanced analytics to users. Key Drivers in Impact Analyzer help identify the underlying factors that affect the key customer experience metrics (called outcomes) such as NPS® and CSAT, by classifying them as Strengths and Areas of Improvement.
- Outcomes: Output of Impact Analyzer’s Key Drivers (NPS® and CSAT) are called outcomes
- Drivers: Input to Impact Analyzer are called drivers
Example Business Use Case: As a CX User, you want to identify the areas that are impacting your NPS® and/or CSAT scores to take necessary actions for improvement.
Key Terminologies
Following are the commonly used terminology in Impact Analyzer:
|
Attribute |
Description |
|---|---|
| Strengths | These are important and high rated drivers that are performing well in deriving the NPS® and CSAT scores. |
| Areas of Improvement | These are important and low rated drivers. These drivers need user’s attention and can be considered for improvement. |
| Unimportant Drivers | These are system identified drivers that are not important for analysis. |
| Predictive Power | This evaluates how effectively the drivers explain your NPS® and CSAT scores. A high score indicates reliable and good quality data for overall analysis. A low score indicates insufficient data to explain the NPS® and CSAT scores. |
| System Excluded Drivers | These drivers are system excluded due to insufficient data and cannot be included in the analysis. |
| User Excluded Drivers | These drivers are user excluded. You can manage this selection from the Driver table |
| Correlated Drivers | This is a group of drivers that explain the same patterns in your NPS® and CSAT scores. |
| Importance Score | This score shows the effectiveness of a driver in explaining your NPS® and CSAT scores. A high score indicates that the driver has a strong association with your NPS® and CSAT scores. |
| Performance Score | Each important driver has areas where the average outcome value is higher than other areas. This score indicates how common it is for your driver values to fall within a high range. A high score indicates that the majority of your driver values fall within that range. |
Key Drivers
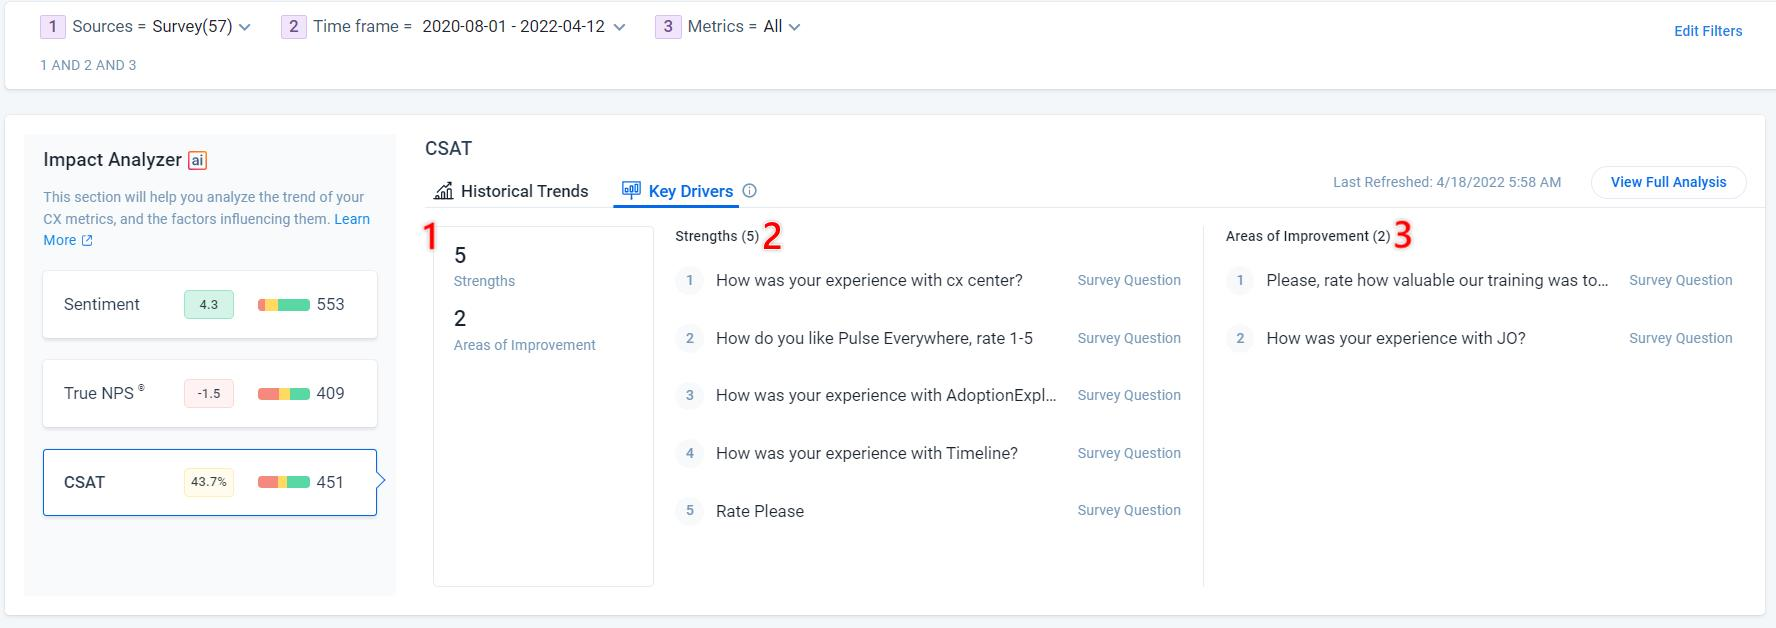
From the left pane of the Trend widget, select the required Outcome to see the analysis on the right pane. In the Key Drivers tab, you can see the following subsections:
-
Attributes Summary: Displays number of Strengths, opportunities, and Predictive Power on the considered data for the selected Outcome. For more information, refer to the Terminologies section in this article.
-
Strengths: Displays the list of drivers (survey questions, scorecard measure, and company attribute) that are performing well in deriving your customer satisfaction. You can click the Graph icon to view the derived relationship between the Driver and the Outcome.
-
Areas of Improvement: Displays the list of drivers (survey questions, scorecard measure, and company attribute) that need attention to improve the selected outcome.
Analysis in Detail
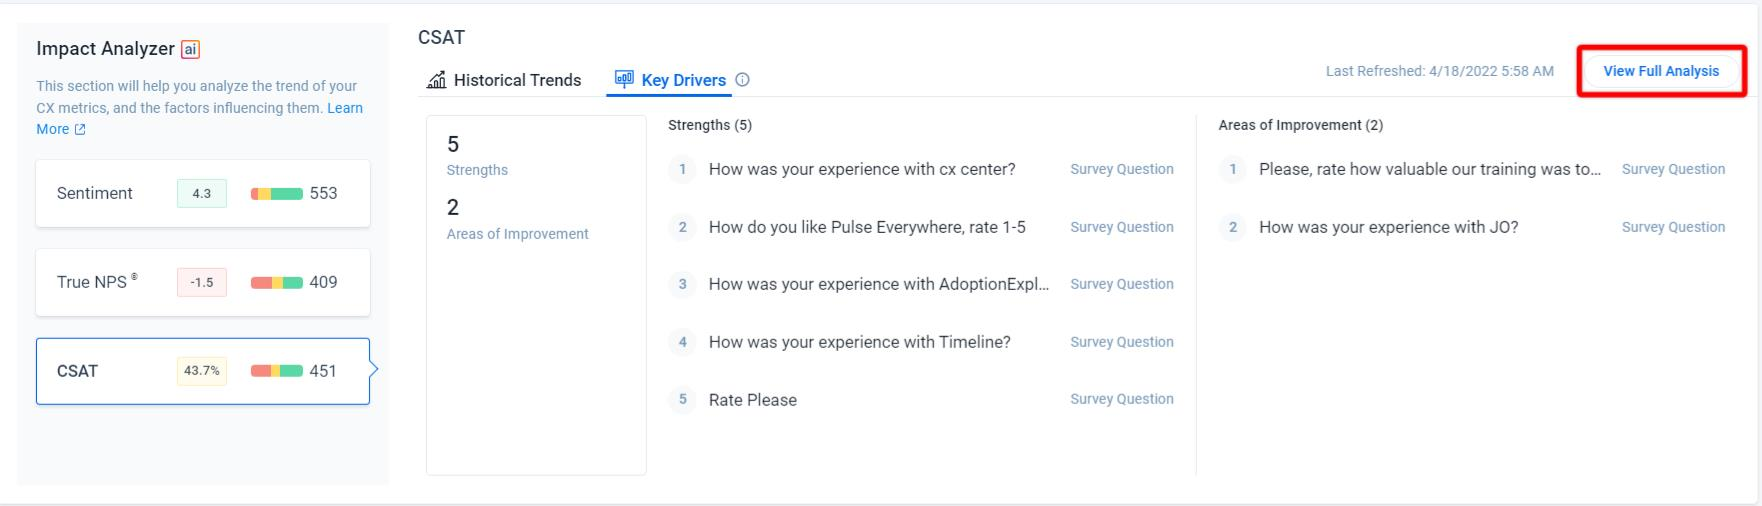
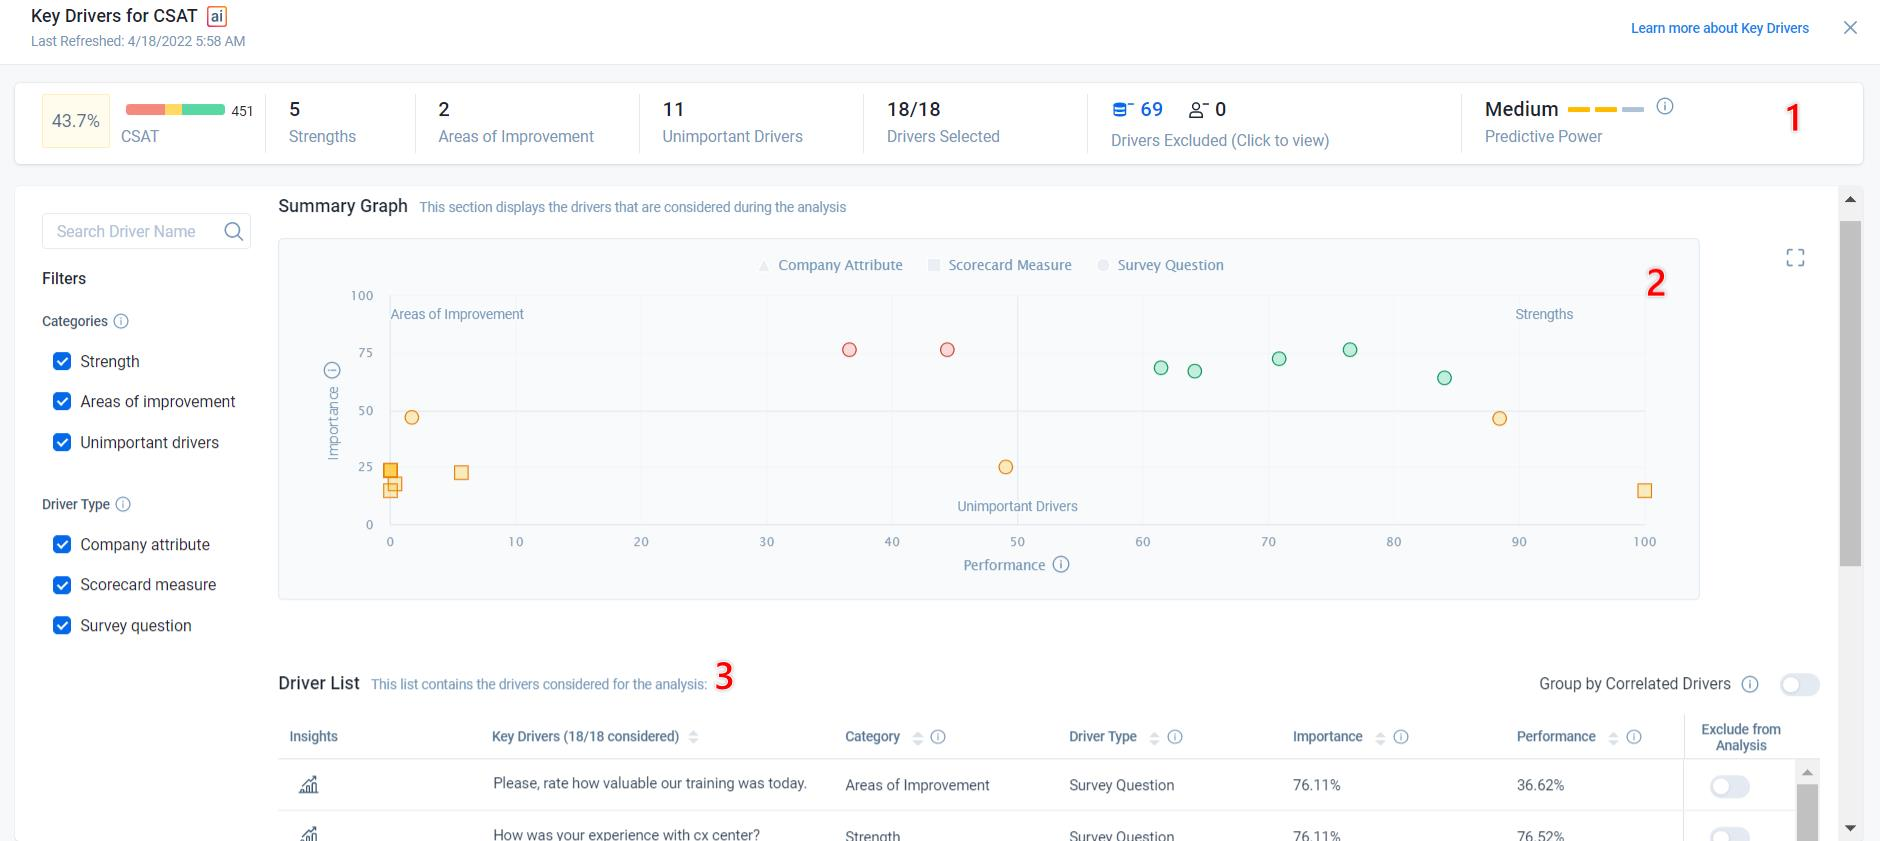
Click View Full Analysis to view the considered attributes for the analysis, the Importance vs Performance graph of the drivers.
The list of drivers considered for analysis. Refer the following sections:
-
Attributes: Displays all the attributes with details that are considered for the Analysis.
-
Summary Graph: Displays the Importance vs Performance of the drivers. It segregates the drivers into three quadrants based on the performance. The three quadrants are:
- Strengths: Important and High rated
- Areas of Improvement: Important and Low rated
- Unimportant: Unimportant and Low rated
Notes:
- You can hover on any point of the graph to view the Category, Importance, Relative Performance, and Type of a specific driver.
- You can also enlarge the graph view and can select the required area to zoom in.
-
Driver List: Displays a list of drivers that are considered for the analysis. You can view all the Drivers in rows and the Category, Type, Importance, Relative Performance, and Records Applicable in columns.
You can Toggle ON Group by Correlated Drivers to group together the drivers that explain the same patterns in your NPS® and CSAT scores and see the Correlation between drivers by clicking the Show Correlation Matrix option.
Notes:
- Search by Driver name to view a specific driver.
- View the relationship between the Driver and the Outcome by clicking on the Graph icon.
IMPORTANT: If you have modified any Global Filter, you need to save the View to reflect the new changes in the Impact Analyzer > Key Drivers. For more information on how to configure global filters, refer to the Text Analytics Home article listed in the Additional Resources section in this article.
Additional Resources
| Net Promoter®, NPS®, NPS Prism®, and the NPS-related emoticons are registered trademarks of Bain & Company, Inc., NICE Systems, Inc., and Fred Reichheld. Net Promoter ScoreSM and Net Promoter SystemSM are service marks of Bain & Company, Inc., NICE Systems, Inc., and Fred Reichheld. |