Using Calculated Fields in Rules
This article explains how you can create Calculated fields in a Bionic Rule Transformation task. Calculated fields allow you to perform two types of calculations, Aggregation and Comparison over a period of time. After adding a Calculated field in Rules Engine, you can perform the following:
- Add a new field that is a rolling average of last 7 days of a usage measure.
- If the rolling average crosses a high or low threshold, create a CTA or set a score.
- Load the rolling average to usage data or to a field.
Add a field that is a comparison of aggregated usage measure over last 7 days versus prior 30 days or last 2 weeks vs avg of last 3 months.
- Use this to identify the trend and create a CTA when it is trending low or set a score based on whether it is trending up or down.
- Load to usage data or to a field.
This topic explains the following:
- How to Add a Calculated Field
- Calculation Type: Comparison
- Calculation Type: Aggregation
How to Add a Calculated Field
To add a custom field:
- Create a Bionic Rule on Account in the Create Rule page.
- Click +DATASET TASK and navigate to Setup Rule page, select a source object to create a dataset.
- Add all required fields to the Show section.
- Assign Task Name and Output Dataset Name and click SAVE.
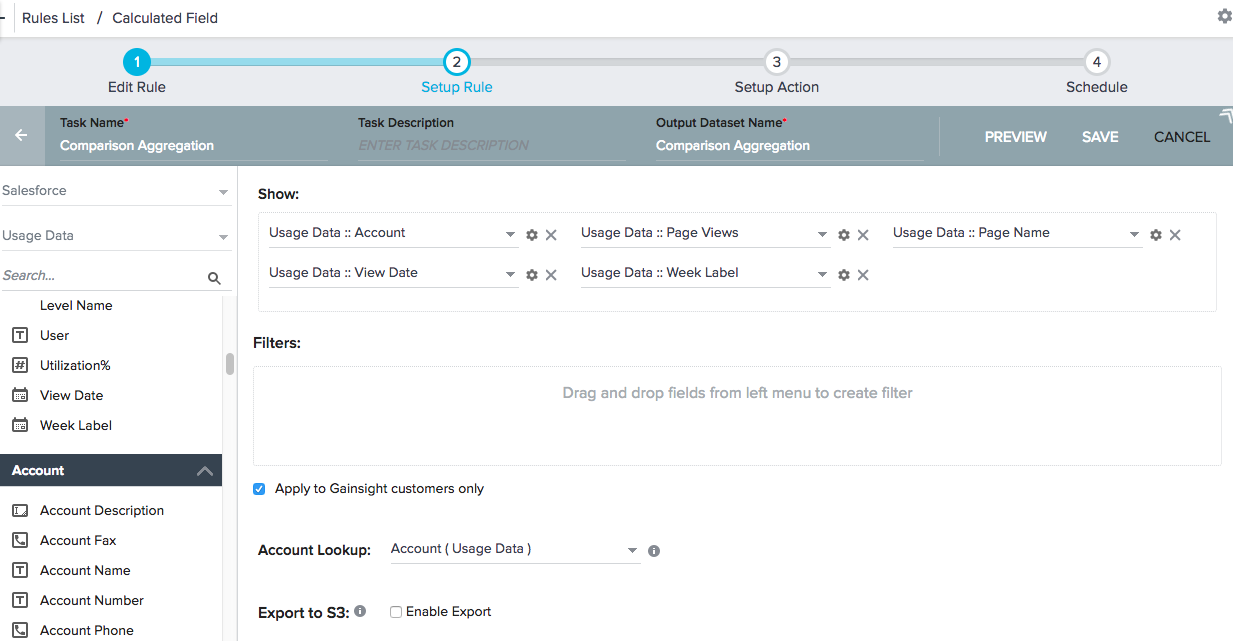
- Click +TASK and select Transformation. Select just created dataset as source object.
- You can now see Calculated Field on the left pane. Hold the Calculated field and add to the show section to apply calculations. Calculated Field dialog appears where you can apply calculations on the data.
Note: The option to add a calculated field will not be visible unless the source object has at least two number fields within the table. These fields do not necessarily need to be used within the calculated field that you are adding.
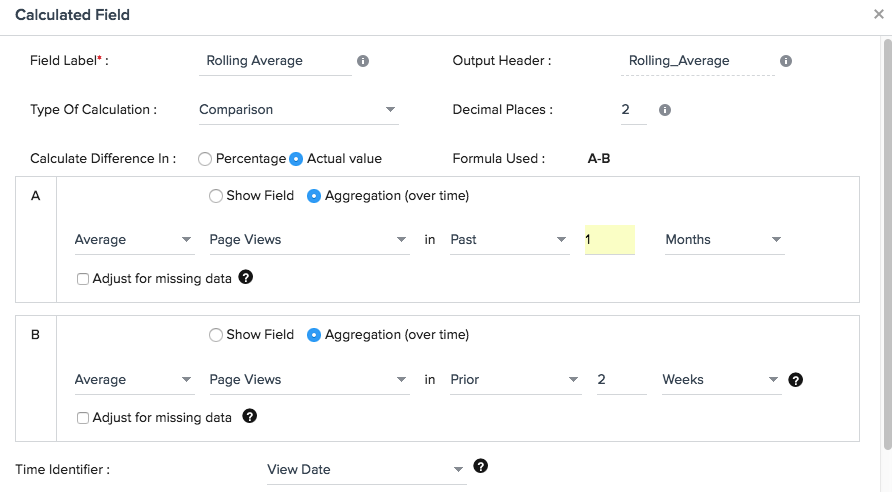
In the Calculated field dialog, enter the following:
- Enter the name of the new field in Field Name and Output Header (Added automatically and can change if required).
- In the Type of Calculation list, select any of the following options:
- Comparison: Used to calculate a comparison between two measures or numeric fields.
- Aggregated measure value over time (Example: Sum of Page views in last 2 weeks)
- Measure or Numeric field that has already been added to show area
- Aggregation: Used to aggregate a measure over a period of time. (Example: Count of cases in the last month).
- Comparison: Used to calculate a comparison between two measures or numeric fields.
Calculation Type: Comparison
When the calculation type of Comparison is chosen, choose to Calculate difference in:
- Percentage: ((A-B) / B) * 100
- Actual Value: A-B
Define measures A and B in the Calculated fields as shown below:
Define A

In Measure A configuration:
- Select an aggregation type, Sum, Average, Count, Count distinct, Min or Max and the measure on which the aggregation should be applied.
- Select the date range in which this calculation should be executed. Example: past 2 days or past 4 weeks or past 3 months.
- Select Adjust for missing data for the aggregation type Average to skip counting the time period if the data is missing for day/week/month. Example: If you choose to do an average of past 4 weeks and there is no data for one week.
Define B
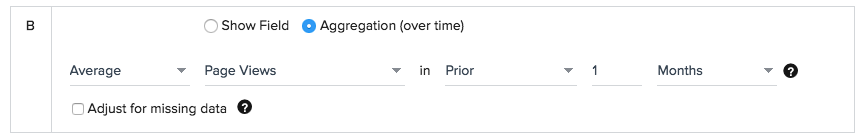
In Measure B configuration:
- Select the aggregation from type, Sum, Average, Count, Count distinct, Min or Max and the measure on which the aggregation should be applied.
- Select one of the following options:
- Past - Completed period in the past.
- Prior - Period that immediately precedes the past days/weeks/months selected in A.
- Same Period - Same period as in N days/weeks/months as selected in A.
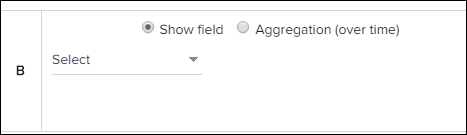
Alternatively, select one of the Show fields in condition A, B or Both.
Note: If another calculated field was identified in this rule, it is available as an option here.
Time Identifier
By default, Time Identifier is selected Created Date. If you use Usage Data in the calculated field, you will most likely want to change the Time Identifier:
- If Usage Configuration is Weekly, use Week Label as time identifier. There is a chance that the same week has Usage Data records with different dates, but week label will be the same for all of the records in a week, so you will not see any problems in calculations.
- If Usage Configuration is Monthly then Date field is the best option for the time identifier.
Calculation Type: Aggregation (over time)
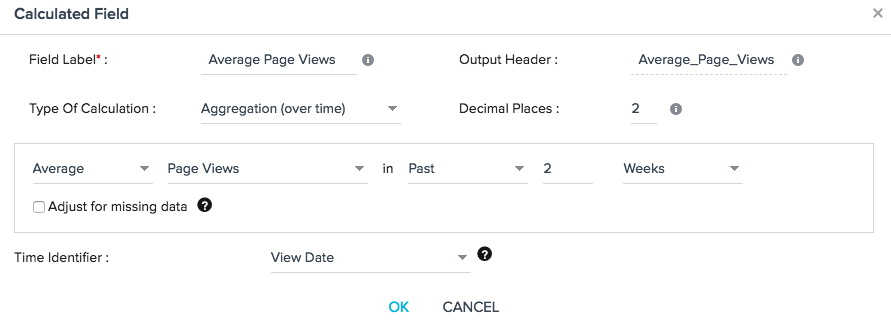
In the Aggregation configuration:
- Select an aggregation type, Sum, Average, Count, Count distinct, Min or Max.
- Select the measure on which you want to apply the aggregation.
- Select the date range in which this calculation should be executed. Example: past 2 days or past 4 weeks or past 3 months.
- Select Adjust for missing data for the aggregation type Average to skip counting the time period if the data is missing for that day/week/month. Example: If you choose to do an average of past 4 weeks and there is no data for one week then the sum is divided by 3 instead of 4.
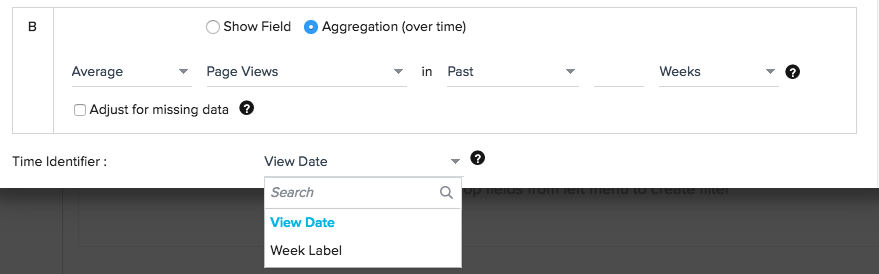
Time Identifier
When you define an aggregation over time, you need to pick the date field on which the aggregation should based on. Every object has created date and modified date, by default one of the date fields is picked. You can see that at the bottom of the calculated metric form.
Only one date field can be picked for all the calculated metrics in the rule. There is no option to select a different date field for separate calculated metrics.
Change the time identifier (Date field) at the bottom of the Calculated field dialog for each calculated field.
Notes:
- Since by default, one date field is selected, ensure you review this and select the appropriate one.
- Any aggregation over time can be done only when we have snapshot data, as in one record for each time period. For the objects where you do not store time based snapshots, you will not be able to calculate the trend. For example, it is not correct to calculate AVG of Account.Employees in Past 1 Month because Account does not store time snapshots.
Min/Max Function
Selecting a MIN/MAX aggregation is not selecting a record, it is performing a function on that field (which is find the MIN/MAX in summary for all records). When using MIN/MAX operations on a date field in a SOQL query, it changes other fields to the opposite operation. For example, let's say you want to view the last record of the month. You use MAX of Date and you get the following:
Show: Max of Date, (MIN of) field 1, (MIN of) field 2, (MIN of) field 3.
When building a rule on Salesforce data, keep in mind the rules engine is using a SOQL query, and not a SQL query:
- SOQL supports the ability to MIN/MAX on Date/Time Fields.
- When MAX is applied to a date field in a SOQL query, all other fields will be added to Group By. If there are un-groupable fields, then Min is applied.
Limitations
- You can add only 4 aggregations (over time) in a single rule.
- You can select a max of 31 days or 52 weeks or 12 months or 2 years.
- You can add only 4 periods (days/weeks/months/years) when adjusting for missing data.
- Calculated fields only work with Account level data in Gainsight's usage data object. It will not calculate correctly if the data has any other level of granularity.
- Date fields don't support max/min aggregation. If you use max on the date field, it will try to find the min on all of the other fields. The same is true for using min (it will max out the other fields).
All of the above restrictions are due to intensive calculation that happens in the memory of the Rules Engine system. If you need more aggregations over time, it is recommended creating a new rule to accommodate the new aggregations.