Pivot Tasks in Rules Engine
This article explains how you can transform data into a polished, actionable dataset in Rules Engine using the Pivot tasks with a scenario. In this scenario, the following have been used:
- Customer: Abbett Ltd.
- Customer’s customer: Johnson Ltd.
- Web pages of the customer’s website (used in this scenario):
- Home Page
- Admin Page
- Sales Page
- Customer Support Page
This scenario will help you to perform the Pivot task that allows you to create a column for every data value. This enhances the data summarization process thus giving you a better insight into your data.
Note: Only one pivot can be configured in a Pivot task. However, a maximum of 50 columns can be added in one pivot.
Application of Pivot Task
Consider a scenario in which Abbett Ltd. wishes to calculate Pageviews for its different web pages as mentioned above by a high-value customer ‘Johnson Ltd’. The following table shows the number of times each web page has been viewed by various users at Johnson Ltd.
| User Name | Page Name | Views |
|---|---|---|
| Matt Rick | Home Page | 6 |
| Scott Coyte | Admin page | 2 |
| Belinda Clark | Sales Page | 4 |
| Scott Coyte | Customer Support Page | 2 |
| Serene Andrews | Admin Page | 5 |
| Mike Smith | Sales Page | 7 |
| John Paul | Customer Support Page | 3 |
| Scott Coyte | Home Page | 2 |
| Belinda Clark | Admin Page | 8 |
| Matt Rick | Sales Page | 4 |
| Mike Smith | Customer Support Page | 6 |
| Serene Andrews | Home Page | 3 |
| John Paul | Admin Page | 7 |
The above table is just a small chunk of imaginary data. However, in the real world, the number of web pages and a number of users can be much more than this table. In such scenarios, it is really challenging to manually calculate as to which page got the highest number of views, which user is more interested in which page, and so on.
You can also see page view data at the user level; you can see which user at Johnson Ltd. viewed which Page for how many times. To accomplish this, you must apply Pivot on a feature to the Page Name field and apply Group By clause on the User Name field. When you run the rule, the following screen is displayed.
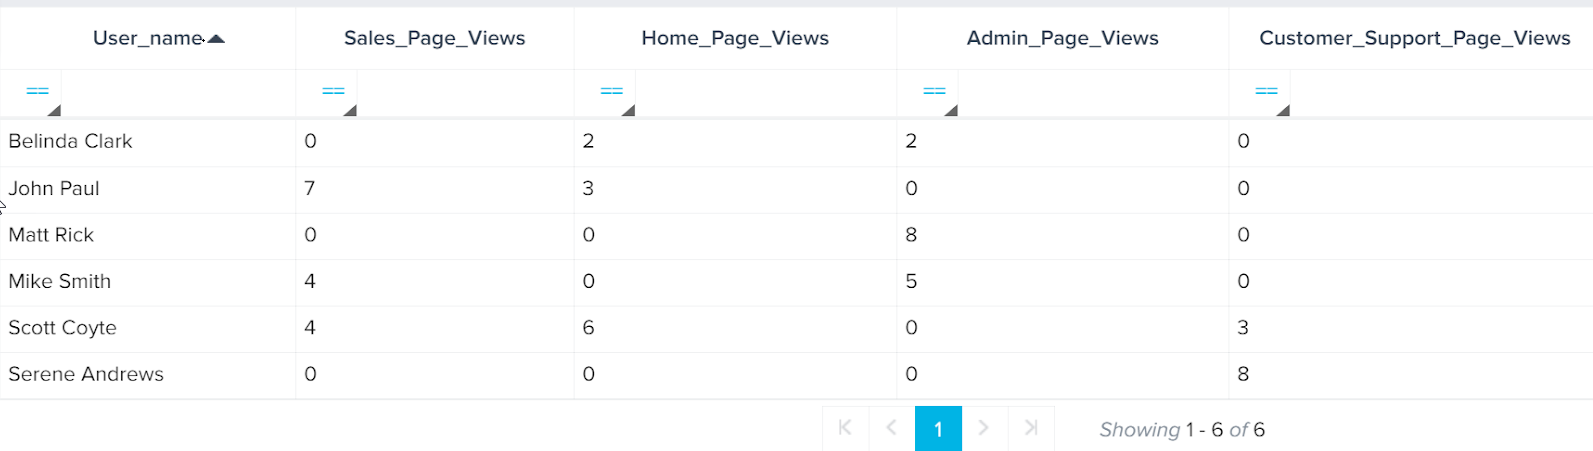
From the above output table, you can easily view as to which user has viewed which page, and how many times.
So, the main benefit which you can leverage from Pivot tables is the summarization of terabytes of raw data into useful information as required by your organization, which helps in decision making.
For additional help, see this short video demo on the Pivot task configuration.
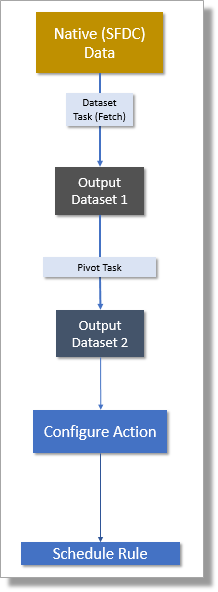
A general flowchart of preparing Pivot Tasks in Rules Engine is shown below.
Usage of Pivot Tasks in Gainsight
CTA Priority:- CTAs have three levels of Priority: High, Medium, and Low. It is highly essential to keep track of each priority level and resolve CTAs based on their priorities. In this article, a Pivot table is used to create a summary chart that enlists all the CTAs in accordance with their priorities and gives you a count of the same. This table also displays the Company Name to which a CTA belongs to. The step by step procedure to create a Pivot table is as follows:
Create a Rule
- Navigate to Administration > Rules Engine.
- Click Create Rule.
- In the Create Rule screen, enter:
- Rule For: Company
- Rule Name: Pivot task (example)
- Folder: Select a folder for the rule.
- (Optional) Description: Enter a description.
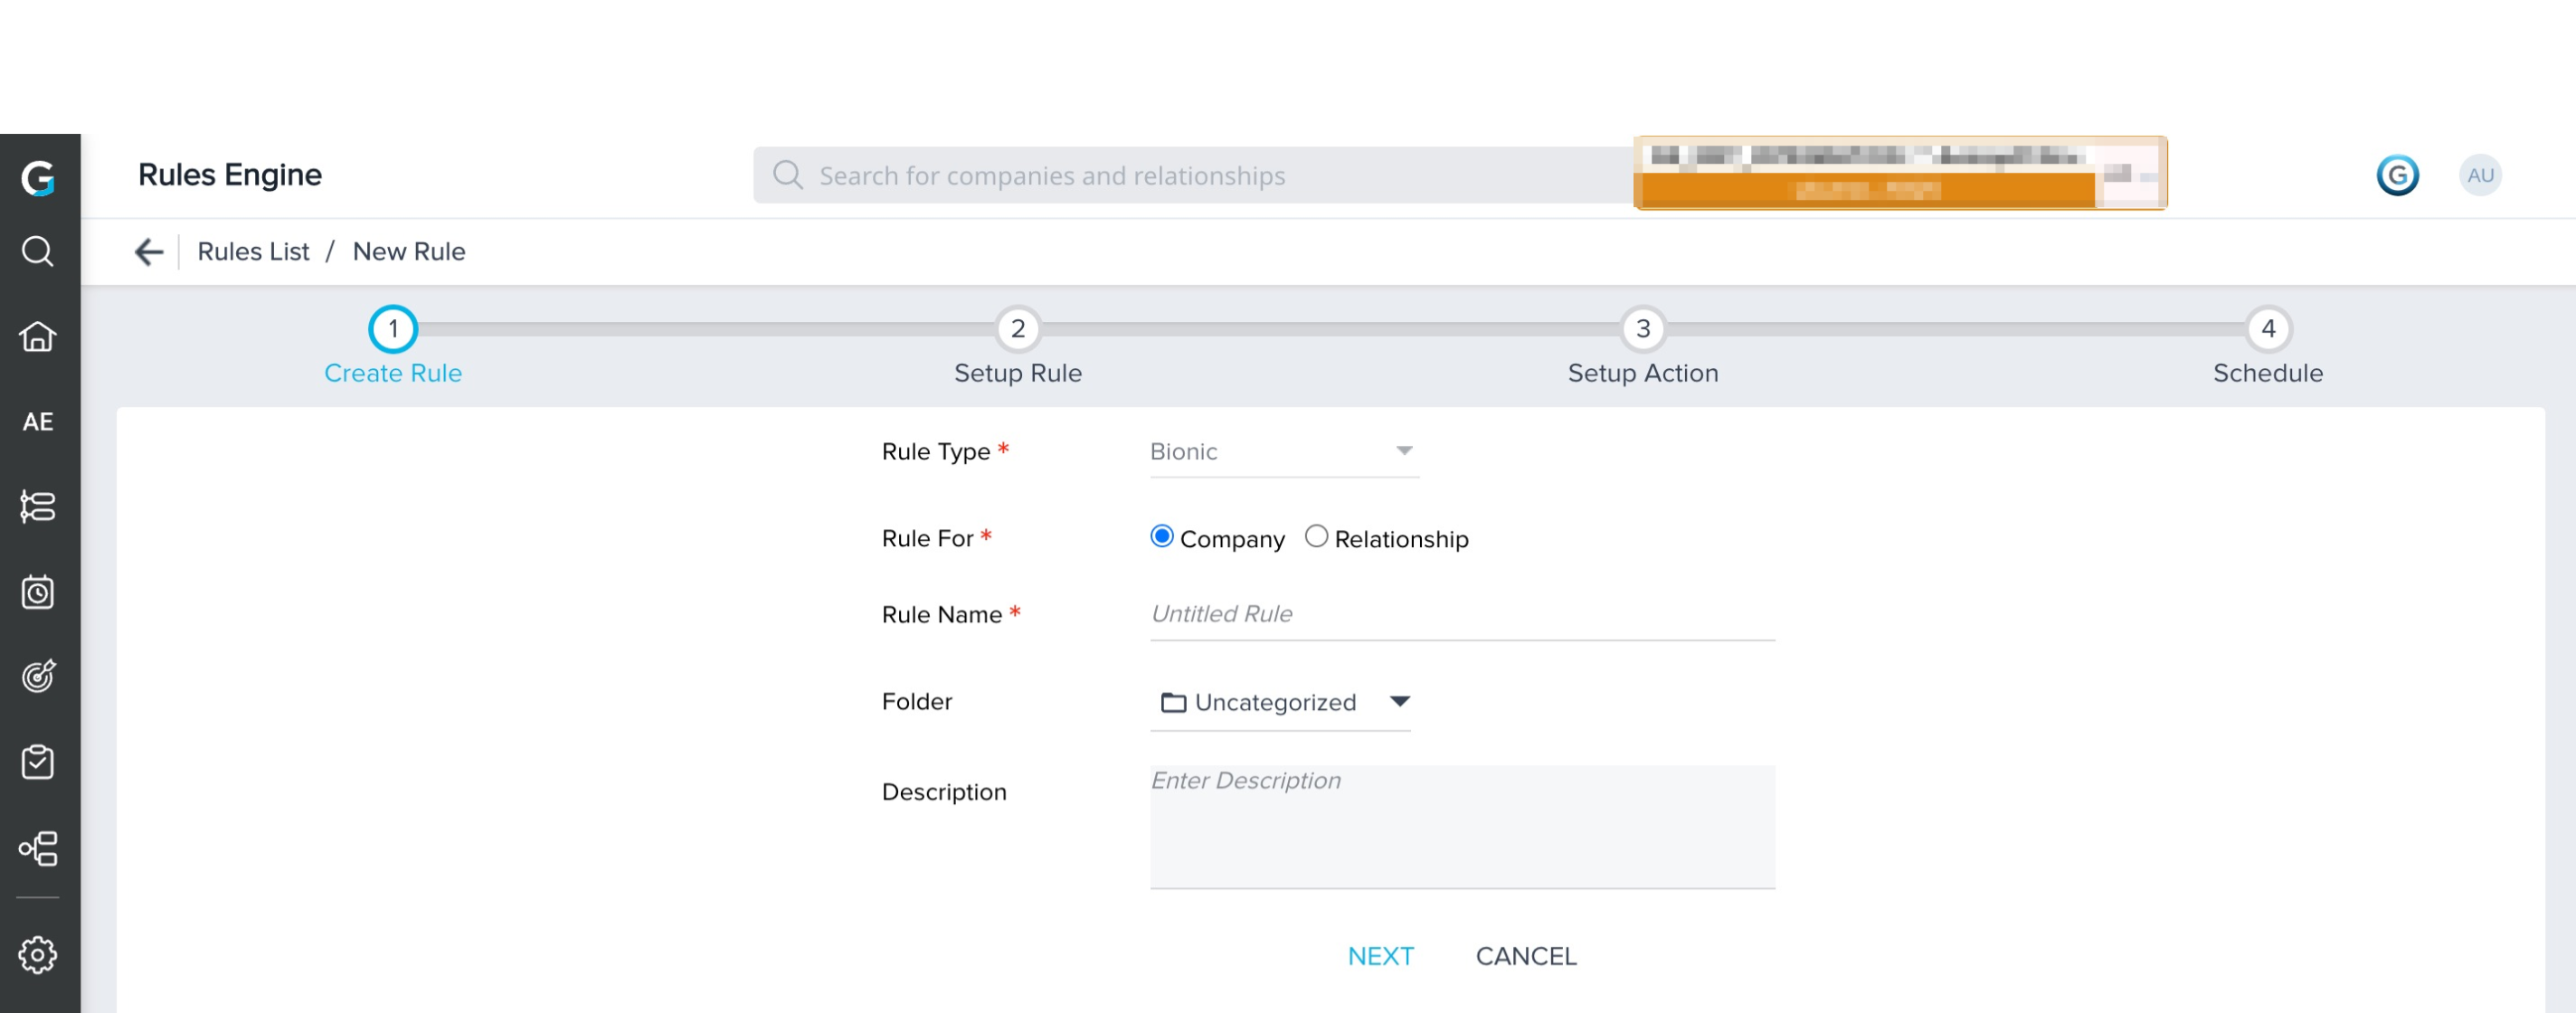
- Click NEXT. The Setup Rule screen is displayed.
Create Data Set (Fetch Task)
- Click DATASET TASK to create a data set.
- Enter:
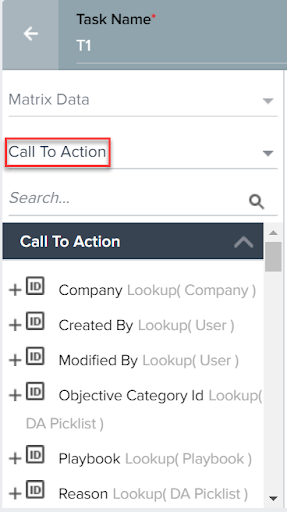
- Task Name
- (Optional) Task Description
- Select Call To Action as the source object.
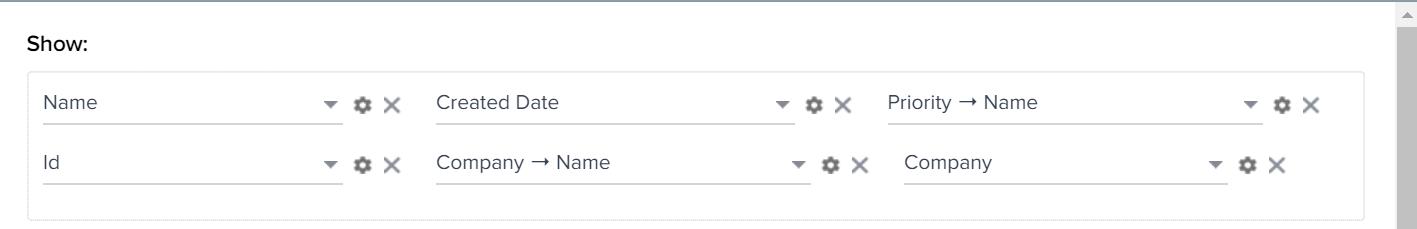
- Add the fields to the Show section as shown in the following image (after 6th step).
- Click SAVE.
- Click <-, to go back.
Create Pivot Task
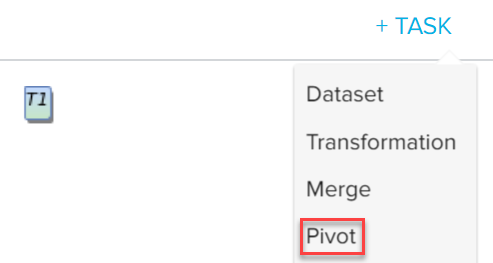
- In the Setup Rule screen, navigate to + TASK > Pivot.
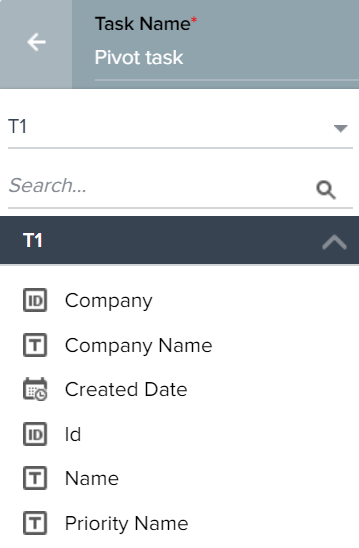
- Enter a name in the Task Name field.
- Select T1 (the name you have given to the previous dataset) as the source object.
- Drag and drop the Priority Name field under the Pivot On section. The Pivot conditions to evaluate the window are displayed.
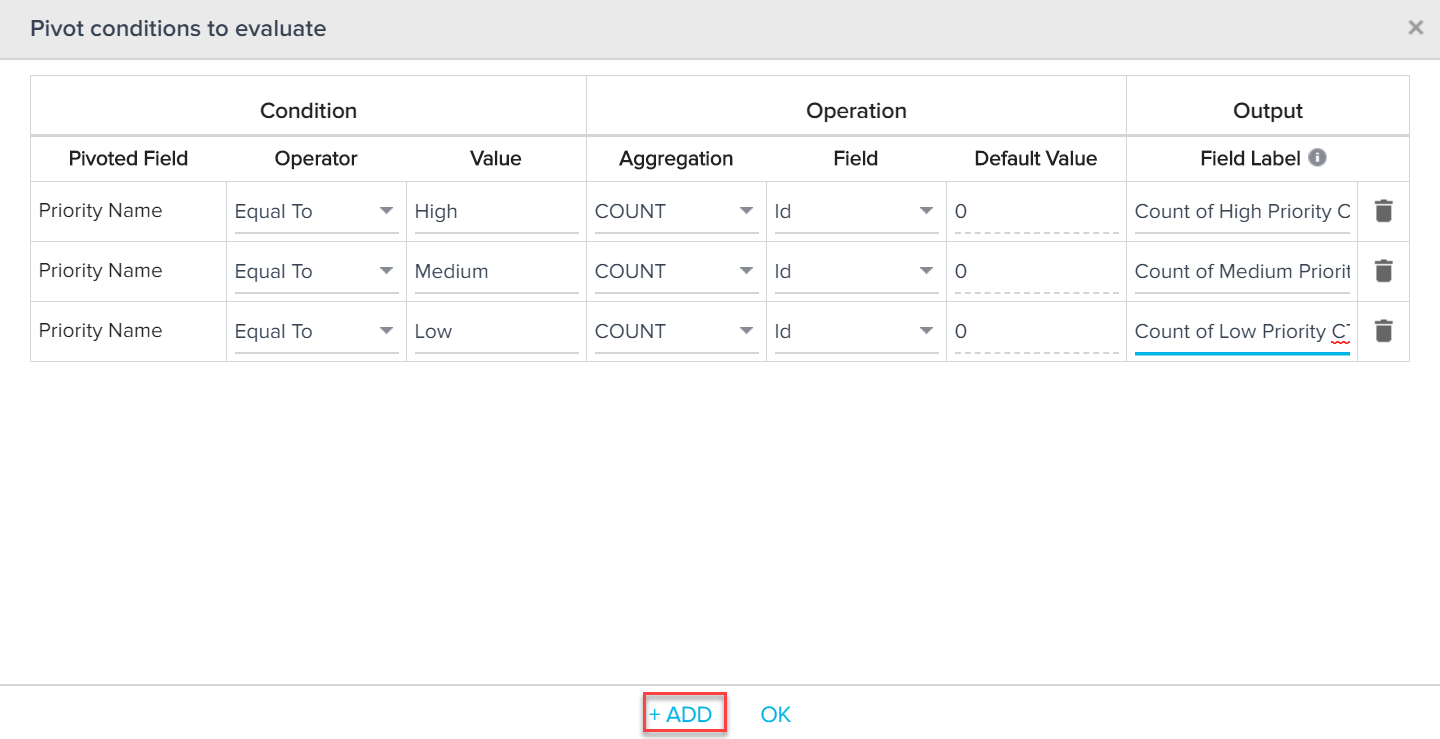
- Create Pivot condition as shown in the following image.
In the above image, a column named High Priority CTAs in the Output table has been created, this keeps a count of all High Priority CTAs. In the Condition section, the Pivot table evaluates all CTAs whose Priority is equal to High. In the Operation section, the Pivot table counts the number of Ids for the high Priority section. The id field is unique for every CTA. Hence, the Id field is used to get accurate values. In the Output section, you must provide a name. This name is displayed in the final Pivot Output table.
- You can similarly create another two columns for Medium and Low priorities. You must click + ADD, to add more rows.
- Drag and drop Company Name and Name (this is Call to Action name) fields to the GroupBy section.
Now all the CTAs (High, Medium, and Low) are grouped in line with Company Name and Name fields. The final output table will have five columns. Company Name and Call to Action Name (because they are used in group by clause), and three columns for Priorities, used in Pivot table.
- Click SAVE.
- (Optional) You can set up the action as required in the Setup Action page. For more information about different Rule action types, refer to the Setup Rule Action Type Overview article.
So, in this example, a Pivot table is created which summarizes all the CTAs based on their priorities. This table also displays the respective CTA Name and Company Name, since they have been used in the Group By section.
Schedule
You can use this option to schedule the execution of this rule in the same way as you schedule in Rules Engine for other rule types before. For more information about how to schedule an individual rule, refer to the Schedule and Execute Rules article.
See Also