Impact Analyzer FAQs
Gainsight NXT
What are the advantages of Impact Analyzer?
Optimize your Customer Success strategy by uncovering the impact on top business goals and identifying where your team should focus their efforts with Impact Analyzer.
Is this available in both Salesforce and NXT?
Yes, it will be available in both editions.
How do I enable Impact Analyzer on my existing Gainsight subscription?
Impact Analyzer is available in the Text Analytics and will be auto-enabled. Admins are not required to perform any prerequisite actions to enable the feature.
What are Key Drivers?
Key Drivers help identify the underlying factors that affect the key customer experience metrics (called outcomes) such as NPS® and CSAT, by classifying them as strengths and opportunities (weaknesses).
What data are considered as potential drivers?
Underlying factors, called drivers, are derived from:
- Company attributes (like size, ARR, number of employees etc)
- Scorecard measures
- Survey responses
Note: Historical data from Scorecards and Survey responses (from the last six months) are considered for the analysis, making it thorough and comprehensive.
Additional drivers such as person attributes and CSM activities will be added in the future.
What sources of information are being pulled to create the Impact Analysis?
Data sources for Impact Analyzer are Survey responses, Scorecards, and company attributes stored in Gainsight's Company object - both standard fields and custom fields.
What are called strengths and areas of improvement in Key Drivers?
All potential drivers are categorized as strengths and opportunities.
This distinction is made based on the importance and performance scores. Both Strengths and Areas of improvement are important, and help you to identify potential areas you can focus on. Areas of improvement have more scope for refinement compared to the strengths and might be the first place to look at, if you are looking to improve the outcome.
What do Importance and Performance mean?
-
Importance: To figure out the importance, we try to identify whether or not a relationship that exists between a potential driver and an outcome is strong. If a strong relationship is found, it becomes important.
-
Performance: Performance refers to the score based on the relationships between the outcome and the driver. This also refers to what percentage of the driver falls under areas that have high outcome values; the Performance score increases with the higher percentage. For example, if a green health score means a high NPS, performance looks at what percentage of responses are from companies with green health score.
How are the Importance and Performance axes computed?
Importance: A second degree curve has been fit between the outcome and driver. This ensures that the data is strongly adhered to the curve, subject to the following constraints:
-
Scorecard variables: A monotonically increasing curve is fit. As the scorecard measure value increases, the outcome value should also increase
-
Survey Questions: Increasing and decreasing curves are only fit. U-shaped curves and inverted-U shaped curves are not used
-
Company Attributes: No restrictions
Performance: The performance score is the correlation between the outcome-driver relationship curve and the distribution of the driver. The higher the value, the more likely it is that the driver is distributed in areas where the outcome’s value is high.
What is Predictive Power?
Predictive Power indicates what portion of your data is capable of explaining certain patterns. It’s important to note that a low predictive power does not mean that the analysis is unreliable as such. Gainsight is always working to strengthen our logic making predictive power’s buckets (low/high) more meaningful. Predictive power refers to the overall quality of the data underlying the analysis.
-
A high-predictive power means that the drivers considered explain a large portion of the variance in the outcome, and makes the overall analysis highly reliable.
-
A low-predictive power indicates that the drivers considered explain only a small portion of the outcome, and deems the overall analysis less reliable
Predictive Power is the R-squared value which is received after fitting a model on the outcome using all drivers.
What can be done to improve Predictive Power of the data?
The following two options can be done to improve the predictive power:
-
More data points: bring in more survey responses if possible
-
More attributes in the Company object: if other attributes are deemed important, the attributes can be added as company attributes, and then included in Key Drivers.
Which company attributes are supported in Key Drivers today?
Fields of numeric and date data type attributes are supported in Key Drivers today. The analysis by default covers ARR, Number of Employees and Customer Lifetime in Months. You can change this configuration through the Administration page.
Do Key Drivers cover the external survey responses?
Yes, all survey data loaded into Gainsight’s survey data model.
What are the commonly used terminologies in Impact Analyzer?
Key terminologies used in Impact Analyzer > Key Drivers:
-
Outcomes: Output of Impact Analyzer’s Key Drivers (NPS and CSAT) are called outcomes
-
Drivers: Input to Impact Analyzer are called drivers
Can I exclude any driver from the analysis? What would be the impact if so?
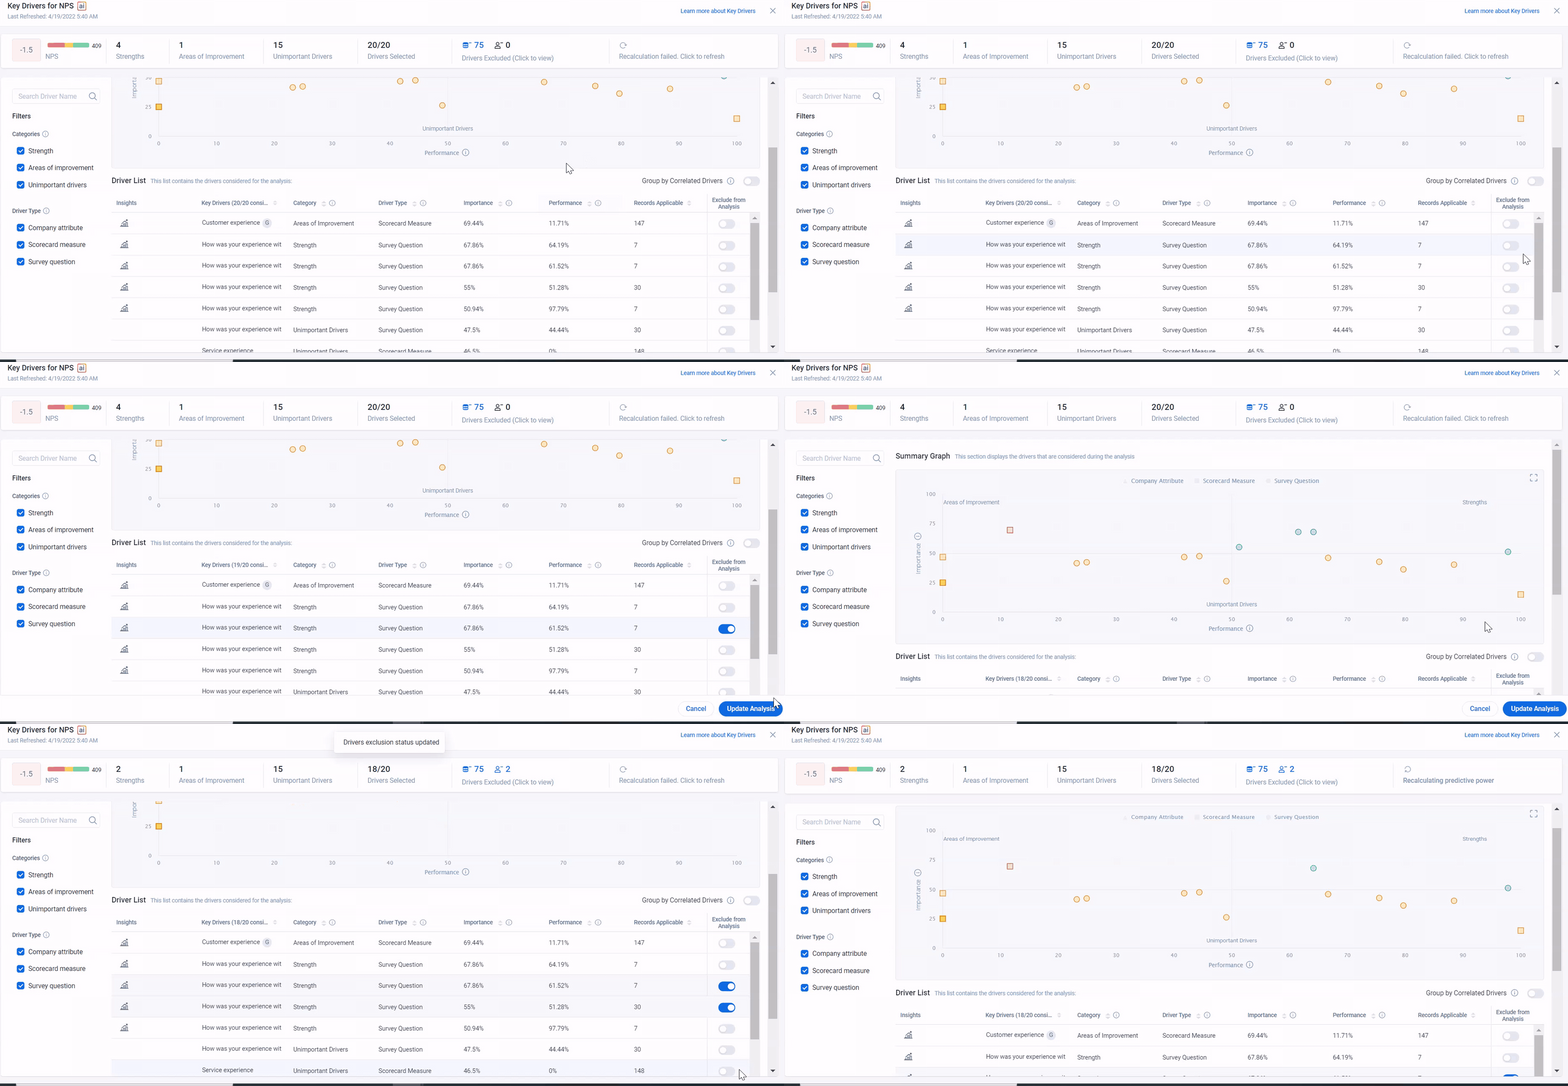
Yes, the driver can be excluded from the analysis by leveraging the toggle next to the driver on the View Full Analysis page. This action is not supported on the default view.

Where can I find the list of drivers that are excluded by the system?
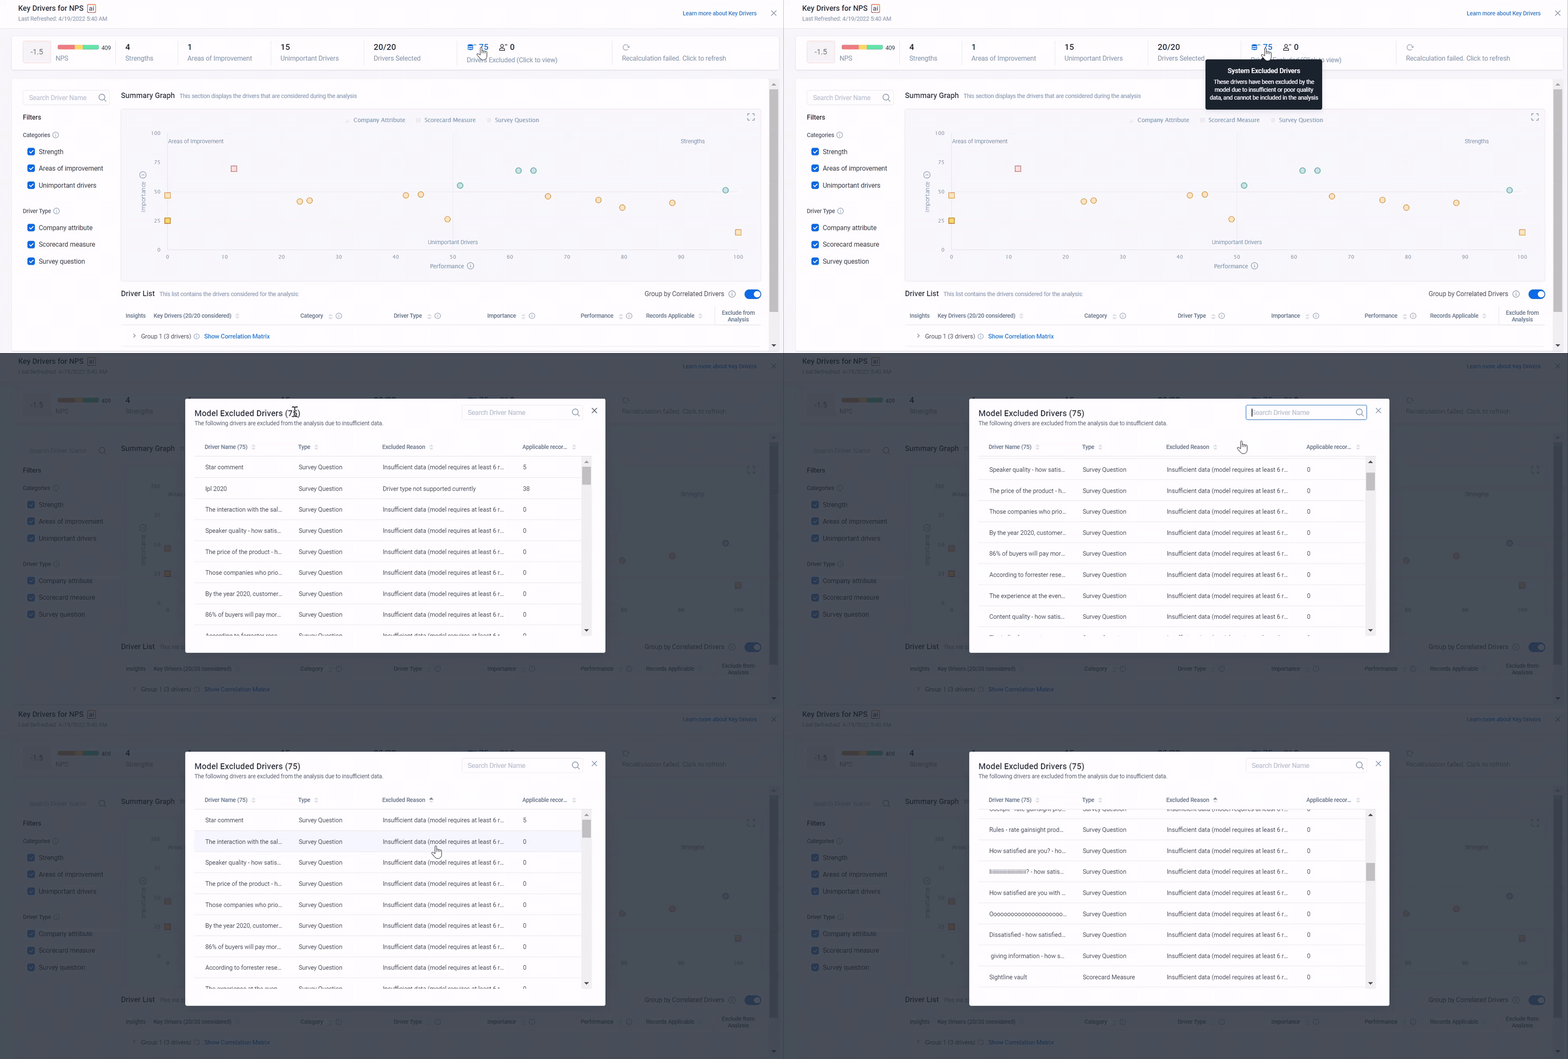
The summary ribbon on top of the View Full Analysis page shows the drivers excluded by our model. Clicking on it will reveal the full list of excluded drivers along with the reason for exclusion.

Does the analysis honor the global filters applied in Text Analytics?
Yes.
How many responses do we need for the analysis?
The model requires at least six responses for the analysis to run.
What are system-excluded variables?
These drivers are excluded by the model due to Poor quality or insufficiency of data.
Can I change how the importance and performance scores are computed?
No. You cannot change the way the importance and performance scores are computed because they are calculated by the model.
Predictive Power of my dashboard is low. Does this mean the analysis is not reliable? How can I improve it?
Predictive Power is an indication of the overall confidence of the model based on the quality of data supplied. Providing better quality data might help improve Predictive Power of the analysis.
Is the analysis done in real-time? How frequently is it updated?
The model updates all analyses once a day. Any admin configuration changes, however, are updated real-time in the product.
What do correlated drivers mean?
These drivers share a strong relationship, and improving one driver improves the others.
How can I feel confident building strategies and recommendations based on the data I receive from Impact Analyzer?
Gainsight has taken extra care to remove accidental correlations to ensure that the correlations presented to you are accurate and impactful.