Application of Statistical Functions in Rules Engine
This article explains the procedure of using Statistical functions, supported by Rules Engine. It is essential to have some background knowledge about Statistics and its supported functions. The below section presents you with an overview of statistics.
Overview of Statistics
Statistics allow you to perform various actions on data (mostly numbers). Statistics is a collection of mathematical techniques that help to analyze and present data. Statistics can be applied to various problems and situations but the underlying concepts remain the same. Thus, it is important to understand what statistics is, not only from an application point of view, but also from an interpretation point of view. This is required because of the diverse applications of statistics, from social science experiments to studying quantum mechanical phenomena.
Bionic Rules in Gainsight supports five statistical functions:
- Covariance
- Correlation
- Median
- Variance
- Standard Deviation
Assumptions
A custom object called Usage Data exists. This object holds custom fields MRR, Active users, Licensed Users, Number of Users, and Customers.
Covariance
Covariance is used to determine if two variables are related. Covariance can range from -∞ to ∞. The first variable in Covariance is considered the independent variable and the second variable is considered the dependent variable, (which is dependent on first). If Covariance exists between two variables, any change in the value of independent variable results in a corresponding change in value of the dependent variable. If two variables have a positive Covariance, it implies that a positive change in the value of independent variable, results in positive change in value of dependent variable. Similarly, If two variables share a negative Covariance, it implies that a negative change in value of independent variable results in a negative change in the value of dependent variable.
For example, consider two companies listed in stock market; Abbett Ltd. (independent variable) and Acme Ltd. (dependent variable). If there exists a positive covariance between these two stocks, it implies that an increase in share price of Abbett Ltd. will result in increase in stock price of Acme as well. In covariance, we cannot say how much increase can be expected. For instance, if Abbett’s share price is increased by 10% we can only say that Acme’s share price also increases, but not by how much. It can increase by 2%, 10%, 30% etc. Similarly, if Abbett and Acme shared a negative Covariance, it implies that an increase in Abbett’s share price results in decrease of Acme’s share price (again, we cannot say how much increase results in how much decrease).
You can calculate Covariance for a Population or a Sample. A population represents all members of a group and a sample represents only some members of a group. Hence, we can say that population is a super set of sample and sample is a subset of population.
The formula to calculate Covariance for a population is:

where
- X = the independent variable
- Y = the dependent variable
- n = number of data points in the sample
- x̄ = the mean of the independent variable x
- ȳ = the mean of the dependent variable y
The formula to calculate Covariance for a sample is:

where
- X = the independent variable
- Y = the dependent variable
- n = number of data points in the sample
- x̄ = the mean of the independent variable x
- ȳ = the mean of the dependent variable y
Bionic Rules calculate Covariance for a population and not sample. Hence, the first formula is used in Rules Engine.
Example: Gainsight uses two fields; Users and Licensed Users. In this example, these fields are used as variables to calculate Covariance. Users field is considered to be the independent variable and Licensed users is the dependent variable, which changes with respect to Users field.
- Navigate to Administration > Rules Engine.
- Click Create Rule.
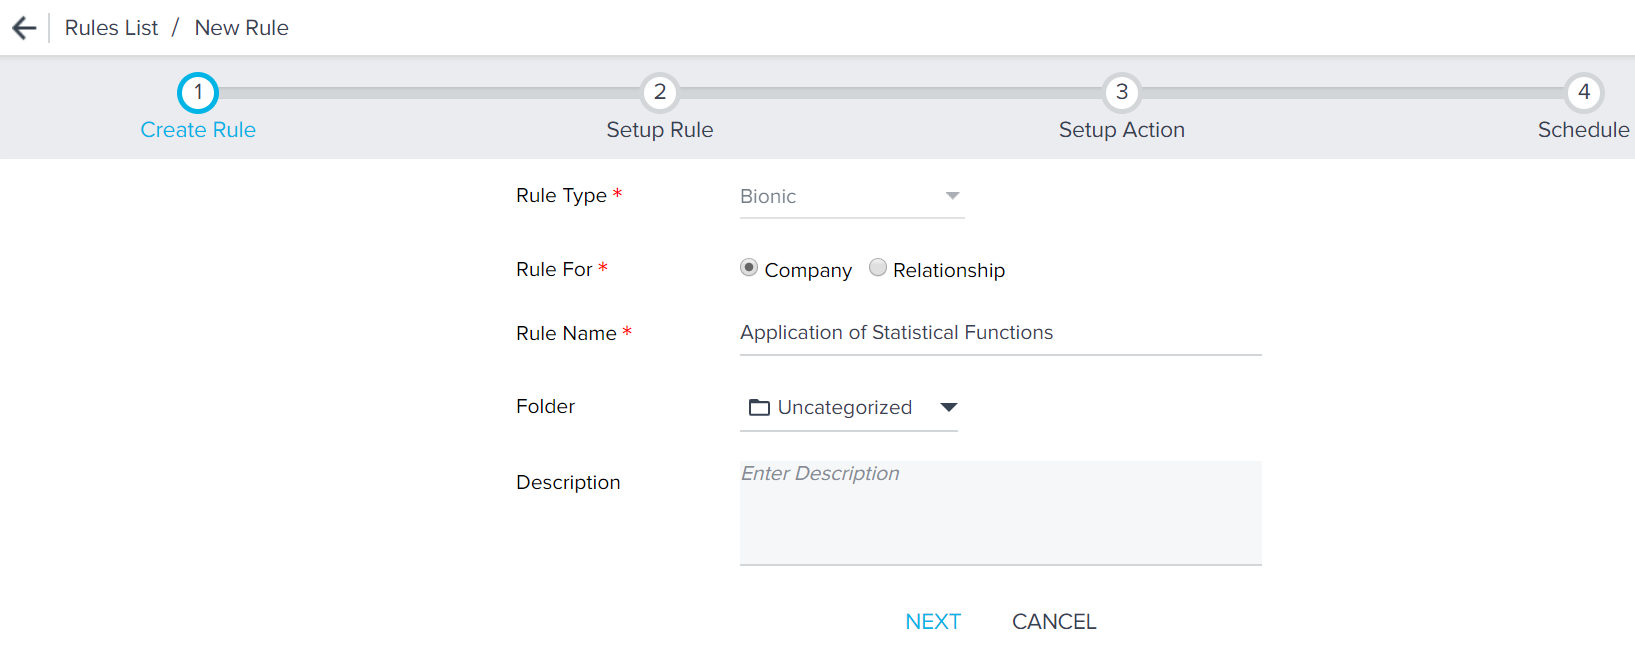
- Enter the following details:
- Rule For: Account
- Rule Name: Enter a name
- Folder: Select a folder for the rule
- (optional) Description: Enter a description.
- Click NEXT.
- Click DATASET.
- Enter a Task Name.
- Select Usage Data as the Source Object.
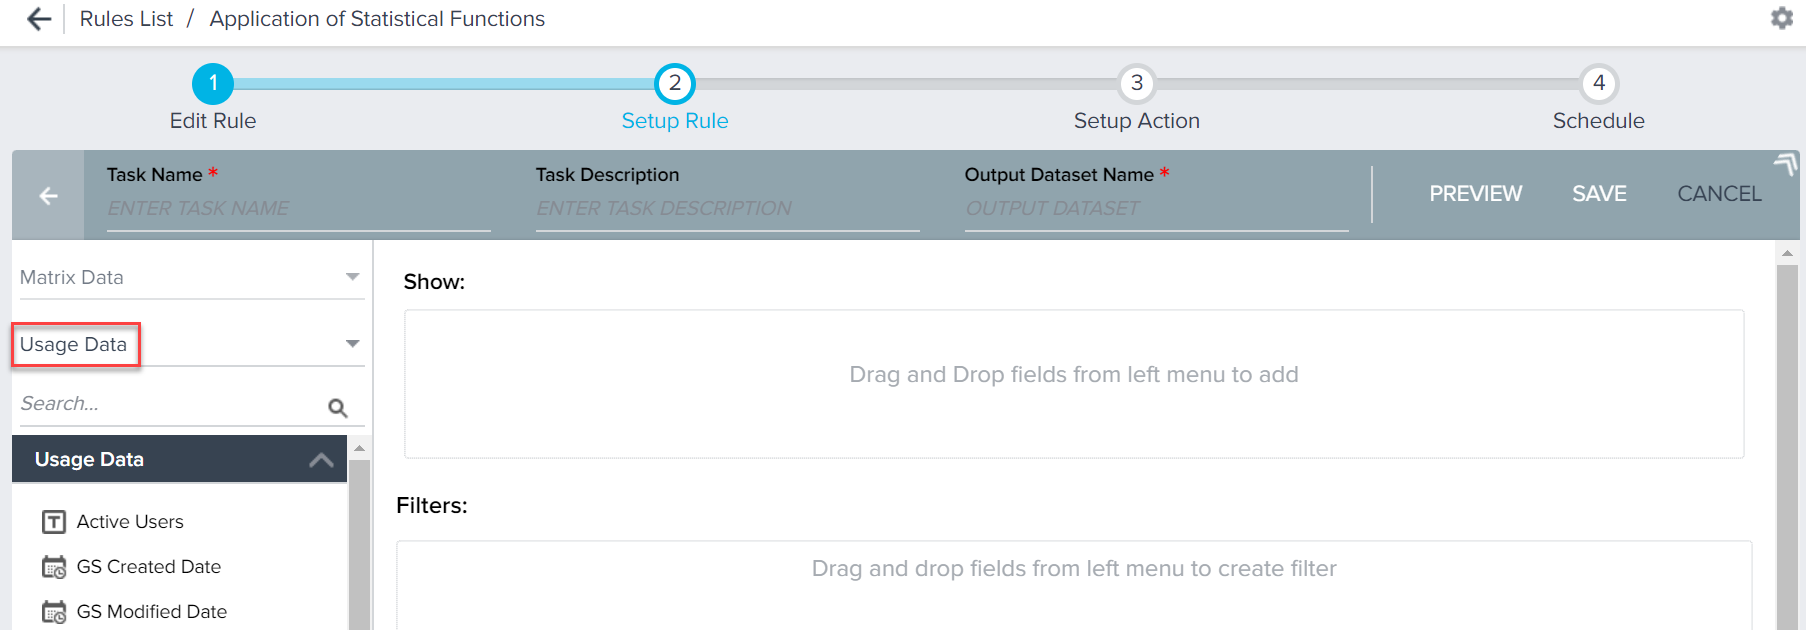
- Drag-and-drop the following fields (after Step 8) to Show section.
- Click SAVE.
- Click <-.

Create Transformation Tasks
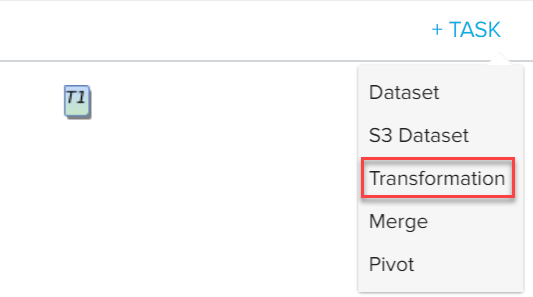
- Click + TASK and select Transformation.
- Enter a Task Name.
- Select T1 as the source (or whatever name you gave to your previous dataset).
- Expand Statistics Formulas.
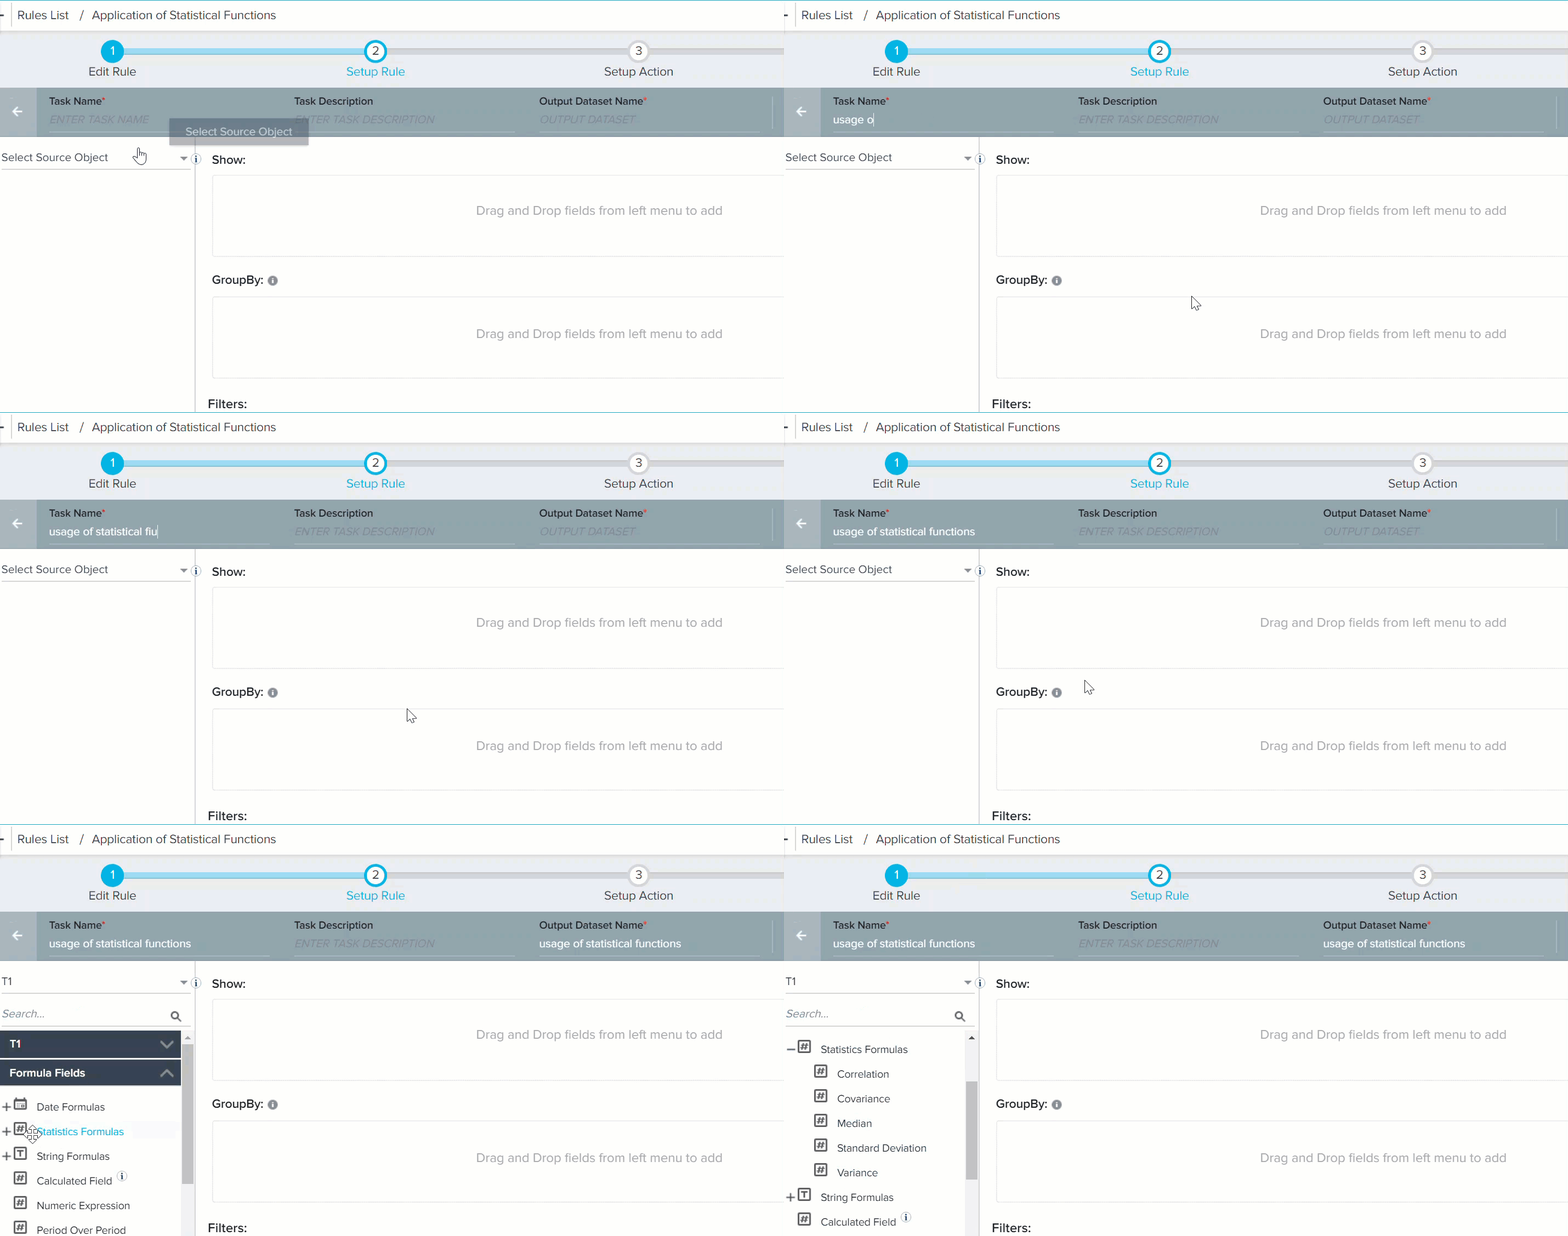
- Drag-and-drop Covariance to the Show section. The Covariance: Method to find covariance of given fields window is displayed.
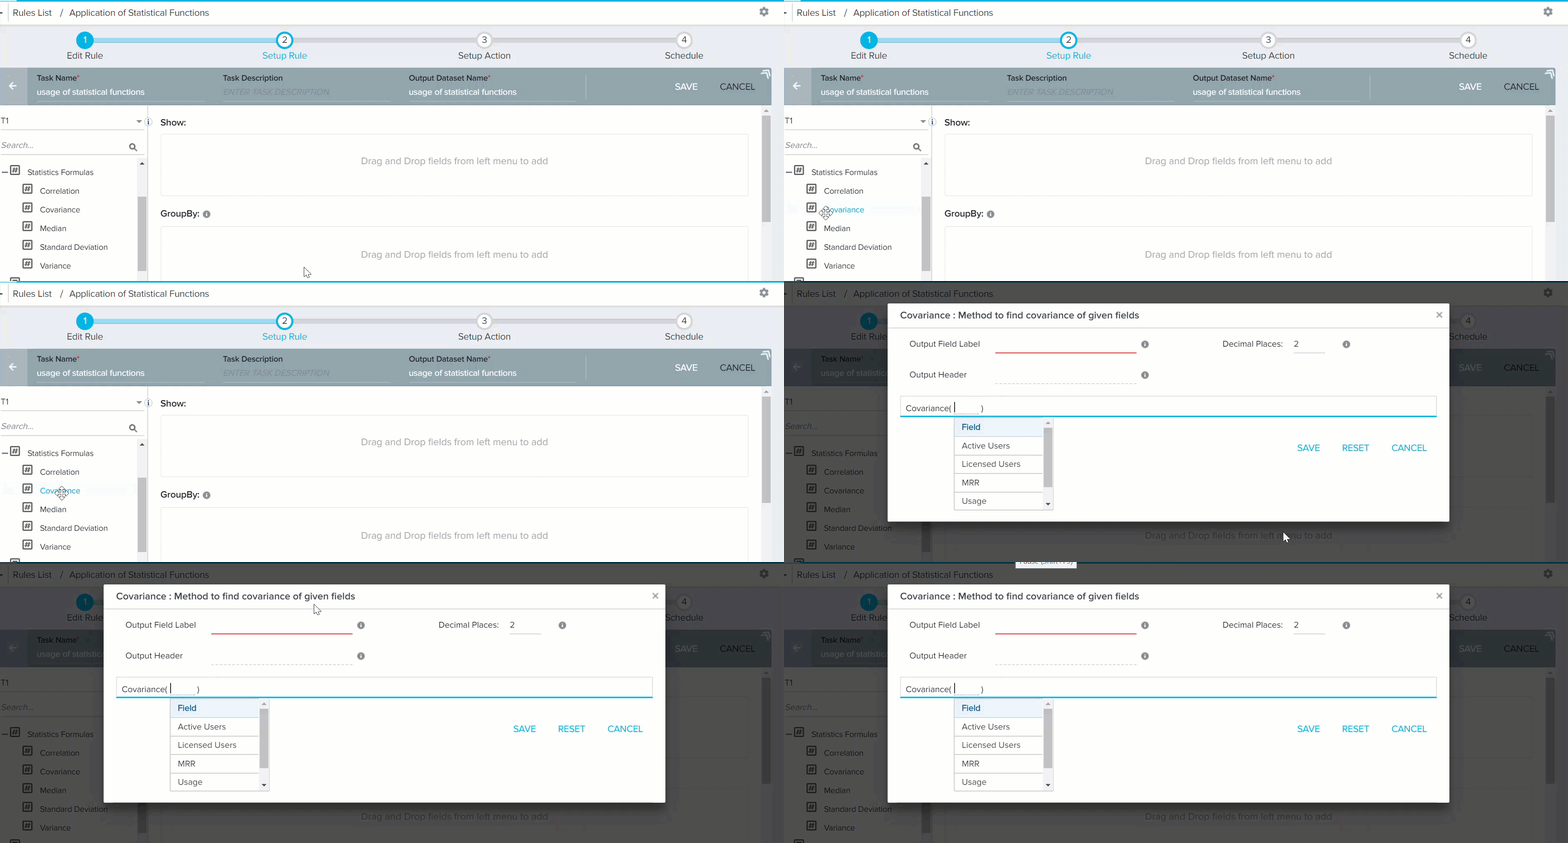
- Enter the following values:
- Output Field Label: Enter only alphanumeric and underscore characters in this field. The label should always start with an alphabetical character.
- Output Header: This name is used as CSV Header to process action. This is view only and is generated based on the Output Field Label (but without space).
- Decimal Places: Enter a number between 0 and 9.
- Select Users and Licensed Users fields in the Covariance section.
Here, Users is the independent variable and Licensed Users is dependent variable. Covariance is calculated based on this notion. - Click SAVE. Clicking RESET erases the data that you entered and allows you to refill the field with new information.
- In the Setup Rule page, you can see the newly created Correlation Field in the Show section as shown in the image.
- To view the results of the functions, save the task and run the rule. In the execution history, you can see the task’s output and download it.
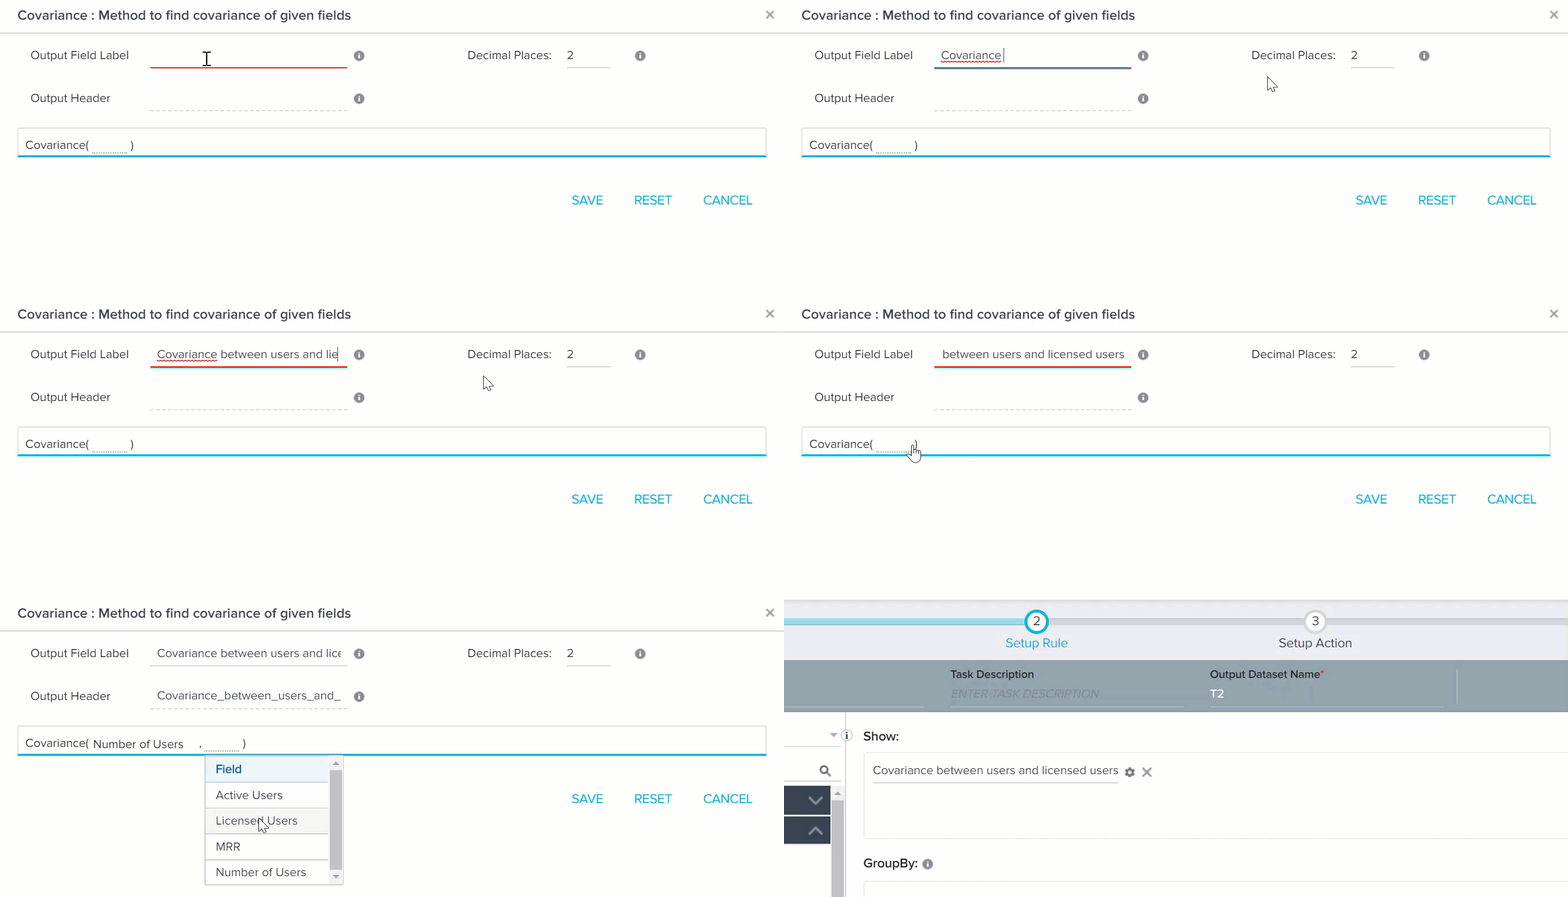
Now, the Covariance is calculated between Number of Users and Licensed users fields, taking into account the values from all of the customers. When you execute this rule the output is as shown below.

Since the result is a positive integer (7.2), it implies that a positive Covariance exists between the Number of Users and Licensed Users. So if Number of Users increase, there is a high possibility that the dependent variable Licensed Users also increases.
Correlation
Correlation is a special case of Covariance. Covariance tells you if any kind of relation exists between two variables. However, Correlation goes one step further from informing whether or not a relation exists between two variables, Correlation also tells you how strongly or weakly two variables are related (if a relation exists). If the two variables are strongly bonded, then a change in one variable will result in a corresponding change in another variable. The possible values of correlation lie in the range -1 to 1. This value is known as the Correlation Coefficient.
For example, consider two companies listed in the stock market; Abbett Ltd. and Acme Ltd. If there existed a highly positive correlation between Abbett and Acme, (correlation coefficient close to 1) then a 5% rise in one share, results in almost 5% rise in the value of another share. However, if there existed a very weak positive correlation between Abbett and Acme, (correlation coefficient close to 0 but not negative), a rise in one stock by 5% could result in rise of another stock by around 1% or 2%. Similarly, if there existed a very negative correlation between Abbett and Acme (correlation coefficient close to -1), a 5% rise in Abbett’s share will decrease Acme’s share value by almost 5%. If there existed a weak negative correlation between Abbett and Acme (correlation coefficient close to 0 but not positive), a 5% rise in Abbett’s share may result in 1% or 2% decline in Acme’s share price. If the Correlation coefficient is 0, it implies that there is no relation between the variables.
The formula to calculate correlation is:

For example, in Gainsight, you can correlate the number of CTAs in a high-risk category (1st variable) and the customer churn in the next 4 months (2nd variable). If the result says that they have a positive correlation, then you can take appropriate steps to understand why the customer may churn.
Following are some use cases in which Statistical Functions can be used:
- Are the number of support tickets positively/negatively correlated to a higher NPS® score?
- Is health score correlated to Churn Rate or Upsell Opportunity?
- Are the Number of Active Users correlated to the MRR obtained from that customer?
Prerequisite: A field with Number datatype should be present to use this function.
Output: Any value between -1 and +1. Can also be a decimal.
In this example, the third use case is depicted. You can use Correlation function to test the relation between Active Users and MRR (Monthly Recurring Revenue). Correlation determines if there is any relation between two variables. Based on the results obtained, you can infer if there's a relationship between the MRR obtained from a customer and the number of Active Users.
To calculate correlation between Active Users and MRR in a Transformation task:
-
Drag-and-drop Correlation to the Show section. Correlation function configuration window appears.
-
In the Correlation function configuration window, provide the following information:
- Output Field Label: Enter only alphanumeric and underscore characters in this field. The label should always start with an alphabetical character.
- Output Header: This name is used as CSV Header to process action. This is view only and is generated based on the Output Field Label (but without space).
- Decimal Places: Enter a number between 0 and 9.
- Select Active Users and MRR fields in the Correlation configuration as shown in the image below:
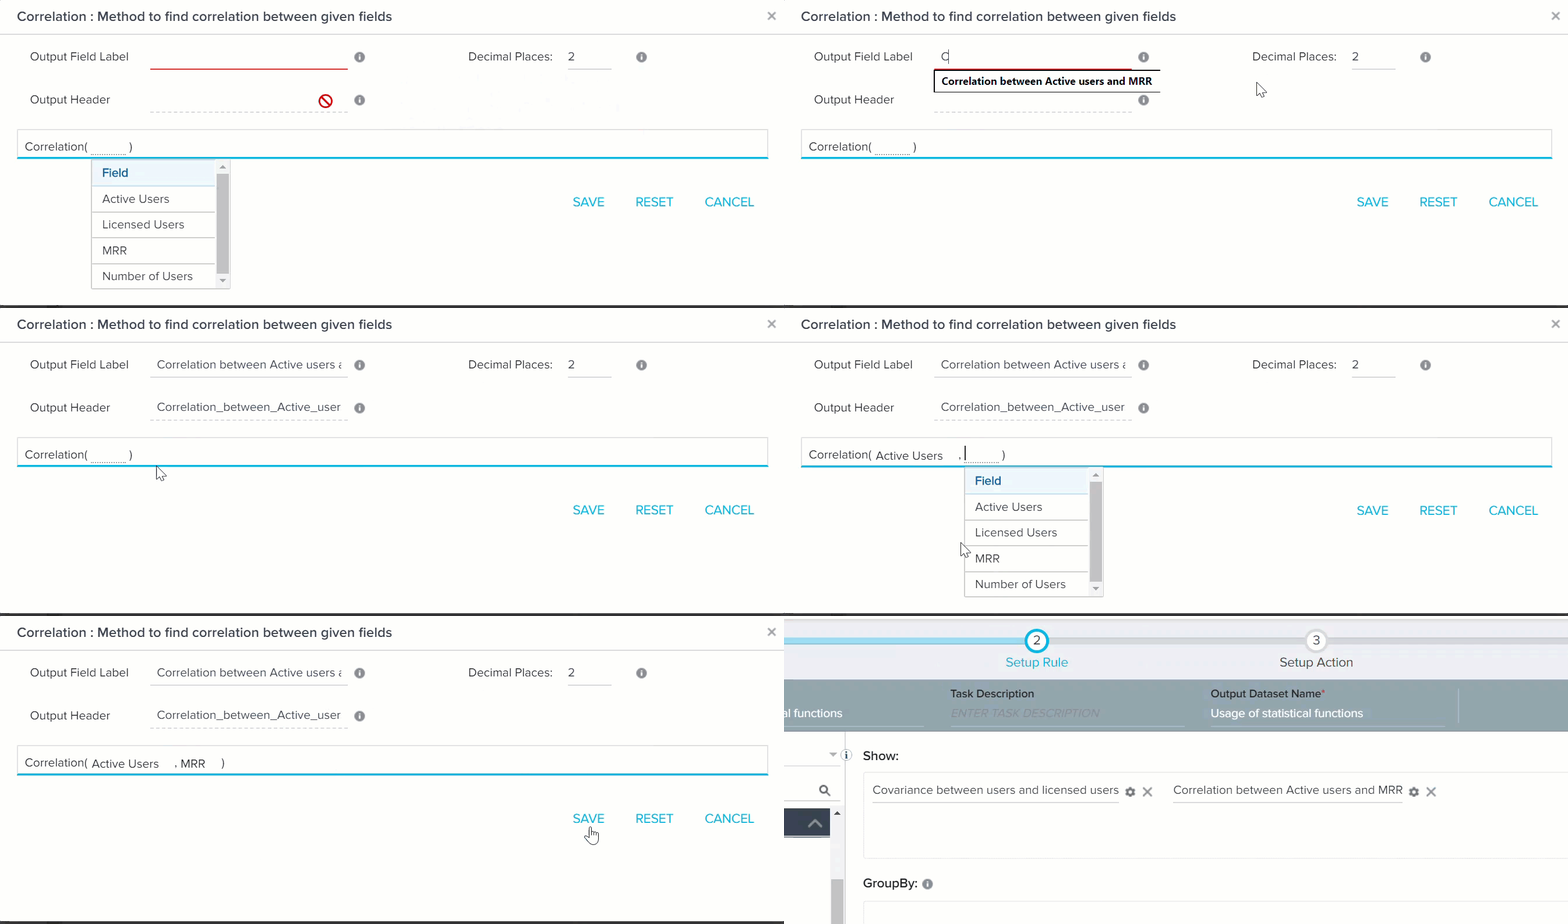
- Click SAVE. Clicking RESET erases the data that you entered and allows you to refill the field with new information.
- In the Setup Rule page, you can see the newly created Correlation Field in the Show section as shown in the image.
- To view the results of the functions, save the task and run the rule. In the execution history, you can see the task’s output and download it.

As Correlation coefficient is 0.99, it implies that there exists a strong positive correlation between Active Users and MRR. So, if Active users increase, MRR also will see a corresponding rise.
Median
Median refers to the central value of a dataset. To calculate median, you must first arrange the data in either ascending or descending order. Once the sorting is done, you must calculate the number of terms in the dataset. If there are odd number of terms in the dataset, the middle value is the median. However, if the dataset has an even number of elements, the average of the two most central elements is the median.
For instance, in the set (23,63,73,78,99) 73 is the median (odd number of elements)
However, in the set (12, 24, 28, 34, 40,46) the average of 28 and 34 (31) is the median.
Median on its own only tell you about the middle value of the group. You cannot infer much from this data. However, when the median of a group is compared to the average of that group, you can get an idea on the distribution of the dataset. If mean and median are same, it implies that the group is evenly distributed from lower to higher values. When mean and median are different, it implies that the data is asymmetric in nature. Data is either skewed towards left half of the group or the right half.
In Bionic Rules, MRR value from various customers can be used and median can be calculated on this value. If it is not the same as mean, it implies that MRR obtained from various customers is asymmetric in nature.
To calculate Median of MRR:
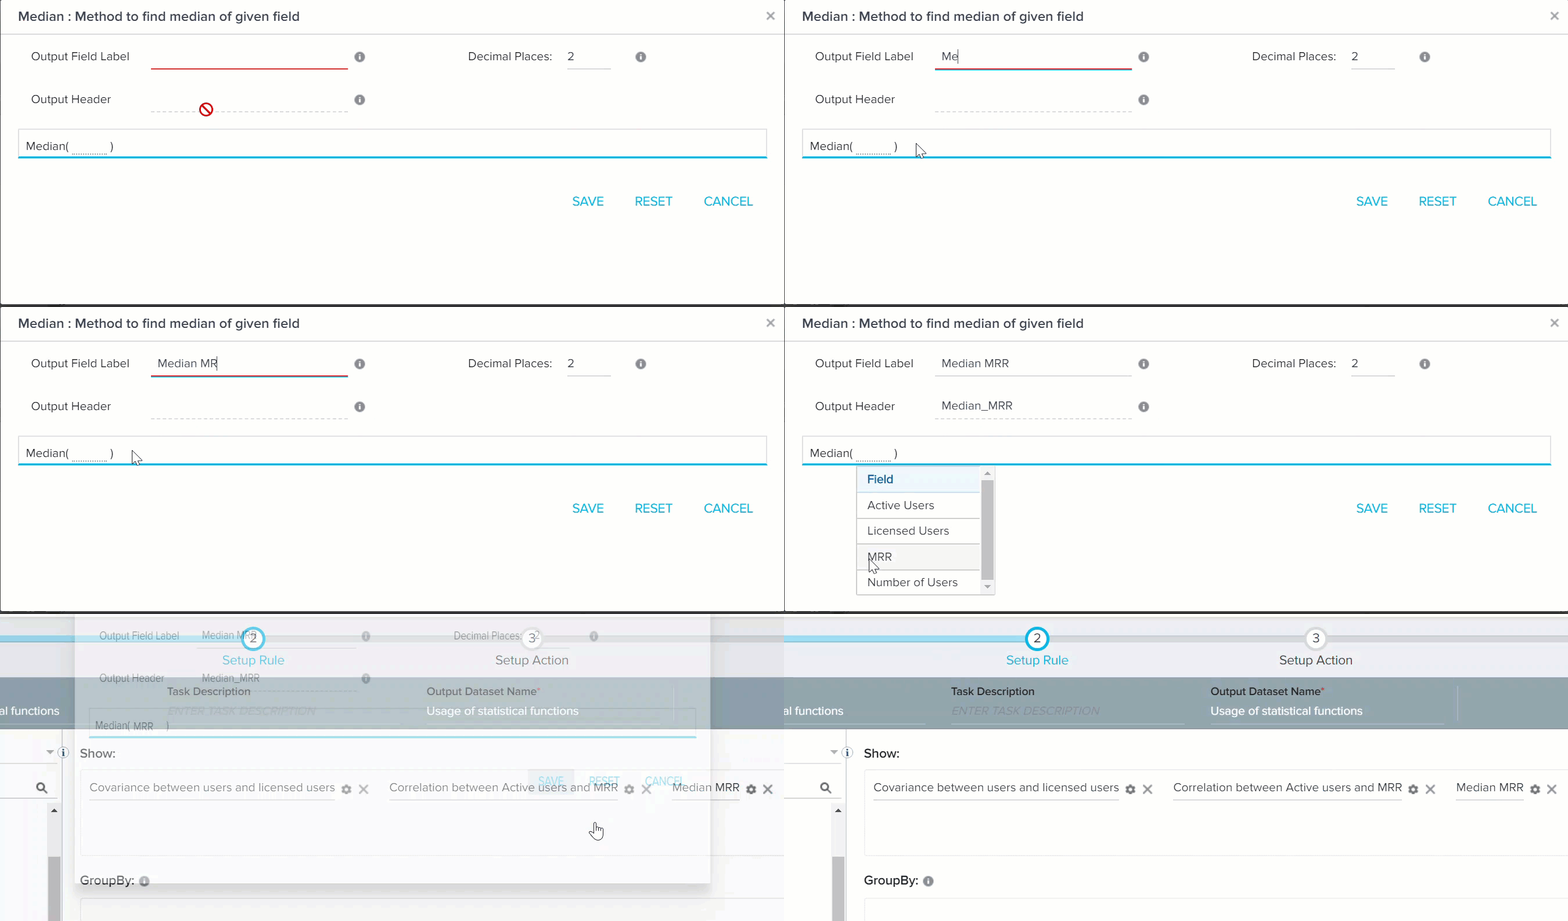
- Drag-and-drop MRR to Show section. The Median: Method to find Median of given field window is displayed.
- Provide the following information:
- Output Field Label: Enter only alphanumeric and underscore characters in this field. The label should always start with an alphabetical character.
- Output Header: This name is used as CSV Header to process action. This is view only and is generated based on the Output Field Label (but without space).
- Decimal Places: Enter a number between 0 and 9.
- Select MRR in the Median section.
- Click SAVE.
- Drag-and-drop MRR field to Show section.
- Click the downward arrow and select AVG of MRR. This calculates the average of MRR, so that it can be compared with Median value.
- Click SAVE.
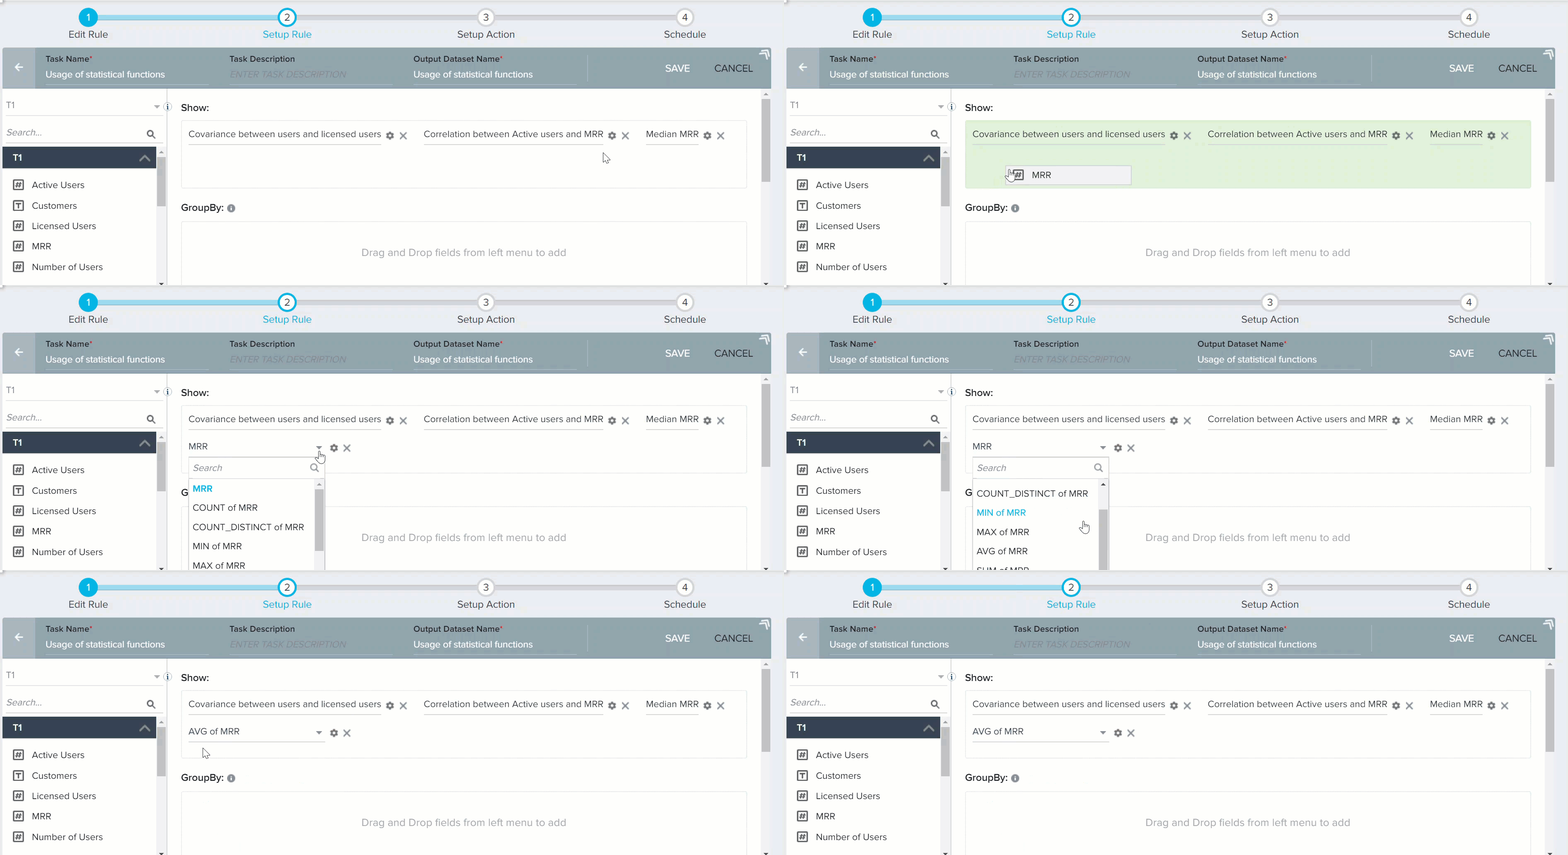
When you run the rule, the final output is as shown in the below image.

Since, Median of MRR (4000) is not equal to mean of MRR (4220), it implies that MRR obtained from various customers is asymmetrical in nature. Data is skewed.
Variance
Variance is a measure of how far individual data values of a set are spread out from their mean value. Variance can be defined as “the average of the squared differences from the mean”. Previously, a median and mean of the entire group was compared. However, with variance, the mean of the group is compared with individual values of the group. Variance can never be negative. A high variance implies that elements of a group are far away from their mean and each other. A low variance implies that individual values of a group are close to their mean values and each other. If the value of Variance is high, it indicates that there exists a strong volatility in the group. A Variance of 0 indicates that all values within a set of numbers are identical. For instance, in share market consider a company’s share prices over a period of 5 days are:
25 311 102 412 97
It is clear that the share price of this company varies drastically on a daily basis. The mean of this group is 189.4. All elements of the group are far away from the mean. It implies that a high degree of risk is associated with the shares of this company. But with high risk also comes a chance of earning high profit. So, people investing in this company can expect either sudden high profits or high loss.
Consider another company with following share prices:
24 26 25 23 24
The mean of this group is 24.4. All elements of the group are very close to the mean. The volatility and thus the risk of this group is very low. So it can be expected that people investing in this company can expect modest returns or loss over a period of time.
Variance of population vs Variance of sample
A population represents all members of a group and a sample represents only some members of a group. Hence, we can say that population is a super set of sample and sample is a subset of population.
The variance of a population is defined by the formula:
σ2 = Σ ( Xi - X )2 / N
where σ2 is the population variance, X is the population mean, Xi is the ith element from the population, and N is the number of elements in the population.
The variance of a sample is defined by the formula:
S2 = Σ ( xi - x )2 / ( n - 1 )
where s2 is the sample variance, x is the sample mean, xi is the ith element from the sample, and n is the number of elements in the sample. Using this formula, the variance of the sample is an unbiased estimate of the variance of the population.
In Bionic Rules, the variance function is designed to calculate the variance of a population and not a sample.
In Gainsight, a custom formula field Usage% exists. This field calculates usage % of your product by various users at a customer’s office, on a daily basis. This value varies on a daily basis. Some days, the Usage% can be really low, some days it can be high or some days 0% usage may be recorded. A high Variance in Usage% implies that the customer is not regularly using your product. Some days users at the customer’s office overuse the product and some days no user uses your product. High chance of churn is associated with this type of customer. On the other hand, it could be these customers can bring in tremendous revenue in future, because on some days customers are using the product excessively. So the probability of both churn and upsell are high for this kind of customer.
If usage % has a small variance, it implies that users at customers office are evenly using the product. There is a high chance of renewal associated with this type of customer. But since only existing users are using the product and not many new users are added, a low degree of upsell exists with this kind of customer. But also churn rate is low, since some of the users are always using your product. Customer is more likely to renew the license in such cases.
Since the value of Usage% is calculated at individual customer level, a new dataset must be created. The step by step procedure to calculate Covariance of Usage % is:
- Click <- to return to the Setup Rule screen.
- Click + TASK and select Dataset.
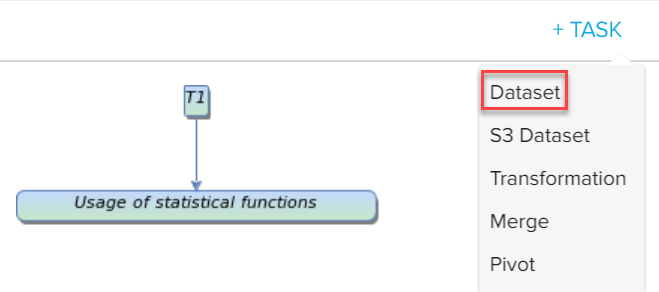
- Enter a Task Name.
- Select Matrix Data as source.
- Select Usage on daily basis as Source object.
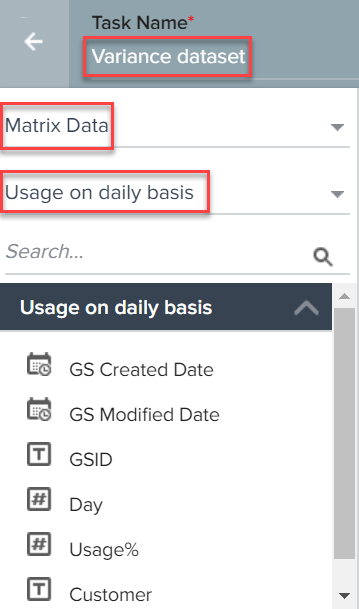
- Drag-and-drop Usage% and Customer fields to Show section.

- Usage% of only one company must be used to get accurate values. So filter the required customer.
- Drag-and-drop Customer field to Show section and enter the required customer in the filters field.

- Click SAVE.
- Click <-.
Create Transformation task for Variance and Standard Deviation
- Click + TASK and select Transformation.
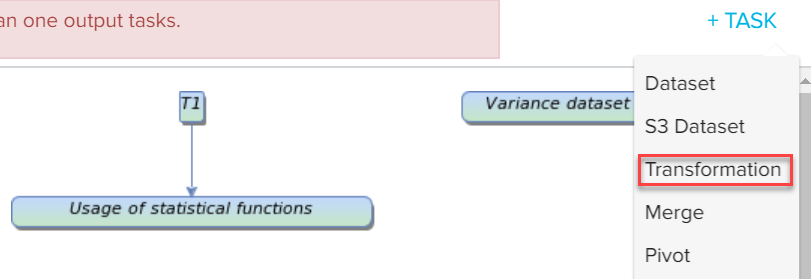
- Enter a Task Name.
- Select variance dataset as the source object. (or whatever name you gave in the previous dataset)
- Expand Statistics Formulas.

- Drag-and-drop Variance to Show section.
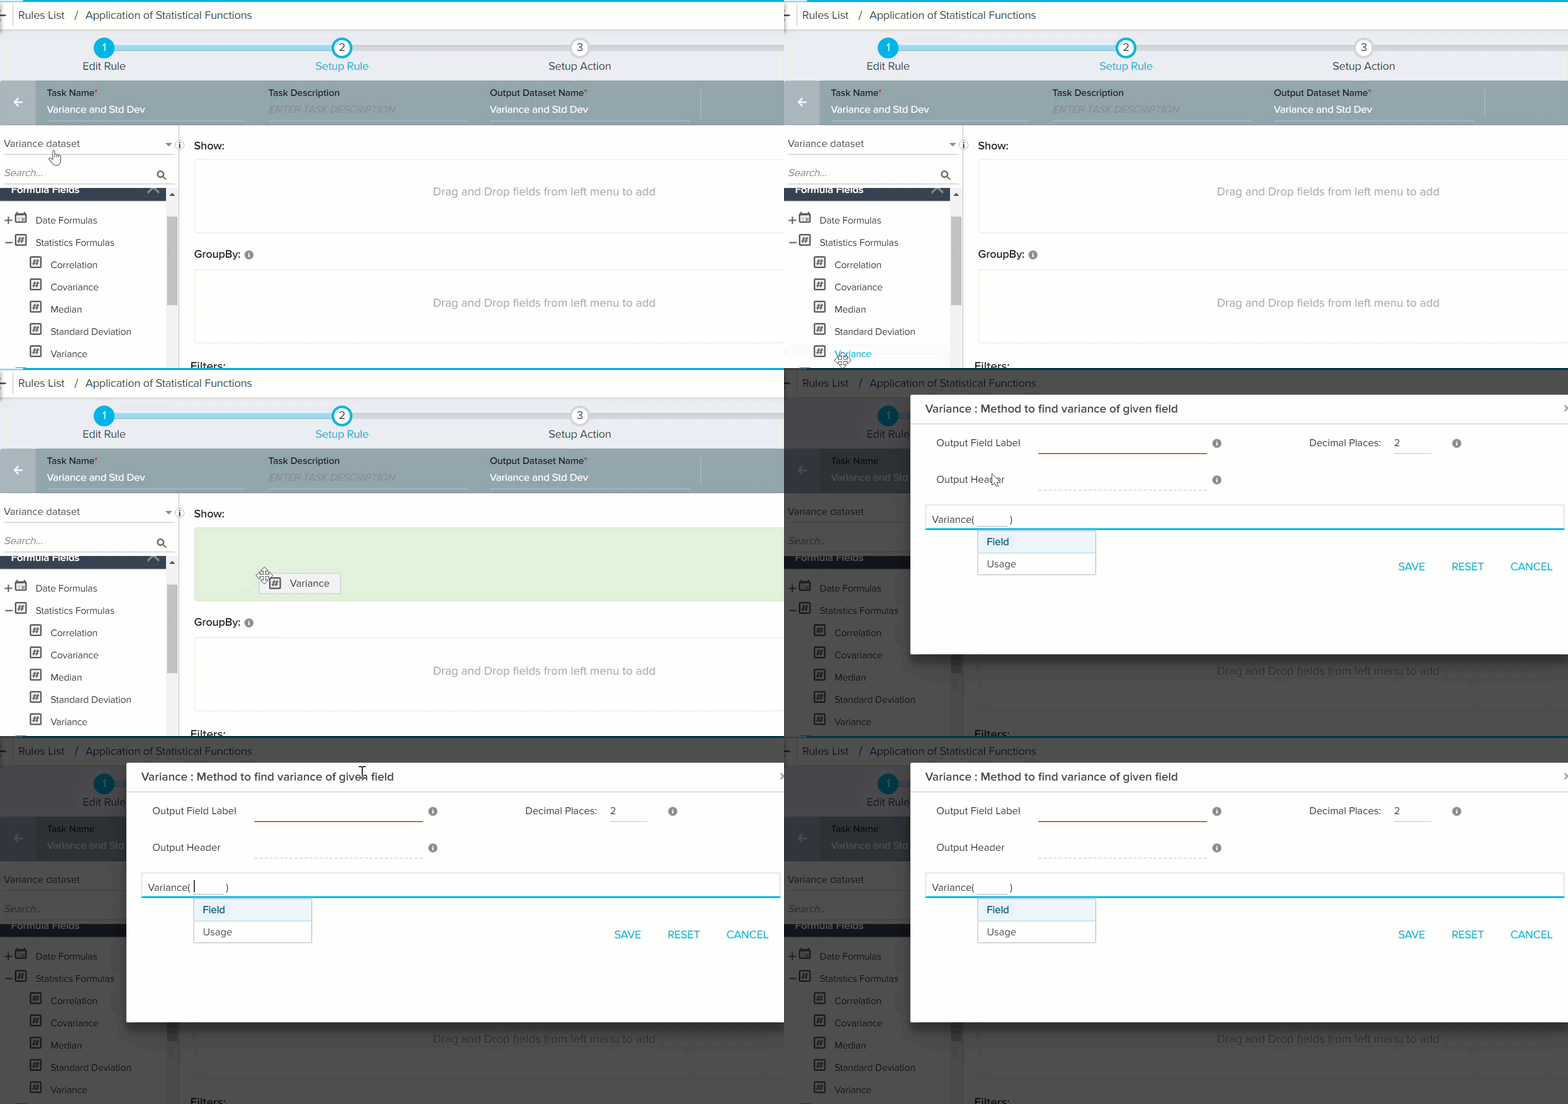
- Provide the following information:
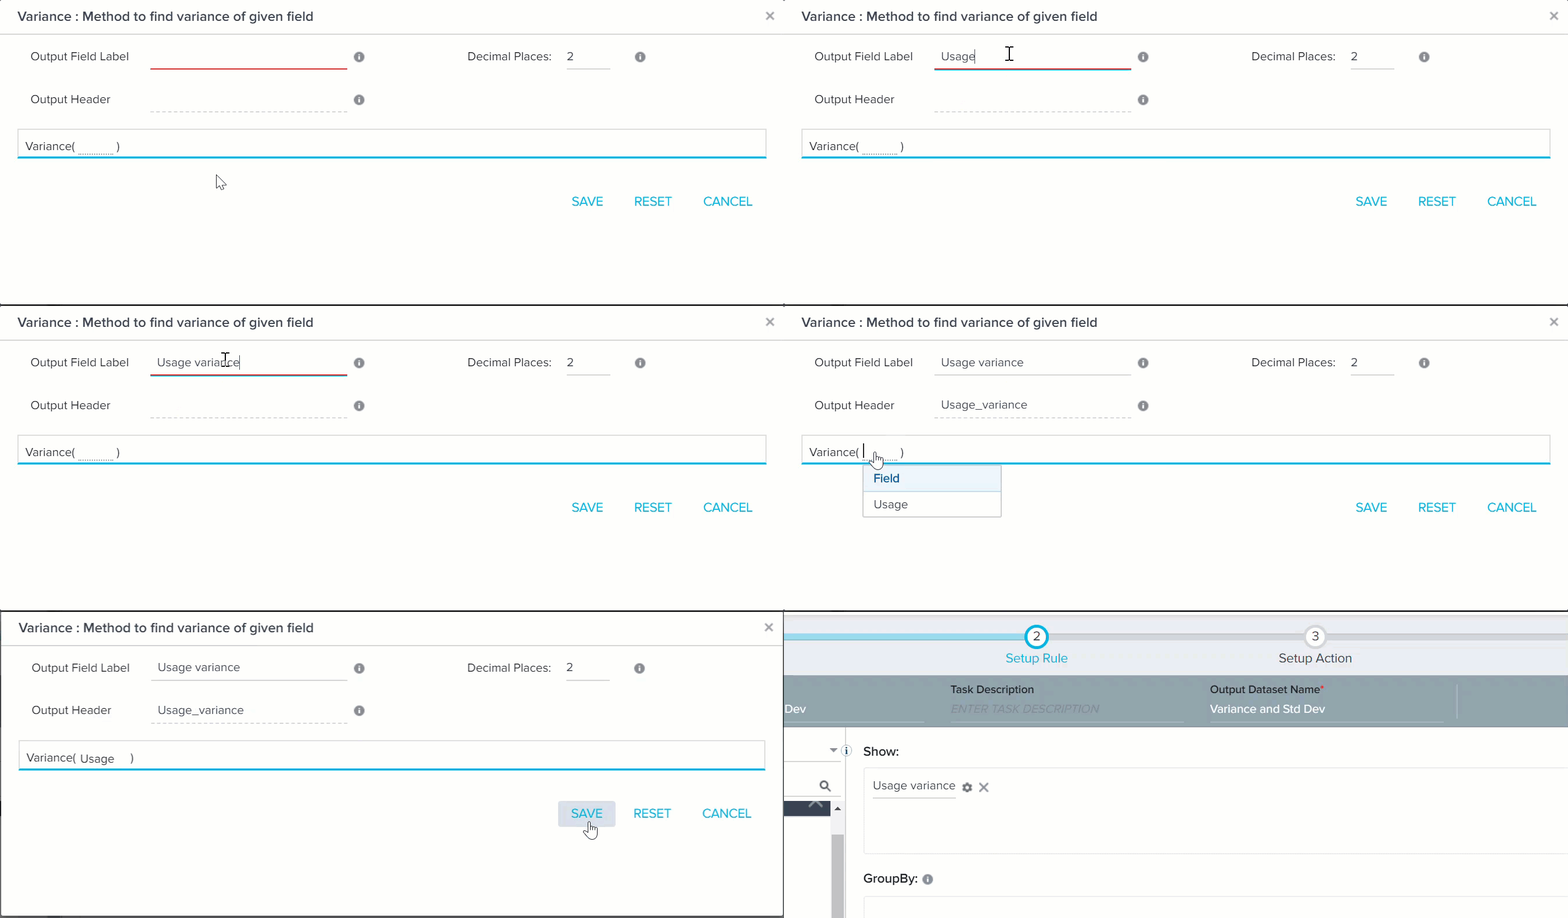
- Output Field Label: Enter only alphanumeric and underscore characters in this field. The label should always start with an alphabetical character.
- Output Header: This name is used as CSV Header to process action. This is view only and is generated based on the Output Field Label (but without space).
- Decimal Places: Enter a number between 0 and 9.
7. Select Usage, in Variance section (Its usage% field. But special characters are not recognized here. So % is not visible).
8. Click SAVE.
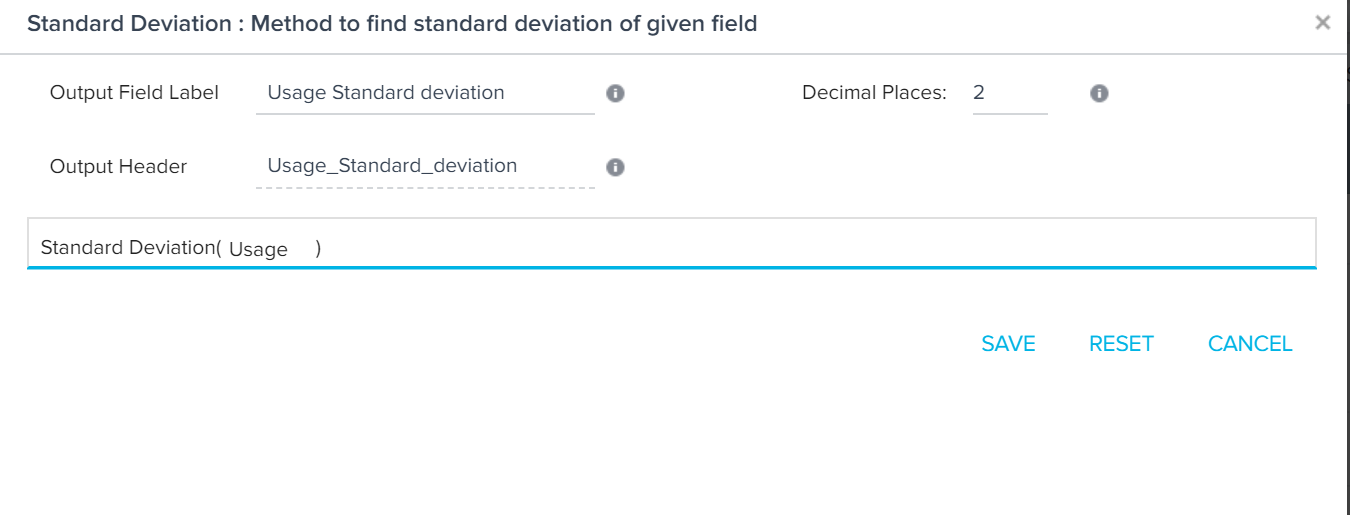
Standard deviation is the square root of Variance. You can also calculate standard deviation of usage %. The square of standard deviation is Variance. To use Standard deviation:
- Drag-and-drop Standard Deviation to Show section.
- Enter the values as shown in the below image.
The final output is as shown in the below output.

So, a Variance of 96.58 implies that every element in the Usage% is away from mean by 96.58.
Since two transformation tasks have been used, a merge task must be created.