Q3 2025 Release Notes for Customer Communities (CC)
Release Date: October 30, 2025
Enhancement
Translate Community Content Instantly with AI Translation (General Availability)
The On-Demand Translation feature is now generally available as AI Translation. This AI-powered capability enables community users to instantly translate topic titles, bodies, and replies into their preferred language, improving accessibility and engagement across global audiences.
| IMPORTANT: AI Translation is a paid add-on feature. Contact your Account Manager to enable it for the community. |
What’s New
- Feature Name Update: On-Demand Translation is now renamed to AI Translation throughout the product interface and documentation.
- New Enhancement: Admins can now define specific keywords or phrases to be excluded from translation. For example, add brand or product names such as Gainsight PX or Community to the exclusion list to ensure they appear consistently in all languages.
Key Capabilities
- Translate community content into multiple languages instantly
- Translate topic titles, body text, and replies
- Customize translation language options for each community
- Revert to the original language using the Show Original option
- Apply translations across all topic types and content formats
Note: To track usage of AI translation in the community, you need to configure the datalake and use events like:
- hubai.threadtranslatedbyondemandai
- Hubai.replytranslatedbyondemandai
For more information on how to set up a data lake, refer to the Getting Started with Data Analytics in CC Data Lake article.
Business Use Case: A German user visits an English topic, but may struggle to understand the content and fully engage in the discussion. The AI Translate button allows the user to view the post and replies in German, making it easier to participate in the conversation. Static labels, such as Best answer by…, remain in English, but the core content becomes accessible, helping users engage more effectively across languages.
Admin Configuration
Admins can enable this feature to be available across multiple languages.
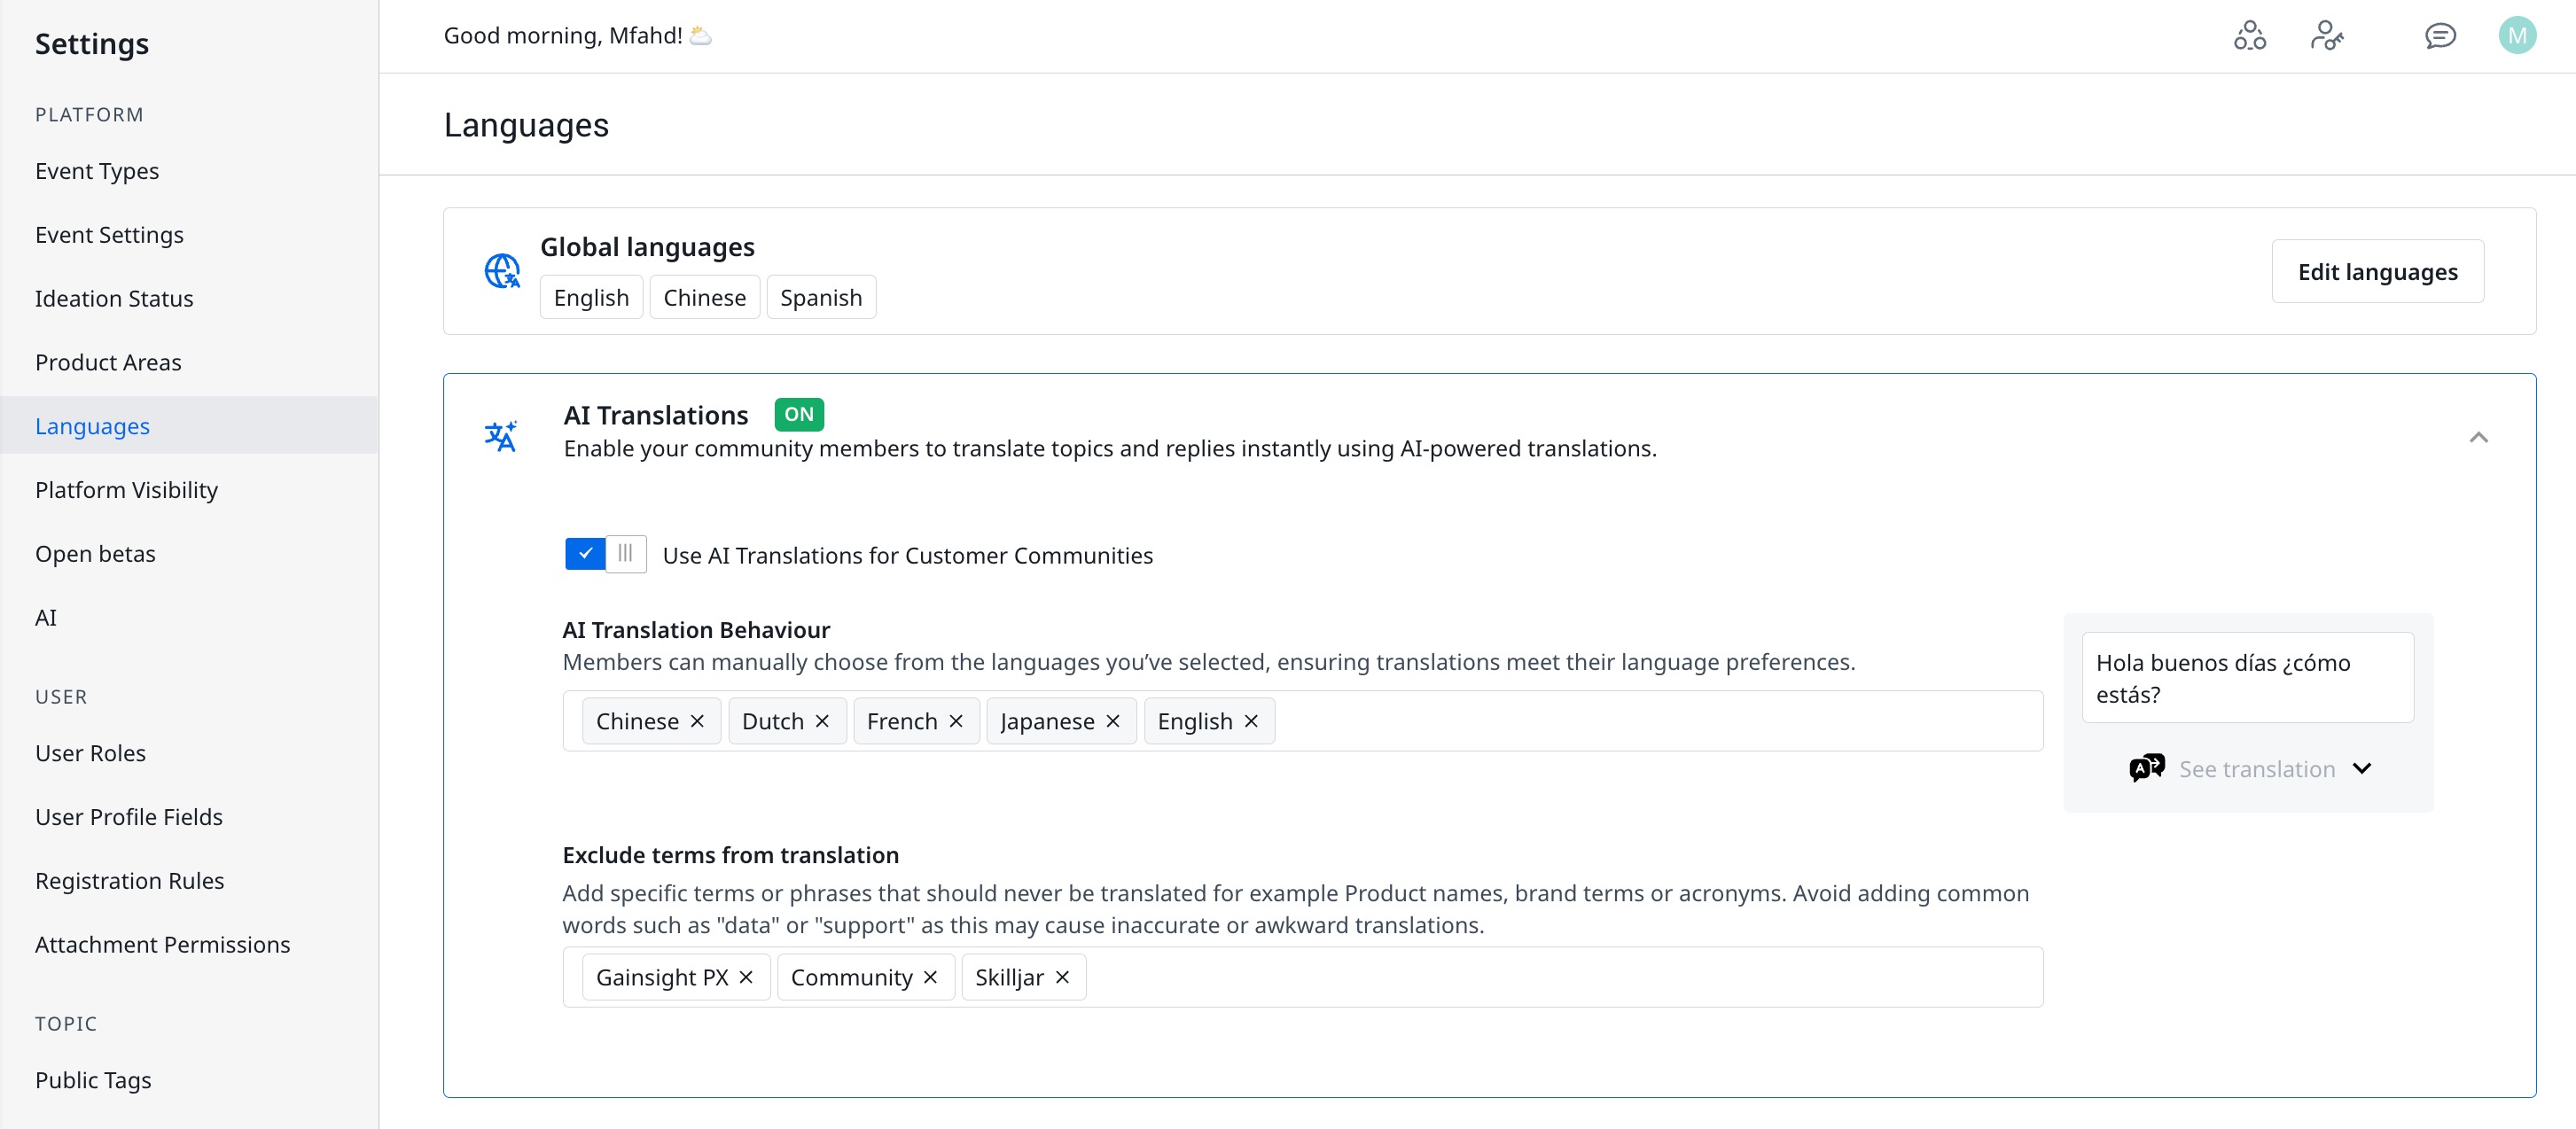
To enable AI translation:
- Navigate to Settings > Languages.
- Click the AI Translations section to expand.
- Turn on the Use AI Translation for Customer Communities toggle to add languages for translation.
- From the AI Translation Behavior drop-down, select the languages to be added.
- In the Exclude terms from translation, enter words or phrases that are not to be translated.
For more information about AI Translation, refer to the How to Use AI Translation in the Community article.
Release Date: October 28, 2025
New Feature
Configure Secure API Connectors for Community Pages
Gainsight introduces Secure API Connectors, a new platform capability that lets Community Admins securely integrate external systems as widgets directly within pages in their Customer Communities. With this feature, admins can build custom widgets that connect to third-party APIs such as Salesforce, Zendesk, Aha!, or custom applications, without exposing credentials in the browser.
The Secure API Connectors feature uses the Secrets service and a server-side proxy to safeguard all credentials and data exchanges. It also enables admins to build flexible, scalable widget integrations on Community pages while maintaining enterprise-level security and control.
Setting up a connector involves the configuration of the following two sections under Integrations:
| Section | Definition and Purpose |
|---|---|
| Connectors | Define an HTTP call to an external API (URL, method, authentication, and so on). The Connector configuration is stored and executed on the backend, acting as a proxy to prevent the front end from displaying confidential information. |
| Secrets |
Store sensitive credentials (such as API keys or tokens). Secrets are stored only server-side, encrypted at rest, and are never exposed in the browser. You reference them securely within connector templates using the helper.
{{ get_secret('name') }}
|

For more information on how to set up the API connector, refer to the Secure API Connector article.
Release Date: September 18, 2025
Enhancement
Content Moderation Widget
The Content Moderation widget is now available on Control Home. This enhancement introduces a centralized view for managing user-generated content.
Key Benefits
- Streamlined Moderation: View and act on content that violates community guidelines directly from Control Home.
- Increased Visibility: Identify Topics and Replies that have been moved to Trash or Reported.
- Faster Resolution: Reduce manual review effort by accessing flagged content on the Home screen in a single location.
- Improved Community Health: Ensure discussions remain relevant, safe, and aligned with community standards.

For more information on how to add the widget, refer to the Overview of Control Home article.
Release Date: September 10, 2025
Enhancement
Moderation AI Agent (AI Moderation) in Pre-Moderation Rules
| IMPORTANT: Starting September 10, 2025, this feature will be rolled out in phases. |
|---|
Gainsight is excited to introduce the Moderation AI Agent in Gainsight Community. This new feature is available under the existing Pre-Moderation Rules.
The Moderation AI Agent uses machine learning to automatically evaluate and flag user-generated content before it goes live. This reduces manual review load for moderators, ensures faster content screening, and enhances community safety.
Note: When AI Moderation is enabled, an AI moderator user is created. Gainsight recommends not deleting this user.
Key Benefits
- Automatically detects potentially inappropriate or harmful content.
- Flags submissions for manual review or auto-blocks based on risk level.
- Complements existing controls such as Keyword Blocker and Moderator Approval.
Business Use Case: With AI Moderation, moderators can focus on resolving critical cases instead of manually reviewing every submission. Automated flagging and risk-based review reduce repetitive work, speed up response times, and allow teams to prioritize the issues that matter most.

For more information on how to configure the Moderation AI Agent, refer to the How to Use AI Moderation article.
For a demo on the feature, click here.
Release Date: September 09, 2025
Enhancement
SSO Field Mapping for End Users SSO
Gainsight has introduced a new SSO Field Mapping capability as an enhancement to the existing End User SSO login configurations in Customer Community. This enables admins to map user identity fields such as ID, Email, Username, and Avatar between their Identity Provider (IdP) and Gainsight, without requiring backend support or engineering intervention.
The mapping interface is available after an SSO method is installed. It supports varied token claim formats from different IdPs, improving flexibility and integration accuracy.
Key Benefits
- Map custom token claims (for example: profile_email) to Gainsight's supported schema (for example: Email, Username, and so on).
- Ensure seamless user authentication and accurate profile provisioning.
- Edit mappings through self-service for greater flexibility.
IMPORTANT
- Use the Test log in feature to fetch available claims from the IdP’s token.
- Mappings:
- ID and Email must be mapped for successful authentication.
- Username and Avatar are optional and based on end-user preference.

For more information on how to map fields, refer to the SSO Field Mapping article.
Release Date: August 28, 2025
Enhancement
Widget Visibility
The Widget Visibility feature introduces targeted personalization to community pages by allowing admins to control which widgets appear for different user segments. This ensures a more relevant, engaging experience tailored to user roles, lifecycle stages, and product usage.
Key Capabilities:
- Segment-Based Display Control: Show widgets only to selected user segments such as product managers, guests, or new users.
- Visibility Settings:
- Public: Visible to all users.
- Private: Hidden from all except admins.
- Guest users: Visible only to users who are not signed in.
- View As Preview Mode: Instantly preview how a page looks for any segment without needing to log in as different users.

For more information on how to set custom visibility, refer to the Widget Visibility article.
Release Date: August 19, 2025
Enhancements
Notification Support in S3 Connector
Gainsight has introduced notification support in the S3 Connector to help Community Managers and Admins stay updated on data availability.
You can now configure real-time notifications that trigger whenever new data is added to your Community Data Lake Amazon S3. Supported notification methods include:
- SNS Topic
- SQS Queue
- HTTP/HTTPS
These notification methods help ensure timely updates for downstream workflows and reporting tools, even if you are not using third-party automation platforms.

For more information on how to enable notifications for S3 Connector, refer to the How to Create an S3 Connection article.
Out-of-the-Box Community Dashboards
Gainsight has refreshed seven out-of-the-box Community Dashboards to deliver a cleaner, more intuitive experience. These dashboards provide a comprehensive view of community activity, customer engagement, ideation trends, and more which are supported by flexible, and modern visualizations to drive data-based decisions.
What’s new:
- Customizable views to match your reporting needs
- Global Filters to match your data requirements.
- Modern visual design for improved readability and usability
The dashboards also include a dedicated KPI guide explaining the SQL queries behind the metrics, making it easier to understand and trust your data.
Limitations
- Only SSO-enabled communities can use OOB dashboards, and their SSO flag must be set to true for SSO login.
- If you have CS and CC: Community users with Viewer_Analytics license in CS can view dashboards; users with lower licenses must request an upgrade from CS admins.
Audience Dashboard
The Audience dashboard is a robust analytics dashboard designed to provide a detailed understanding of visitor traffic and user engagement across your digital platform. By leveraging a rich set of Key Performance Indicators (KPIs) and customizable date filters, the dashboard empowers product owners, marketers, and analysts to monitor audience behavior, identify trends, and measure reach effectively.

For more information on the Audience dashboard and the KPI metrics, refer to the following articles:
Content Dashboard
The Content dashboard provides deep insight into user‑generated posts, topics, and replies. It highlights engagement trends with metrics such as Posts Created, Topics Created, Replies Created, Likes Received, Positive Content Helpfulness Votes, and Average Response Time.

For more information on the Content dashboard and the KPI metrics, refer to the following articles:
Engagement Dashboard
Designed for community admins and customer success teams, the engagement dashboard tracks customer‑level activity and highlights both active and inactive customers.

For more information on the Engagement dashboard and the KPI metrics, refer to the following articles:
Q&A Dashboard
The Question-and-Answer (Q&A) dashboard is a powerful tool for community admins to analyze Q&A interactions within the community. It provides visibility into how questions are asked and answered, by whom, and reveals trends in engagement, support effectiveness, and user contributions.

For more information on the Q&A dashboard and the KPI metrics, refer to the following articles:
User Dashboard
The User Dashboard is a powerful analytics dashboard that delivers in-depth insights into community member activity and engagement. Tailored for community managers, product teams, and engagement analysts, it combines a set of key performance indicators (KPIs) with flexible filter options to track user growth, participation trends, and interaction levels over time.
Release Date: August 06, 2025
Enhancement
Enhanced Community Search Experience is now GA
The community search experience provides an intuitive and informative interface that brings the most accurate and relevant search results upfront, helping community users save time.
With this release, the new search experience is entering General Availability (GA) and has been improved in the following ways:
- Metadata Labels: Idea status labels (for example: New, Open, Closed) and event type labels (for example: Office hours, Conference) are added to both the live-search dropdown and the search results page.
- Federated Results: Results that originate externally (federated results) now display metadata identifying their external source.
- New Filter Introduced: Added a new filter named Product Area, allowing users to filter results based on product-related metadata (applicable to product updates or ideas).

For more information on Community Search, refer to the Change Document for Enhanced Search Experience in Community article.