Reports for a Single Program
Gainsight NXT
This article refers to the Analytics feature that can be located by opening a Program and selecting the Analytics option or you can also hover to the required Program and click Analytics. For information on the Digital Journey > Journey Analytics page, refer to the Program Analytics: Reports Across Programs article.
IMPORTANT: To access Journey Analytics page, User should be Super Admin or they should have Analyze Permission (program) selected in one of the assigned Permission Bundles.
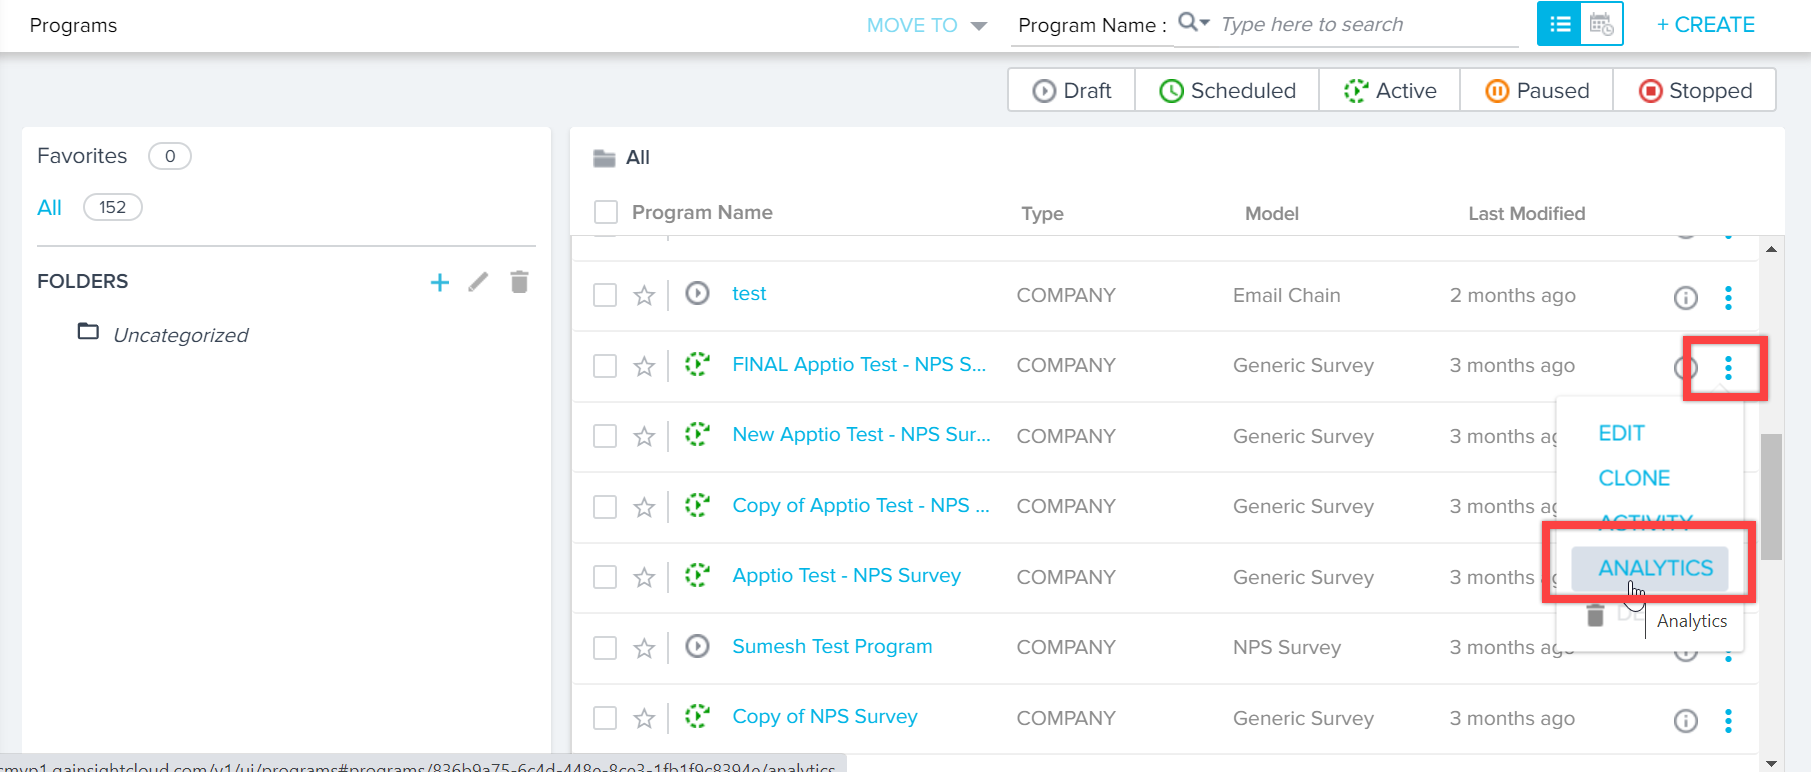
The Programs feature offers pre-built, out-of-the-box analytics about the emails you've sent to participants. To access analytics for a Program, hover over the selected program in the Program list view and click the Analytics icon. This is illustrated below.
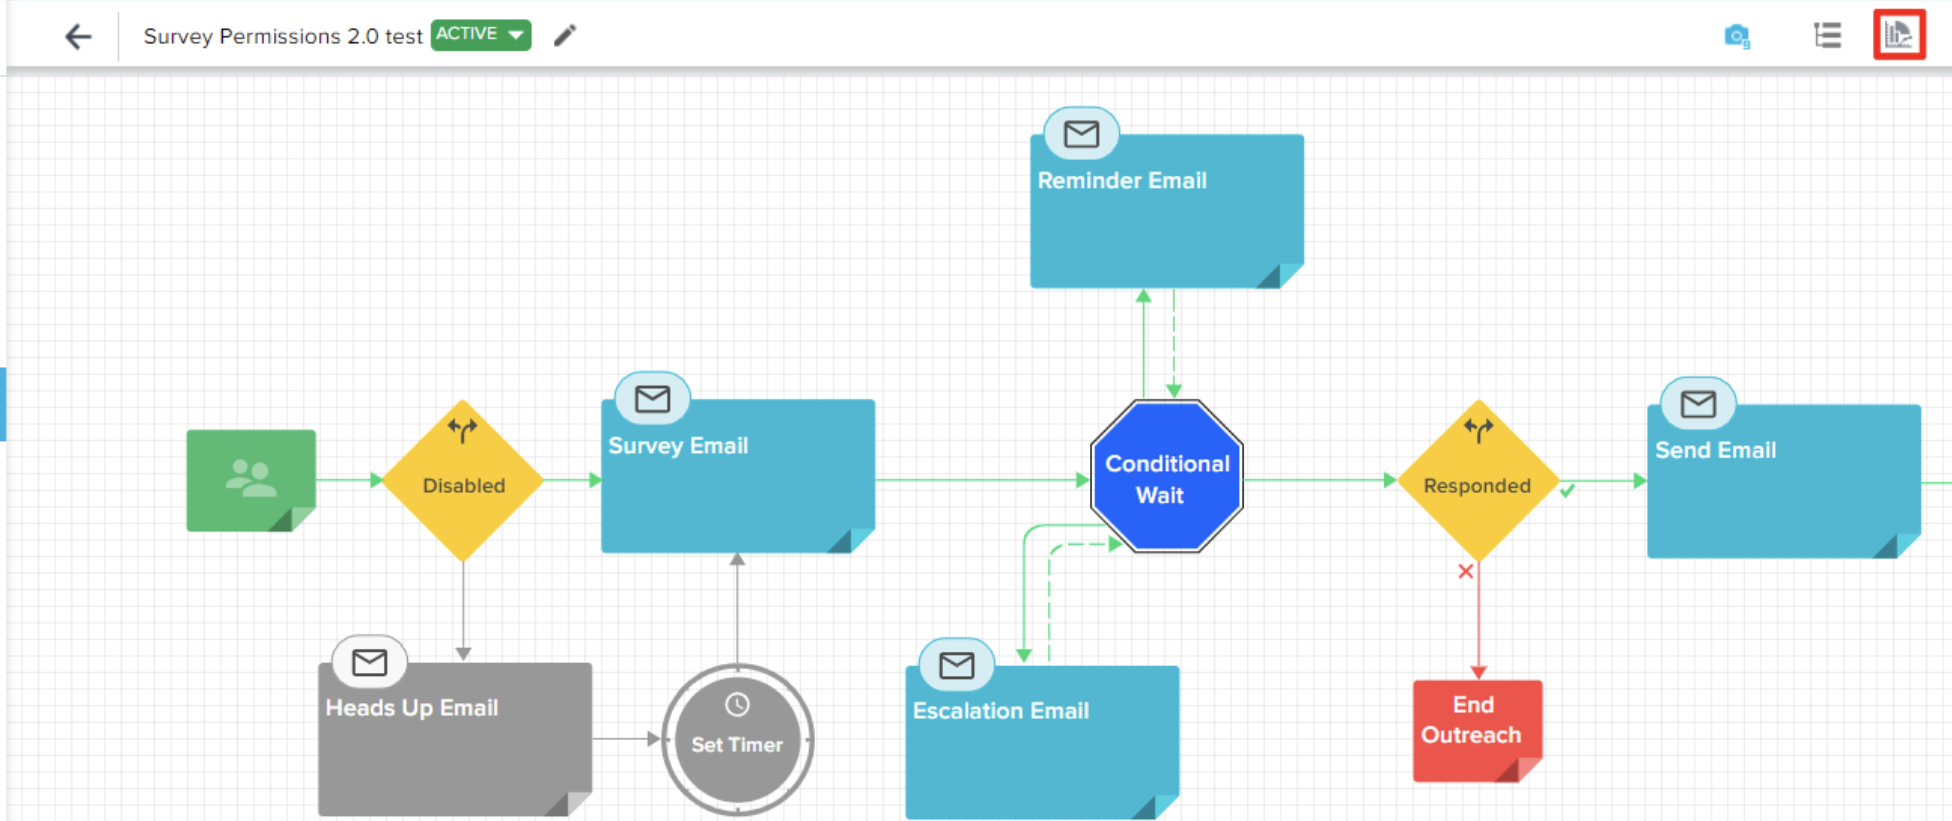
You can also navigate to the analytics page of a published program by clicking the Analytics icon at the top-right of program's model configuration page.
Analytics are pre-built for each program. These reports track information such as response rate, total emails sent, survey click to open rate, and survey response rate. To view Survey responses and analytics, navigate to Surveys > NPS® Analytics. (For more information, refer to the Survey Analytics article.)
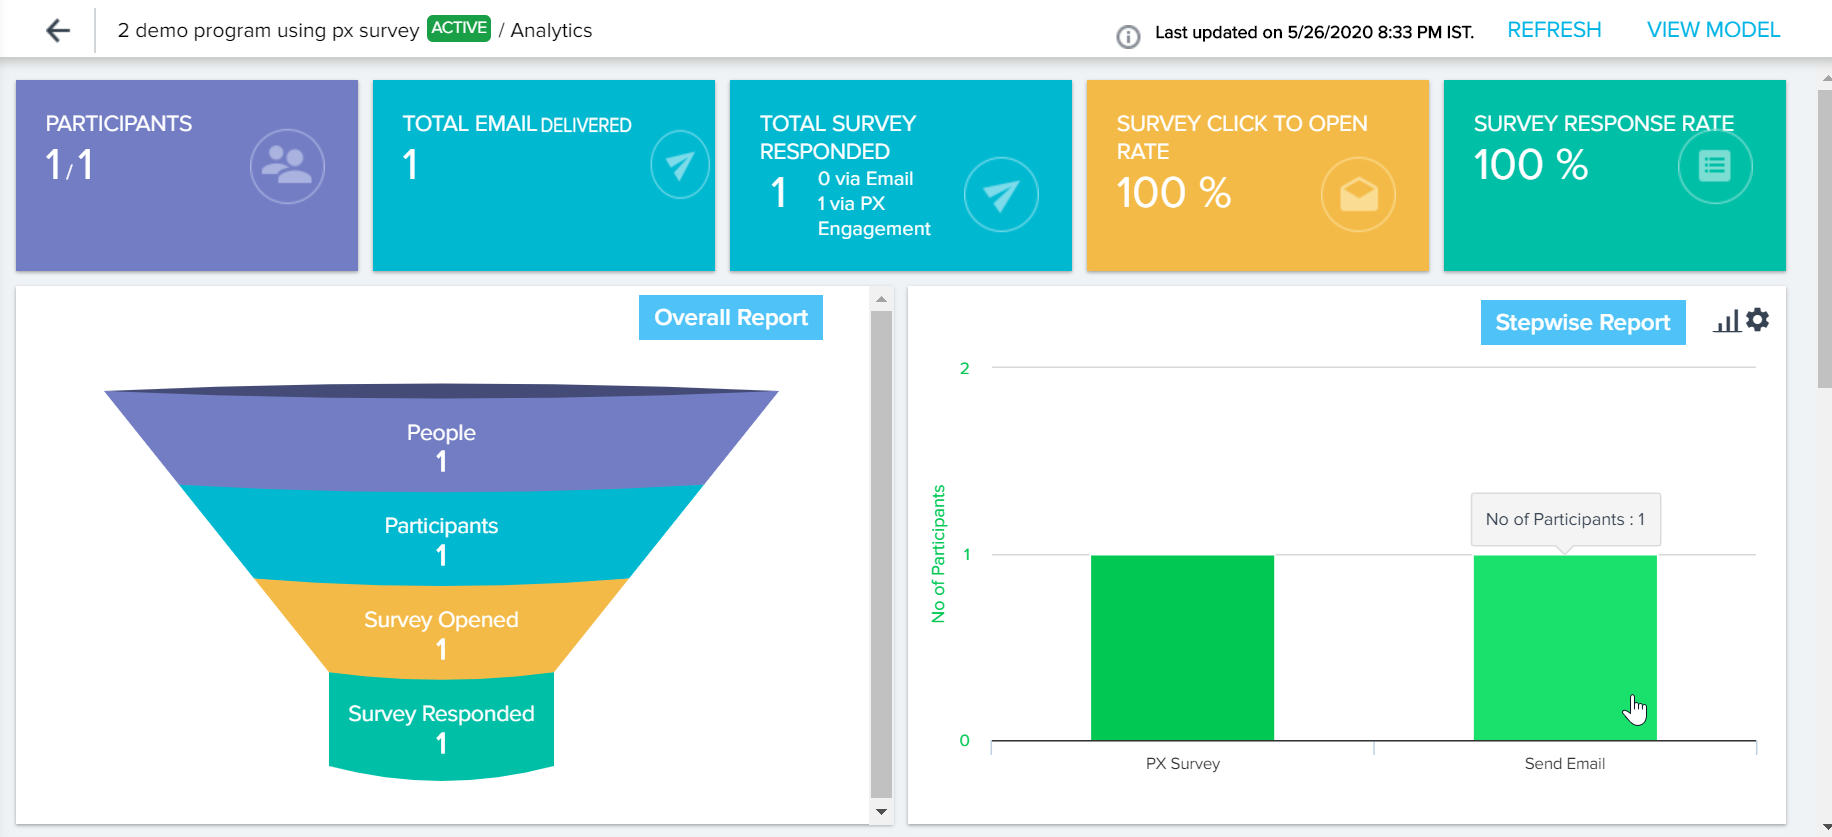
REFRESH (upper right corner): This option triggers a reload of the participant and response data displayed.
VIEW MODEL: Click this button to navigate back to the program's model configuration page.
Widgets
Survey
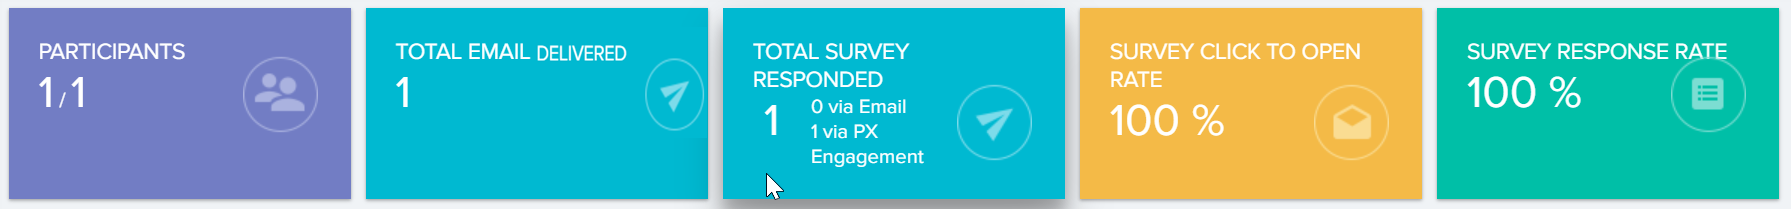
- Participants: This section displays the total number of participants for the program, except those in the Review state.
- Total Email Delivered: This section displays the total number of emails delivered by the Program. This includes all reminders and escalation emails as well.
- Total Survey Responded: This section displays the total number of participants who responded to the survey through Email or PX Engagement.
- Survey Click to Open Rate: The percentage of participants who opened the survey compared to who received the survey.
Note: The email events generally take time to process and it might take around 24 hours to displayed consistent value in the activity feed and program analytics screens. - Survey Response Rate: The percentage of participants who responded to the survey compared to who received the survey.
- Participants: This section displays the total number of participants for the program, except those in the Review state.
- Total Email Delivered: This section displays the total number of emails delivered by the Program. This includes all reminders and escalation emails as well.
- Email Open Rate: This section displays the total number of participants who opened the email.
- Click-to-Open Rate: This percentage shows the participants who clicked a link in the email compared to those who received the email.
.png?revision=1)
Reports
-
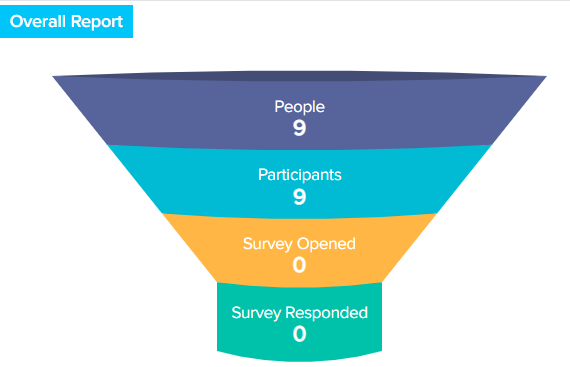
Overall Report: This section displays the number of People (the total number of individual contacts that have been added from a Program's sources, before unsubscribed, bounced, and manually excluded contacts have been removed), the number of program Participants (the total number of active contacts pulled from a Program's sources, after any unsubscribed, bounced, and manually excluded contacts have been removed), the number of people who have clicked the survey, and the number of people who have responded to the survey. Click each of these sections to display a report of the participants in each stage.
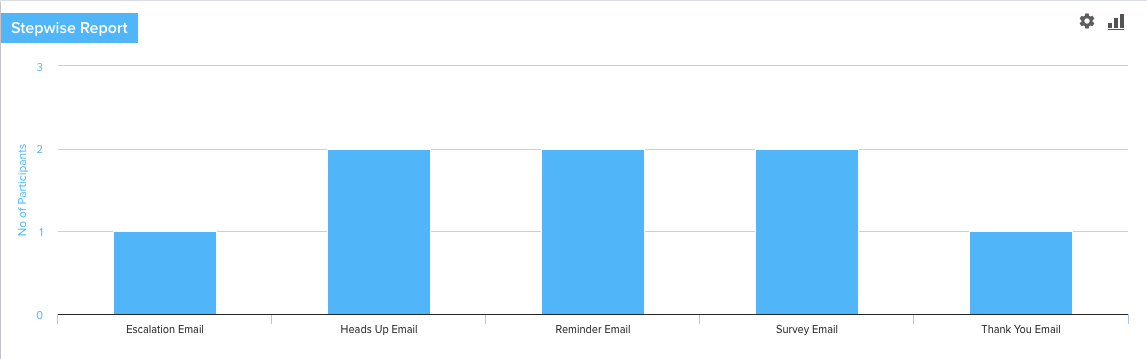
- Stepwise Report: Illustrates the number of participants involved with each step of the program.
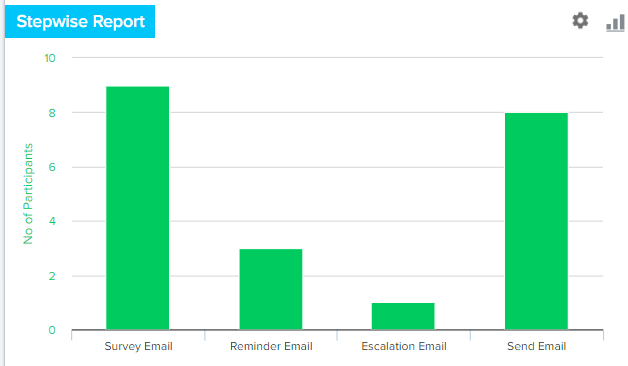
Drilling down on each section of this report will reveal the names of the Participants involved within the Participants tab.
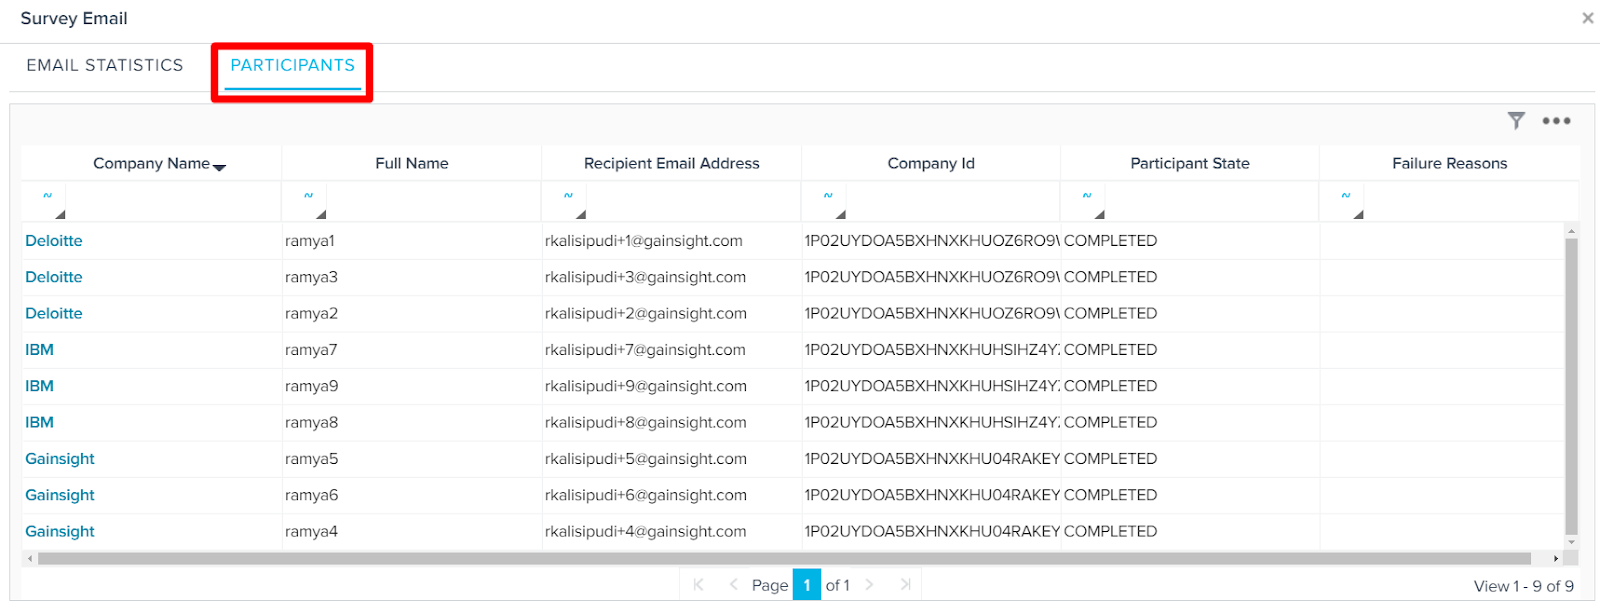
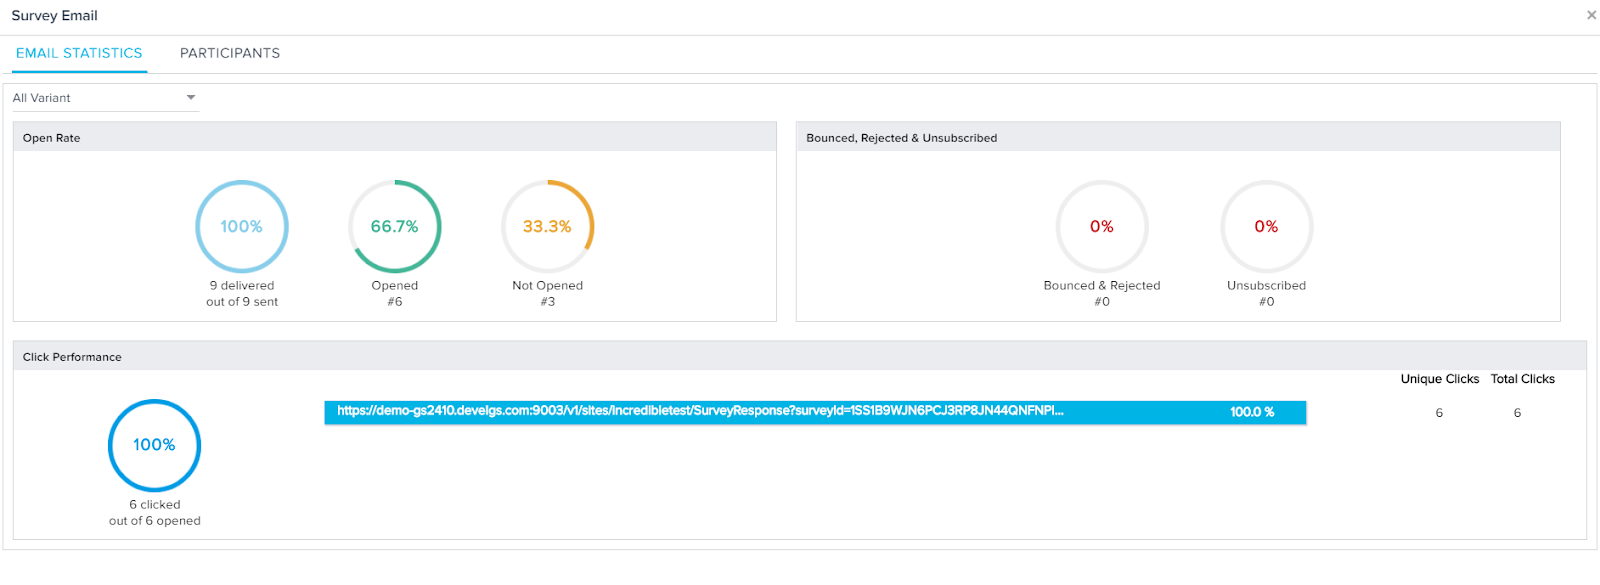
The drill-down also reveals an Email Statistics tab which shows percentages for the following statistics:
- Click Performance: The percentage of participants who have clicked on the survey link sent to them. This also tracks Unique Clicks compared to Total Clicks.
Limitation: It displays only the top five unique links even if there are more than five links in the JO email. - Unsubscribed: The percentage of participants who have unsubscribed from your program.
- Bounced & Rejected: The percentage of messages that failed to be delivered because the recipient’s inbox is full, the exchange server is not accepting any more email, or the email address is invalid, deleted, inactivated, etc. This also includes messages that were marked as spam by the recipient when delivered.
- Delivered: The percentage of messages successfully delivered as part of your program.
- Not Opened: The number of customers/contacts who did not open your email.
- Opened: The number of customers/contacts who opened your email.
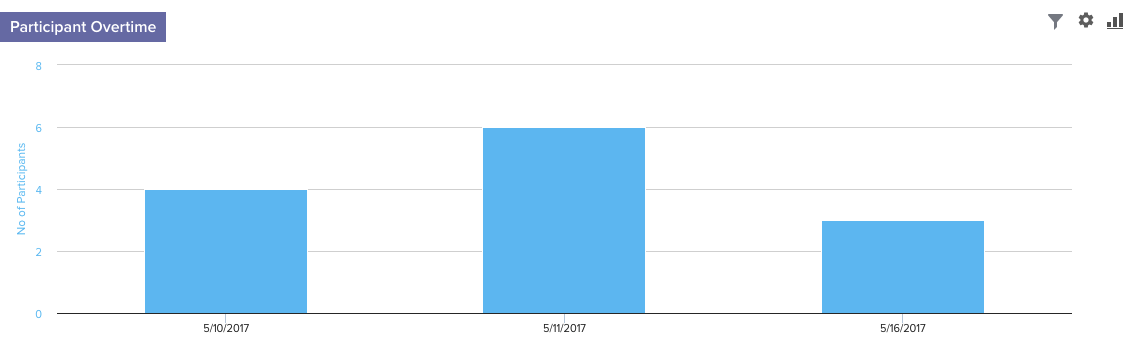
- Participant Overtime: Illustrates the number of participants within the program over time.
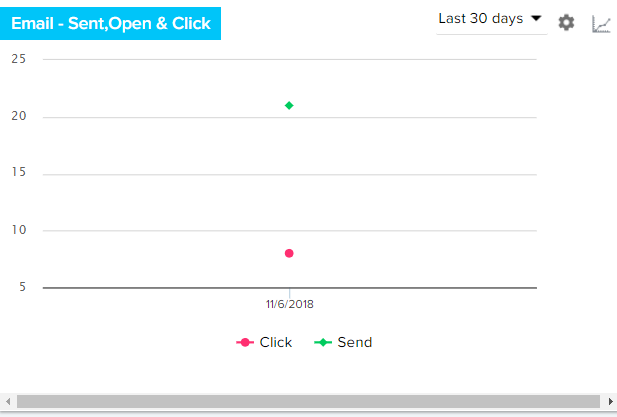
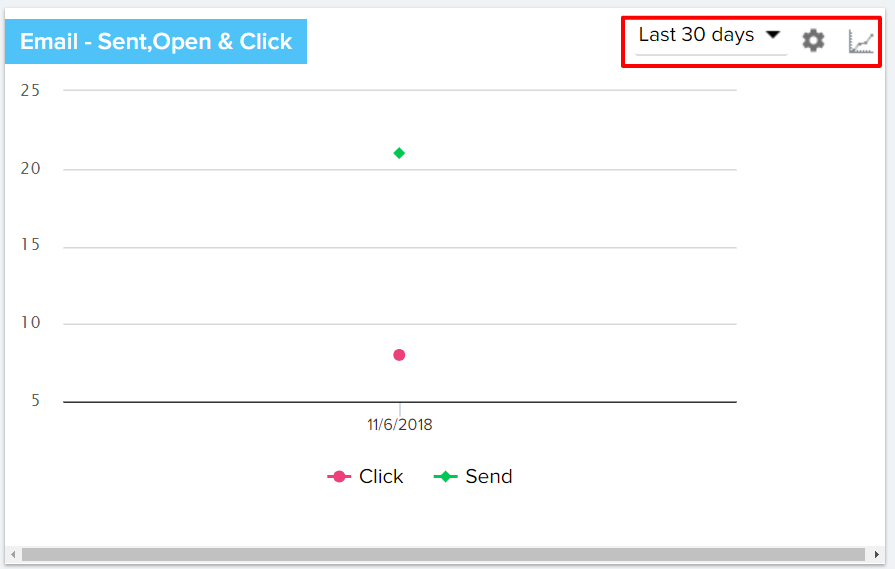
- Email - Sent, Open & Click: The report shows the number of email events over time. The type of events include Sent emails, Open emails, and Surveys clicked on.
Note: Email Opened stats do not exclude machine-opened email numbers; they reflect the actual number of emails opened by humans.
-
Email - Bounce, Unsubscribe, Rejected & Spam: Illustrates the number of participants for whom the emails are bounced, marked as unsubscribed/spam and rejected the Survey over time.
-
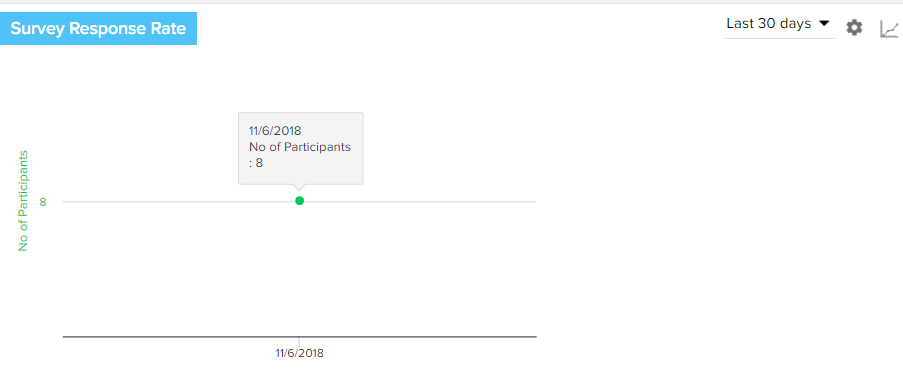
Survey Response Rate: Illustrates the number of participants responding to the Survey over time.
Configuring Reports
Each report in the Program Analytics section can be configured with different Visualization Types, Settings, and Filters.
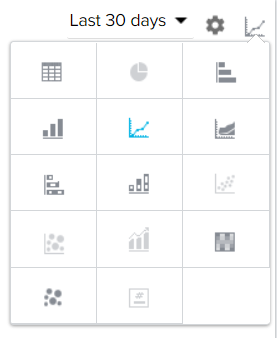
Visualization Types
Users have the option to choose how the data present in each report is displayed. This is limited by the data points present within the report itself. To learn more about different Visualization Types, see the section Visualization Types within the article How to Build Basic Reports.
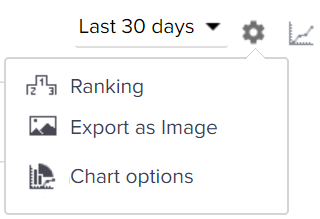
Settings
The Settings, or Gear icon gives users the ability to apply Ranking and Chart Options to the report, as well as the ability to Export the report as an image. For more information on these options see the Ranking, Export as Image, and Other Settings sections of the article How to Build Basic Reports.
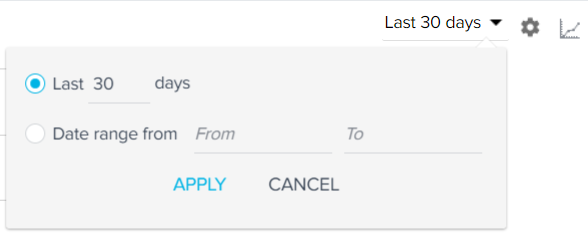
Filter
The filter is based on time and can only be applied to the reports displaying data over time. Filter dropdown left to the Settings icon allows users to set the date range of data displayed within the report. Users can either set this to the “Last X days” or a date range.
If you have questions or feedback about the feature explained in this article, please share them on community.gainsight.com.
- Overall Report: This section shows the number of People (the total number of individual contacts that have been added from a Program's sources, before unsubscribed, bounced, and manually excluded contacts have been removed), the number of outreach Participants (the total number of active contacts pulled from a Program's sources, after any unsubscribed, bounced, and manually excluded contacts have been removed), the number of people who have clicked on the survey, and the number of people who have responded to the survey. Click on each of these sections to display a report of the participants in each stage.
- Email Events: The report shows the number of email events over time. The type of events include Sent emails, Open emails, and Surveys clicked on.
- Stepwise Report: Illustrates the number of participants involved with each step of the outreach.

- Click Performance: The percentage of participants who have clicked on the survey link sent to them. This also tracks Unique Clicks compared to Total Clicks.
Limitation: It displays only the top five unique links even if there are more than five links in the JO email. - Unsubscribed: The percentage of participants who have unsubscribed from your outreach.
- Bounced & Spammed: The percentage of messages that failed to be delivered because the recipient’s inbox is full, the exchange server is not accepting any more email, or the email address is invalid, deleted, inactivated, etc. This also includes messages that were marked as spam by the recipient when delivered.
- Not Opened: The number of customers/contacts who did not open your email.
- Opened: The number of customers/contacts who opened your email.
- Delivered: The percentage of messages successfully delivered as part of your outreach.
- Participant Overtime: Illustrates the number of participants within the outreach over time.
- Survey Response Rate: Illustrates the number of participants responding to the Survey over time.
- Open Tracking: We insert an invisible 1px image into outgoing emails. Whenever this image loads, an external call is made that registers an open event. It is possible that this call is blocked, and therefore, open rates could get underreported. It is also possible that a service such as Proofpoint does this automatically without the user actually opening the email, to ensure all calls and redirects are secure.
- Click Tracking: Email links are customized to have a redirect that registers click events.
| NPS, Net Promoter, and Net Promoter Score are registered trademarks of Satmetrix Systems, Inc., Bain & Company and Fred Reichheld. |