Admin Console
This article explains how Admin Console helps admins to monitor the status of PX engagements and data synchronization with integration platforms.
Overview
Admin console is a one-stop location where administrators can monitor events such as the SDK runtime issues, status of engagements, and integration jobs in the Gainsight PX workspace. The console allows an admin to analyze the possible issues in an easy and scalable manner.
To access, navigate to Administration > MONITORING > Admin Console. The following monitoring options are available:
Engagement Monitoring
The Engagement Monitoring section helps you analyze the errors in the failed engagements. You can drill down each engagement, view the error list, and group them by error or browser details to achieve a detailed analysis. The Engagement Monitoring section identifies and displays the following types of errors:
- Checksum validations
- Invalid HTML tags
- Missing mapped element
- Non-allowed HTML reference domains
With further drill down, you can view the user details and their recent activity that caused the particular error. This helps in root cause analysis and error fixing.
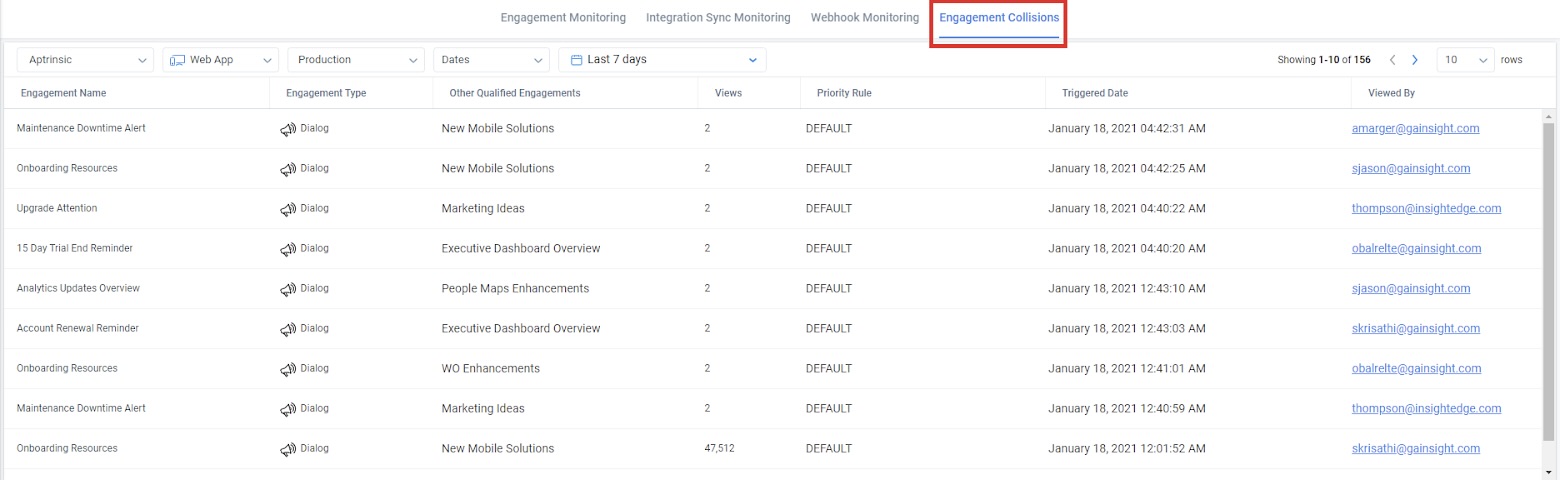
Engagement Collisions
When a user qualifies to view one or more engagements, Gainsight PX checks the priority rules and shows the engagement based on the priority set. The application records such events in the Admin Console to help you track the conflicted prioritized engagements.
The Engagement Collisions tab allows you to view the list of qualified engagements and the following details:
- Name of the qualified engagement. Click on the engagement to navigate to the details screen.
- Name of the engagement(s) that conflicted (other qualified engagement(s)).
- User who viewed the qualified engagement.
Note: In the event of a collision between the two engagements with the same qualification scope, any of the engagements can be shown first. The missed engagement is shown in another session when it qualifies once again.
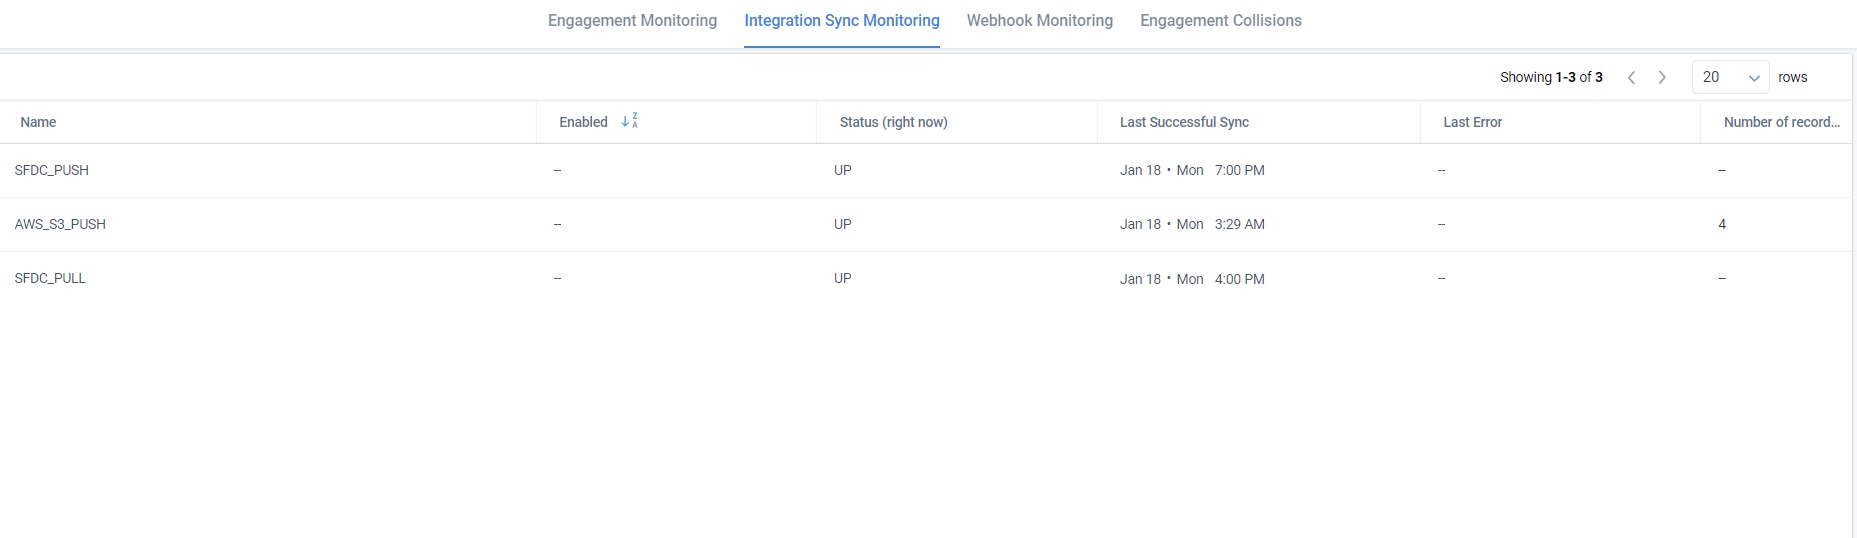
Integration Sync Monitoring
The Integration Sync Monitoring helps to monitor the status of integration jobs such as data sync with the integrated applications/platform, the error details if any, and the number of records processed. The following fields/columns are displayed for each platform:
| Field Name | Description |
|---|---|
| Name | The name of the platform with which PX is integrated for data synchronization. |
| Enabled | Indicates whether the connection to the platform is established. |
| Status | Indicates the status of the connection to the platform. |
| Last Successful Sync | The date and time when the last successful data synchronization was performed. |
| Last Error | The description of the last error that occurred during the data synchronization. |
| Number of records processed | The total number of records that are imported or exported during the recent data synchronization. |
You can drill down each platform record to view the completed data synchronization rounds and the corresponding details for each sync such as the date and time, success/failure status, exceptions and number of records processed.
Webhook Monitoring
When a Webhook event call is triggered, Gainsight PX captures and stores the Webhook information and tracking logs (errors). This information helps you analyze and understand the occurrence of each event.
Navigate to the Webhook Monitoring tab on the Admin Console to view and analyze the Webhook call information such as the Success Count, Failure Count and date and time when the event occurred. From the Webhook Monitoring section, Gainsight PX allows you to:
- Filter the Webhook calls by Product, Channel, Environment, Timeframe or Date range.
- Drill down each Webhook event and view the error list by Event or Error from the Group By drop down.
- Drill down the event/error further to view the error information and event request payload. You can navigate to Webhook configuration or copy the payload.
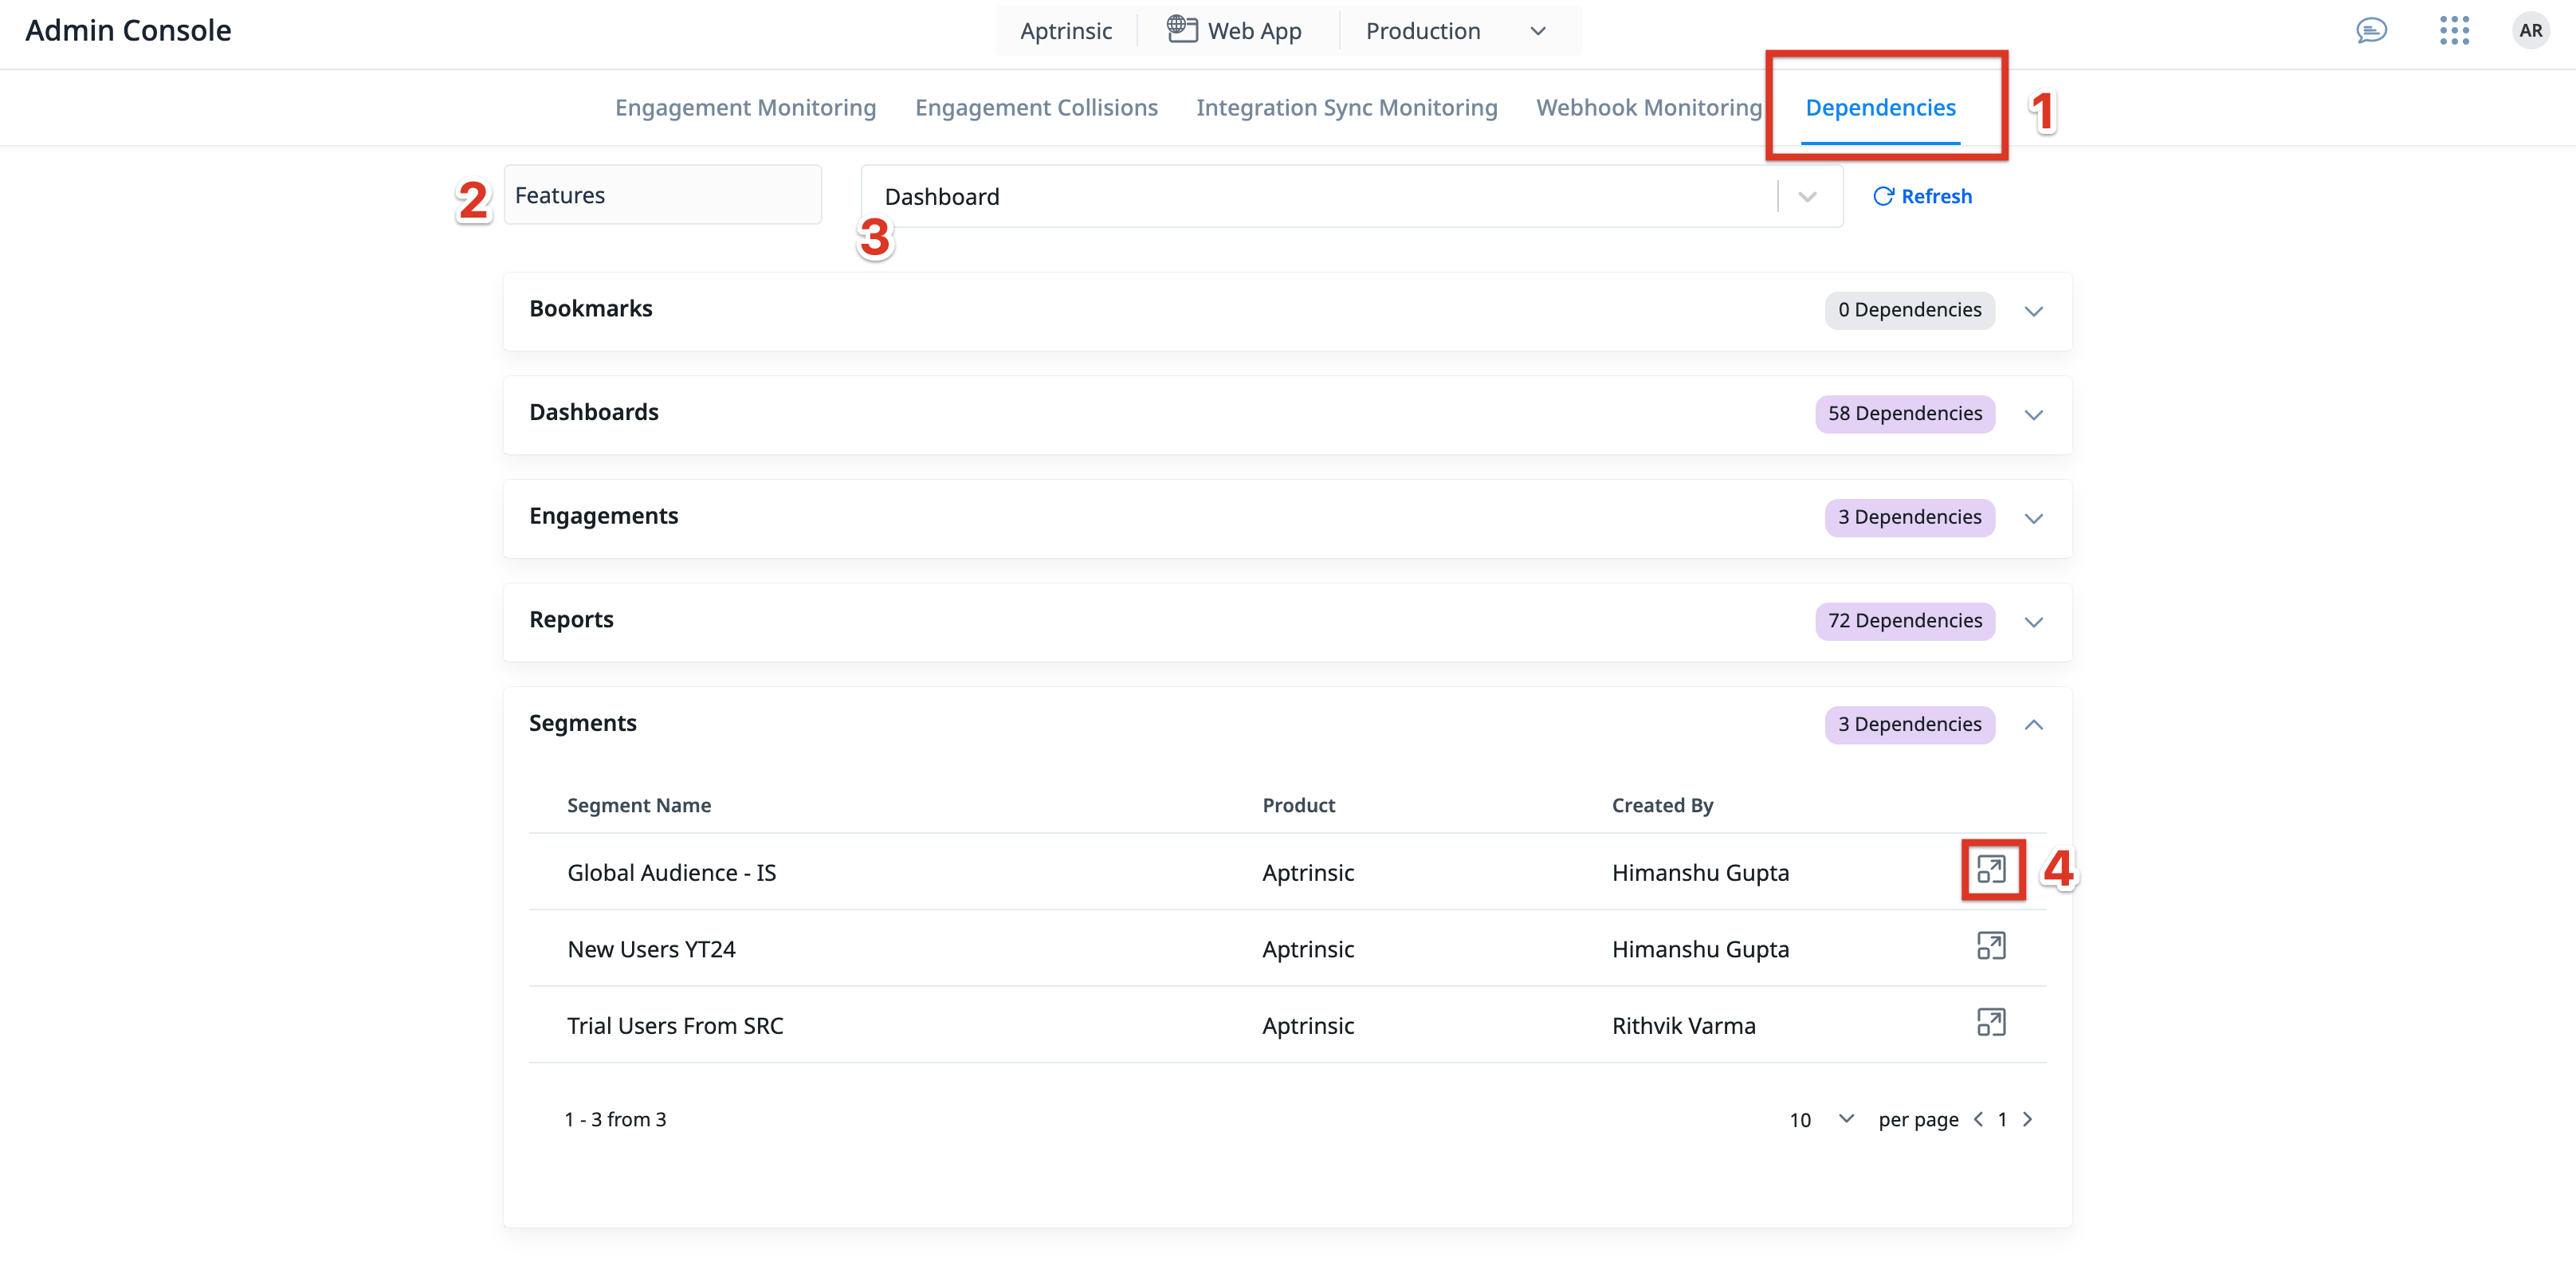
Dependencies
The Dependencies tab offers an intuitive visualization of the usage of active entities throughout PX. This allows you a transparent and effortless way to identify and manage the dependencies of an entity, empowering you to make well-informed decisions before updating or removing the entity.
Business Usecase:
Consider a company that actively uses PX to create engagements based on feature adoption. Over time, some features may become obsolete or less relevant, requiring you to remove them to maintain an efficient feature tree. In such scenarios, you are faced with the challenge of not being able to delete a feature because it is currently used in various engagements or reports. This is where the Dependencies tab comes in handy to quickly identify all the areas in PX that are tagged to the feature. This ensures that any changes made are fully informed, minimizing the risk of impacting the performance of active campaigns or the accuracy of reports.
To view the dependent product areas of an entity:
- In Admin Console, select the Dependencies tab.
- Select the product area.
- Select the asset for which you wish to view the entity being utilized. All product areas using the selected entity are listed.
- (Optional) Click the open in new tab icon to view the required entity in a new tab.
Note: Use the Refresh option to reload the list in case of modifications to the asset or feature area.